Abstract
A growing goal in the field of metabolism is to determine the impact of genetics on different aspects of mitochondrial function. Understanding these relationships will help to understand the underlying etiology for a range of diseases linked with mitochondrial dysfunction, such as diabetes and obesity. Recent advances in instrumentation, has enabled the monitoring of distinct parameters of mitochondrial function in cell lines or tissue explants. Here we present a method for a rapid and sensitive analysis of mitochondrial function parameters in vivo during zebrafish embryonic development using the Seahorse bioscience XF 24 extracellular flux analyser. This protocol utilizes the Islet Capture microplates where a single embryo is placed in each well, allowing measurement of bioenergetics, including: (i) basal respiration; (ii) basal mitochondrial respiration (iii) mitochondrial respiration due to ATP turnover; (iv) mitochondrial uncoupled respiration or proton leak and (iv) maximum respiration. Using this approach embryonic zebrafish respiration parameters can be compared between wild type and genetically altered embryos (mutant, gene over-expression or gene knockdown) or those manipulated pharmacologically. It is anticipated that dissemination of this protocol will provide researchers with new tools to analyse the genetic basis of metabolic disorders in vivo in this relevant vertebrate animal model.
Keywords: Developmental Biology, Issue 71, Genetics, Biochemistry, Cellular Biology, Molecular Biology, Physiology, Embryology, Metabolism, Metabolomics, metabolic profile, respiration, mitochondria, ATP, development, Oil Red O staining, zebrafish, Danio rerio, animal model
Protocol
Part 1: Chemical Treatment of Zebrafish Embryos
Collect zebrafish embryos after fertilization. Incubate at 28.5 °C in E3 medium in 100×15 mm Petri dishes. Note: For in situ hybridization or Oil-Red-O staining, 1-phenyl-2-thiourea (PTU) at a final concentration of 0.2 mM is added to inhibit pigment formation,1 but is not necessary for Seahorse analysis.
For pharmacological studies, add the required chemical at an appropriate final concentration to developing zebrafish embryos at around 26 hr post fertilization (hpf) with an appropriate vehicle-only control. Note: for light-sensitive pharmacological inhibitors, embryos can be allowed to develop in the dark prior to analysis.
Part 2: Live Metabolic Profile Using the Seahorse XF 24 Analyser
Before each run, the Seahorse XF 24 Analyser cartridge that houses the O2 and H+ fluorophores is calibrated through an automated process performed by the analyser.
- Preparation of the 24-well XF 24 islet plate. The following experimental sequence is employed:
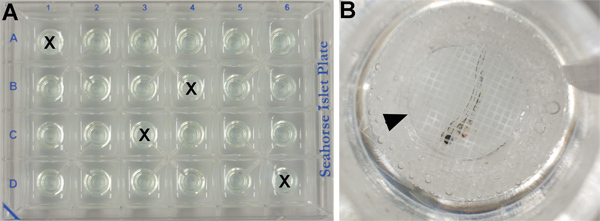
- Since oxygen consumption is sensitive to temperature fluctuations, four wells are used to control for possible temperature fluctuations across the plate. These wells do not contain embryos, but are filled with 700 μl of E3 medium (Figure 2A).
- The remaining 20 wells (see part 2.2) are filled with 700 μl of E3 medium and one embryo each (Figure 2B).
- For each experiment, 10 embryos are treated with vehicle-only (control) and 10 treated with chemical inhibitor (treated). Control and treated embryos are alternated (e.g. well A2: control embryo; well A3: treated embryo: well A4: control embryo; well A5 treated embryo, etc).
- An islet capture screen is added on the top of each well to ensure that the specimen remains in the measurement chamber throughout the assay (Figure 2B). Note: chemically-treated embryos remain with their original chemical solution throughout the entire procedure, with no need to wash out the chemical prior running the Seahorse analyser program.
- Once finished, the plate is loaded into the Seahorse Analyser and the assay is started.
- Analysis of samples. Two different assays are routinely performed.
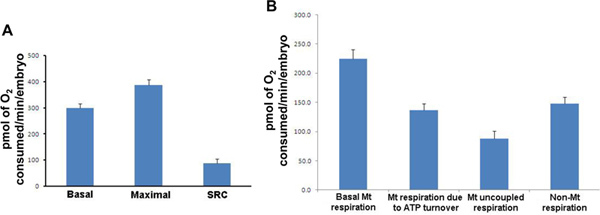
- Basal respiration/Maximum respiration program (duration approx. 90 min). Alterations in basal respiration underpin metabolic dysfunction, while maximal respiration is a measure of total energy production capacity and alterations in this parameter associated with a number of both pathological and physiological states. The spare respiratory capacity, or the capacity for system to further increase ATP production, is also calculated from this test by the subtraction of basal from maximal respiration. Three repeats of each mix (2 min)/wait (1 min)/measurement (2 min) cycle is performed to first establish basal respiration. At the end of the third cycle, a final concentration of 2.5 μM of FCCP (mitochondrial protonophore/uncoupler) is added to each well allowing the measurement of maximum respiration. The measurement cycle is then repeated 5 to 8 times (Figure 3).
- ATP turnover/Proton leak program (duration approx. 60 min). Respiration due to ATP turnover represents the major function of mitochondria in the form of ATP production, while respiration due to proton leak, or uncoupled respiration, is inextricably linked with other parameters of mitochondrial function including basal respiration and reactive oxygen species formation. Respiration due to ATP turnover is represented by the difference in respiration following the addition of 25 μM oligomycin (an inhibitor of ATP synthase) compared to basal respiration. Uncoupled respiration, or respiration due to proton leak, is determined by calculating the difference between oligomycin-mediated respiration and respiration following the addition of 25 μM rotenone (a complex I inhibitor). Measurement cycles are repeated 8 times after addition of each mitochondrial inhibitor.
At the end of the runs, mean values of the 10 control and 10 chemically treated embryos are calculated.
Part 3: Oil-Red-O Staining
Embryos at 50 hpf are dechorionated using fine forceps and fixed in 4% PFA overnight at 4 °C.
Oil-Red-O staining is performed, as previously described2 (see Figure 4).
Representative Results
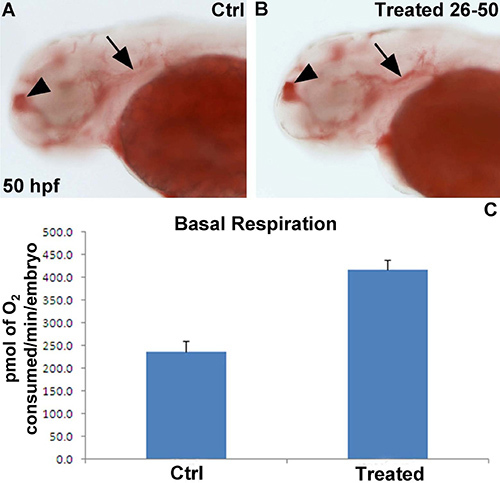
We are interested in understanding the role specific genes on metabolism, particularly respiration rate and lipid metabolism. Therefore, we treated wild type zebrafish embryos from 26 hpf onwards with a specific pharmacological inhibitor of enzyme encoded by one of these genes. At 50 hpf, half of the vehicle and inhibitor-treated embryos were analysed using the Seahorse for mitochondrial function, while the remaining half were fixed in 4% PFA overnight at 4 °C and subsequently stained for lipid deposition with Oil-Red-O. Treatment with the specific enzyme inhibitor led a ~2 fold increase in basal respiration (Figure 4A), which was associated with an increase in lipid deposition especially in the telencephalon and underneath the otic vesicle (Figure 4B,C).
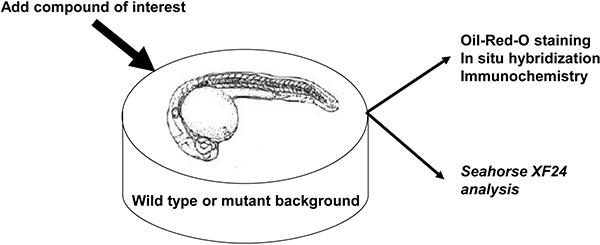
 Figure 1. Schematic representation of chemical treatment of zebrafish embryos. Wildtype, genetically-manipulated, or pharmacologically treated zebrafish embryos are background.
 Figure 2. XF24 islet plate set up. (A) Four wells contain embryonic medium only as temperature control (marked by an X) and the others contain one embryo/well. (B) Close-up of one well (C6) showing a 50 hpf wild type embryo treated with vehicle (DMSO) covered by an islet capture screen (arrowhead).
 Figure 3. Respiration parameters for wild type 50 hpf zebrafish embryos. (A) For each measurement, the mean of the 20 individual embryos is presented. Basal respiration (Mean: 299.7; SD: 75.7; SEM: 16.9), Maximal respiration (Mean: 387.4; SD: 93.3; SEM: 20.9), Spare Respiratory Capacity (Mean: 87.7; SD: 72.0; SEM: 16.1). (B) For each measurement, the mean of the 20 individual results is presented. Basal mitochondrial respiration; mitochondrial respiration due to ATP turnover; mitochondrial uncoupled respiration and non-mitochondrial respiration. Mt: mitochondrial; SRC: Spare Respiratory Capacity; SD: Standard Deviation, SEM: Standard Error of Mean. Results are presented in pmol of O2 consumed/min/embryo. Click here to view larger figure.
 Figure 4. Representative results of chemical exposure on basal respiration and lipid deposition. (A,B) 50 hpf embryo stained with Oil-Red O in lateral view. The embryo incubated with the selective inhibitor (B) displays more Oil-Red-O staining in the telencephalon (arrowhead) and underneath the otic vesicle (arrow) compared to a vehicle-treated control embryo. (C) Basal respiration shows an ~ 2 fold increase in chemically treated embryos (n=10 embryos per group). Results are presented in pmol of O2/min/embryo.
Discussion
Zebrafish is a well-established genetic model for both forward (ENU mutagenesis) and reverse (Tilling, zinc finger nuclease targeted knock-out, morpholino knockdown) genetic approaches3,4, while gene function in zebrafish embryos can also be easily blocked or activated using selective pharmacological compounds specific for the encoded products. Due to their external development and small size, zebrafish embryos are particularly suitable for metabolic analysis. However, robust measurement of metabolic profile and mitochondrial function in vivo in zebrafish embryos has not been achieved, with only one preliminary description reported5. Seahorse analysis was originally designed for cell-based metabolic studies and has been demonstrated to give accurate and reliable results6. The application of this new methodology to zebrafish embryos is significant, and likely to augment the wider usage of this model for metabolic studies.
In this study, we demonstrate measurement of a range of respiration parameters in zebrafish embryos using the Seahorse Analyser, including basal respiration, maximal respiration, spare respiratory capacity, ATP turnover and proton leakage. We also provide an example of how such measurements can be correlated with other physiological parameters, in this case lipid accumulation, and of the use of pharmacological inhibitors in this assay system. Combined with the use of genetically-altered embryos, this provides a powerful experimental platform for understanding factors impacting on metabolism.
There are a variety of applications for this new methodology, with mitochondrial dysfunction is implicated in many human diseases, such as Diabetes mellitus7, obesity8, multiple sclerosis9, Parkinson's diseases10, Alzheimer's disease11 and some type of cancers12. Importantly, our work is performed in vivo, where all environmental influences - such as cytokines, development-related growth etc - are active, thereby providing a physiologically relevant view in vivo respiration and metabolic profile. As chemical screens are also routinely performed in wild type and mutant background zebrafish embryos (Figure 1), novel pharmaceuticals that influence respiration, mitochondria function or metabolism could be easily identified using the Seahorse analyser. The results generated using the Seahorse analyser could be used in conjunction with other assays to provide additional information. This can include physiological analysis, such as Oil-Red Staining, or molecular analysis, such as in situ hybridization for specific adipocyte markers such as cebpα, Pparα, Pparγ, FAS etc.
There remain some limitations to this methodology. Although we and others were able to use oligomycin to measure ATP production and proton leak on young embryos5 (see Figure 3), in embryos older than 60 hpf oligomycin treatment is inefficient. We believe that in older embryos oligomycin cannot diffuse as easily than in younger embryos making the results impossible to interpret. Since the oligomycin results are mandatory for the determination of respiration due to ATP turnover and uncoupled respiration, we are currently investigating higher concentrations of oligomycin for older embryos. However, antimycin A treatments remain effective longer, with other measurements, such as basal respiration, maximum respiration and spare respiratory capacity, can be performed in older zebrafish embryos, up to 68 hpf (not shown).
Another limitation in using the current Seahorse Analyser setup is the physical space within each islet capture plate well, such that they are only suitable for zebrafish embryos and young larvae. Therefore, performing metabolic studies on diet-induced obesity in adult fish, for example, is not yet technically feasible. However, this study may prompt the development of plates specifically designed for juvenile or adult fish, thereby extending the scope of analyses possible.
Disclosures
No conflicts of interest declared.
Acknowledgments
The authors would like to thank the staff members of the Deakin University Zebrafish Facility for providing excellent ongoing husbandry care. YG is supported by an Alfred Deakin Postdoctoral Research Fellowship and a Central Research Grant from Deakin University. SLM is supported by an NHMRC Career Development Fellowship. ACW is supported by an NHMRC Enabling Grant. All authors are supported by the Molecular & Medical Research Strategic Research Centre at Deakin University.
References
- Nüsslein-Volhard C, Dahm R. Zebrafish. Oxford University Press; 2002. [Google Scholar]
- Schlombs K, Wagner T, Scheel J. Site-1 protease is required for cartilage development in zebrafish. Proc. Natl. Acad. Sci. U.S.A. 2003;100:14024–14029. doi: 10.1073/pnas.2331794100. [DOI] [PMC free article] [PubMed] [Google Scholar]
- Ingham PW. The power of the zebrafish for disease analysis. Hum. Mol. Genet. 2009;18:R107–R112. doi: 10.1093/hmg/ddp091. [DOI] [PubMed] [Google Scholar]
- Nasevicius A, Ekker SC. Effective targeted gene 'knockdown' in zebrafish. Nat. Genet. 2000;26:216–220. doi: 10.1038/79951. [DOI] [PubMed] [Google Scholar]
- Stackley KD, Beeson CC, Rahn JJ, Chan SS. Bioenergetic profiling of zebrafish embryonic development. Plos One. 2011;6:e25652. doi: 10.1371/journal.pone.0025652. [DOI] [PMC free article] [PubMed] [Google Scholar]
- McGee SL, Sadli N, Morrison S, Swinton C, Suphioglu C. DHA protects against zinc mediated alterations in neuronal cellular bioenergetics. Cell Physiol. Biochem. 2011;28:157–162. doi: 10.1159/000331724. [DOI] [PubMed] [Google Scholar]
- Sivitz WI, Yorek MA. Mitochondrial dysfunction in diabetes: from molecular mechanisms to functional significance and therapeutic opportunities. Antioxid. Redox Signal. 2010;12:537–577. doi: 10.1089/ars.2009.2531. [DOI] [PMC free article] [PubMed] [Google Scholar]
- Bournat JC, Brown CW. Mitochondrial dysfunction in obesity. Curr. Opin. Endocrinol. Diabetes Obes. 2010;17:446–452. doi: 10.1097/MED.0b013e32833c3026. [DOI] [PMC free article] [PubMed] [Google Scholar]
- Ghafourifar P, et al. Mitochondria in multiple sclerosis. Front Biosci. 2008;13:3116–3126. doi: 10.2741/2913. [DOI] [PubMed] [Google Scholar]
- Winklhofer KF, Haass C. Mitochondrial dysfunction in Parkinson's disease. Biochim. Biophys. Acta. 2010;1802:29–44. doi: 10.1016/j.bbadis.2009.08.013. [DOI] [PubMed] [Google Scholar]
- Maruszak A, Zekanowski C. Mitochondrial dysfunction and Alzheimer's disease. Prog. Neuropsychopharmacol. Biol. Psychiatry. 2011;35:320–330. doi: 10.1016/j.pnpbp.2010.07.004. [DOI] [PubMed] [Google Scholar]
- de Moura MB, dos Santos LS, S L, Van Houten B. Mitochondrial dysfunction in neurodegenerative diseases and cancer. Environ. Mol. Mutagen. 2010;51:391–405. doi: 10.1002/em.20575. [DOI] [PubMed] [Google Scholar]


