Abstract
Detection and interpretation of olfactory cues are critical for the survival of many organisms. Remarkably, species across phyla have strikingly similar olfactory systems suggesting that the biological approach to chemical sensing has been optimized over evolutionary time1. In the insect olfactory system, odorants are transduced by olfactory receptor neurons (ORN) in the antenna, which convert chemical stimuli into trains of action potentials. Sensory input from the ORNs is then relayed to the antennal lobe (AL; a structure analogous to the vertebrate olfactory bulb). In the AL, neural representations for odors take the form of spatiotemporal firing patterns distributed across ensembles of principal neurons (PNs; also referred to as projection neurons)2,3. The AL output is subsequently processed by Kenyon cells (KCs) in the downstream mushroom body (MB), a structure associated with olfactory memory and learning4,5. Here, we present electrophysiological recording techniques to monitor odor-evoked neural responses in these olfactory circuits.
First, we present a single sensillum recording method to study odor-evoked responses at the level of populations of ORNs6,7. We discuss the use of saline filled sharpened glass pipettes as electrodes to extracellularly monitor ORN responses. Next, we present a method to extracellularly monitor PN responses using a commercial 16-channel electrode3. A similar approach using a custom-made 8-channel twisted wire tetrode is demonstrated for Kenyon cell recordings8. We provide details of our experimental setup and present representative recording traces for each of these techniques.
Keywords: Neuroscience, Issue 71, Neurobiology, Biomedical Engineering, Bioengineering, Physiology, Anatomy, Cellular Biology, Molecular Biology, Entomology, Olfactory Receptor Neurons, Sensory Receptor Cells, Electrophysiology, Olfactory system, extracellular multi-unit recordings, first-order olfactory receptor neurons, second-order projection neurons, third-order Kenyon cells, neurons, sensilla, antenna, locust, Schistocerca Americana, animal model
Protocol
1. Odor Preparation and Delivery
Dilute odor solutions in mineral oil by volume to achieve the desired concentration level. Store a 20 ml mixture of mineral oil and the odorant in a 60 ml glass bottle. Insert two syringe needles into a rubber stopper (gauge 19), one from the bottom and the other from the top, to provide an inlet and an outlet line. Seal the glass bottle with this rubber stopper and attach a custom designed activated carbon filter to the inlet line (Figure 1A).
The carbon filter is made using two 6 ml syringes. Cut the syringes in half and discard the plunger end. Fill each of the remaining pieces with cotton and activated charcoal before connecting them together using heat-shrink tubing.
Connect the outlet line of the odor bottle (using polyethylene tubing, I.D. 0.86 mm) to the plastic tube (Nalgene FEP Tubing, I.D. 5.8 mm) that supplies a constant airflow across the antenna (Figure 1B).
Direct carbon-filtered, dehumidified air (carrier gas; flow-rate, 0.75 L/min) towards the locust using a plastic tube placed within a few cm of the locust antenna.
For odor stimulation, displace a constant volume (0.1 L/min) of the static headspace above the odor solution in the bottle. This is achieved by injecting an equal amount of dehumidified air into the bottle using a Pico-pump (WPI, PV-820). The vapors from the odor bottle are directed through the outlet line onto the airflow tube (Figure 1B).
Remove the delivered odor vapors by placing a vacuum funnel ~10 cm behind the locust antenna.
2. Preparing Locust Antenna for Single Sensillum Recording
Select a young-adult locust of either sex with fully-grown wings, but prior to the mating stage from a crowded colony. To restrain the locust, first amputate its legs. Seal the amputation sites with tissue adhesive (Vetbond, 3M). Secure the locust to a custom designed chamber using a small piece of electrical tape draped around its thorax (Figure 2A).
Under a dissection microscope, make a shallow groove in the wax platform (Figure 2A) for antenna placement. Place the antenna into the groove and stabilize it using batik wax at the two ends of the antenna (Figure 2B; an electrowaxer is used for melting the wax).
Insert a ground electrode (chlorided silver wire) into the thorax (~1 cm away from head). Use batik wax to both seal the incision site and hold the ground wire in place (Figure 2A).
3. Single Sensillum Recording to Monitor Odor-evoked Responses from Olfactory Receptor Neurons (ORNs)
Place the stabilized locust antenna under a stereomicroscope (Leica M205C) on a vibration isolation table (TMC) (Figure 3A). Make sure that the base of the recording sensillum is clearly visible (Figure 3B).
Use a micropipette puller (Sutter P-1000) to fabricate glass electrodes (impedance 3-10 MΩ when filled with locust saline9, tip diameter 1-3 μm) using a borosilicate glass capillary tube (O.D. 1.2 mm, I.D. 0.69 mm).
Place the glass electrode into a micropipette holder that is attached to a motorized micromanipulator (Sutter MP-285). Gently insert the electrode into the base of a sensillum (Figure 3B). Note that each sensillum can contain 3-50 ORNs in locusts10.
Amplify the signal (10,000 times) using an A.C. amplifier (Grass P-55). Filter the signal between 0.3 - 10.0 kHz and acquire at a 15 kHz sampling rate (Figure 3D) using a data acquisition system (LabView, PCI-MIO-16E-4 DAQ cards; National Instruments).
4. Locust Dissection Procedure for Antennal Lobe and Mushroom Body Recordings
Follow the restraining procedures as described in section 2.1. Position the locust in a custom-designed chamber as shown in Figure 4A and B.
To perfuse saline during and after the dissection procedure, build a wax cup around the locust head. The wax cup should start just above the mouth parts, and extend beyond the compound eyes encompassing the region between the two antennae as shown in Figure 4C.
To allow the antennae to pass through the wax cup, create small tunnels on both sides using plastic (polyethylene) tubing (5 mm long, I.D. 0.86 mm). Ensure that the plastic tubing can slide through the wax cup. The latter is achieved by using a rubber gasket that tightly wraps around the plastic tube but is attached to the wax-cup (Figure 4C).
Using epoxy resin, attach the base of the antennae to the bottom end of the plastic tubing. This step ensures that the antennae are held in place even after the surrounding cuticle is removed.
Keep the wax cup filled with saline solution9 from this point onwards. Begin by removing a central rectangular region between the two antennae (longer side of the rectangle aligned with the anteroposterior axis). Subsequently, remove cuticle in neighboring regions without disturbing the compound eyes and cuticle at the base of the antenna (Figure 4D).
Using fine forceps, gently remove air sacs and fat bodies surrounding the brain. At the end of this step, the locust brain should be clearly seen (Figure 4D). Notice that the brain regions that process the olfactory information (with light yellow pigmentation) are situated between the two antennae.
In locusts the gut runs below the brain and along the length of the body. To prevent movement of the gut from potentially destabilizing the preparation, gently pull the foregut and cut it using fine scissors. Make a small incision in the abdomen just above the rectum and remove the gut by pulling the hindgut with coarse forceps. To prevent a saline leak, tie the abdomen immediately anterior to the incision site with suture threads.
Use a small platform made of a thin wire coated with a fine layer of wax to elevate the brain and stabilize it11 during electrophysiology as shown in Figure 4D.
The insect brain is covered by a thin insulating sheath that needs to be removed prior to experiments. To desheath the brain, gently spread a small amount of an enzyme (0.3-0.4 mg protease, Sigma Aldrich) over the surface of the brain using fine forceps9. After ~5-10 s of enzyme application, rinse the brain thoroughly with saline. Using super-fine forceps very gently pinch and pull the sheath up and subsequently tear it open over the recording locations (AL and MB; shown in Figure 4E, F).
5. Multi-unit Recordings from the Antennal Lobe and the Mushroom Body
Place the locust preparation (Figure 5A) under a stereomicroscope suspended from a boom stand placed on a vibration isolation table.
Maintain a constant saline perfusion rate (about 0.04 L/hr) throughout the experiment. Use a chlorided silver wire immersed in the saline-filled wax cup as the ground electrode.
For PN recordings, use a 16-channel silicon probe (NeuroNexus Technologies, item #A2x2-tet-3mm-150-150-121-A16, Figure 5B). Prior to each experiment, electroplate the electrodes with gold to achieve impedances in the 200-300 kΩ range. Use the circuit shown in Figure 7 for electroplating.
Position the electrode close to the surface of the antennal lobe and gently insert it into the tissue using a manual micromanipulator (WPI, M3301R) (Figure 5D).
Advance the electrode in ~10 μm steps. Wait 2-3 min at each step and evaluate the acquired signal quality. In an ideal recording site, extracellular signals will be picked up by multiple recording channels and will have a high signal-to-noise ratio (SNR > 3-5 times noise SDs).
For KC recordings, use a custom-made twisted wire tetrode (Figure 5C; step-by-step fabrication procedure presented in Section 6). Electroplate these electrodes as discussed in step 5.3. Place the tetrode on the surface of the MB (Figure 5E) as KC somata are restricted to the superficial layer of the MB8.
Both PN and KC recordings can be made simultaneously from same locust preparation as schematically shown in Figure 5A.
Wait at least 15 min after finding the recording location to allow stabilization of the electrodes.
Acquire all extracellular signals at 15 KHz, filter between 0.3-6 KHz, and amplify (10,000 times) using a 16 channel AC amplifier (Biology Electronics Shop; Caltech, Pasadena, CA) (Figure 6A, B).
6. Procedures to Make Twisted Wire Electrode for KC Recordings
To design a multi-unit electrode for KC recordings, use insulated nickel chromium wire (RO800, 0.0005" filament)8.
If eight electrodes are desired then wrap the wire around a 10-15 cm long piece of cardboard 4 times. The ends of the cardboard can be covered with plastic tubing to prevent the edges from cutting the wire. While wrapping, make sure there is little slack, but ensure that the wire is not taut. Handle the wire carefully as it breaks easily.
Bunch the wires together at the top of the cardboard and use a piece of tape (Time Tape, T-534-RP) to hold them together. Cut the strands at the other end. Remove the wire strands and group the wires at the cut end as well using another piece of the tape.
Using a titer plate shaker (Thermo Scientific, Model 4625Q), wind the strands together (~72 rev/min for 3 min) to form one twisted wire. The bottom of the taped strands can be clipped to the titer plate rotor and the top can be clipped to a boom stand. During winding, the wire should have little slack, yet not be taut.
Melt the insulation together with a heat gun (Weller 6966C) to stick the individual strands together and form a single wire. 3-4 slow passes (3-4 sec each) over the length of the wire should be sufficient to heat and fuse the strands together. Then release the wire from the bottom and allow it to relax. Trim the wire near the ends to remove the tape.
Insert one end of the wire through a 5-6 cm long, glass capillary tube (O.D. 1.0 mm, I.D. 0.58 mm). Tease apart the twisted wire at one end using fine tweezers and remove the coating by very briefly torching the end using a flame. This step must be done carefully; exposing the wire to the flame for too long will cause the strands to melt and tangle.
Gently separate the 8 strands on the flamed end and solder each strand separately into an 8-pin IC socket. Coat the top of the IC socket with epoxy to hold the strands and glass capillary in place. Also place a small drop of epoxy at the other end of the capillary to hold the wire in place (Figure 5C).
Finally, cut the tip of the wire at a 45 degree angle with carbide scissors about 0.5 cm from the capillary tip.
Representative Results
Odor-evoked responses of a single ORN to two different alcohols are shown in the Figure 3D. Depending on the recording location (sensilla type, placement of the electrode) multi-unit recordings can be achieved.
A raw extracellular waveform from an AL recording is shown in Figure 6A. Action potentials or spikes of varying amplitudes originating from different PNs can be observed in this voltage trace. Although the locust antennal lobe has excitatory projection neurons and inhibitory local neurons, only PNs generate sodium spikes that can be detected extracellularly3. This observation suggests that the multi-unit recording technique presented here can be used to selectively monitor the output of the antennal lobe circuits, thereby making locusts an attractive invertebrate model for studying olfactory coding.
An example of a mushroom body recording is shown in Figure 6B. Unlike the ORNs and PNs, the KCs have lower baseline activity and respond to odors in a sparse and selective manner.
To isolate single unit responses from these multi-unit recordings, we performed off-line spike sorting (with the best four channels) using published software implemented in IGOR Pro (Wavemetrics)12. Examples of PN and KC spike sorting are shown in Figure 6C, and D, respectively.
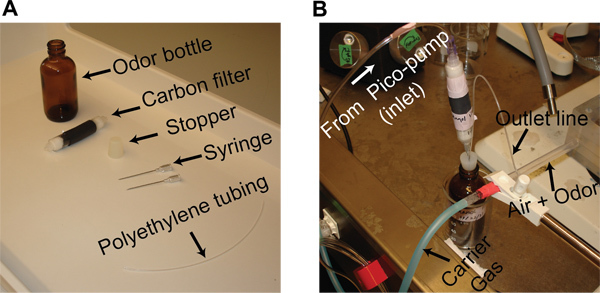 Figure 1. Odor stimulation. (A) All components needed for preparing an odor bottle are shown. (B) The inlet connection from the pico-pump and the outlet connection from the odor bottle to the odor delivery tube are shown. A constant stream of desiccated air is used as the carrier gas stream and is directed at the antenna during experiments.
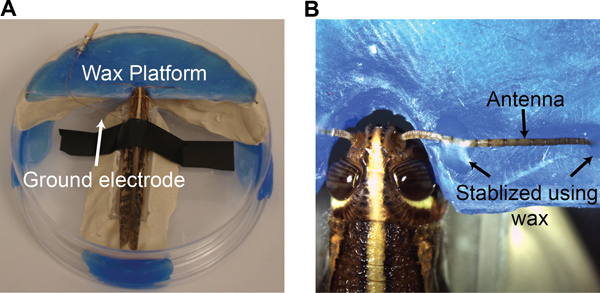 Figure 2. Preparation of a locust antenna for single sensillum recordings. (A) The locust is placed in a custom made chamber with a ground electrode placed in the gut. (B) A method to stabilize an antenna using a wax platform is shown.
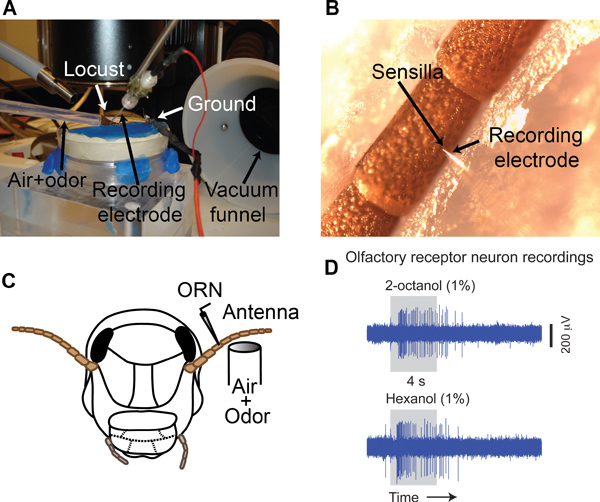 Figure 3. Single sensillum recordings. (A) A typical recording set up. A mixture of carrier gas and odor vapor is supplied through a delivery tube. ORN action potentials are recorded using a glass electrode. Delivered odorants are removed using a vacuum funnel situated right behind the antenna. (B) Electrode placement as seen through the stereomicroscope. Arrows indicate the placement of the glass electrode tip at the base of a sensillum. (C) A schematic of the single sensillum recording approach. (D) Raw extracellular voltage traces showing responses of an ORN to two different odors (2-octanol and 1-hexanol).
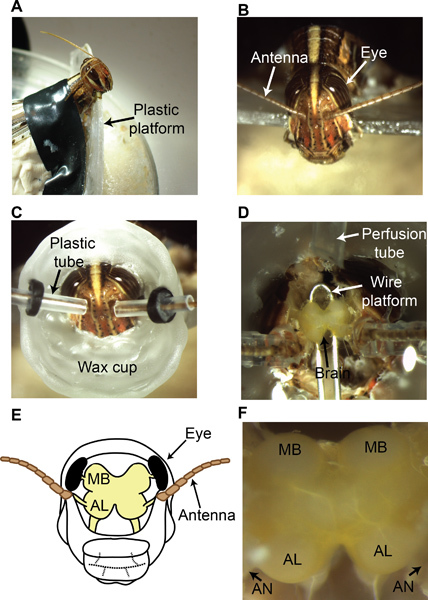 Figure 4. Locust dissection procedure. (A) A locust is restrained and positioned in a custom-designed dissection setup as shown. (B) View of the locust head from above. Both compound eyes and antennae can be clearly seen (C) A wax cup is built around the dissection site to allow saline perfusion during and after the dissection process. (D) An exposed locust brain is shown (the yellow-pigmented neural tissue). A platform is placed beneath the brain as shown to stabilize the brain. A saline perfusion tube is attached to the wax cup. (E) A schematic of the locust brain. (F) A magnified image of the locust brain after the dissection clearly showing the regions of interest: antennal lobes (AL) and the mushroom bodies (MB). The antennal nerve (AN) contains axon bundles that transmit the ORN action potentials from the antenna to the antennal lobe.
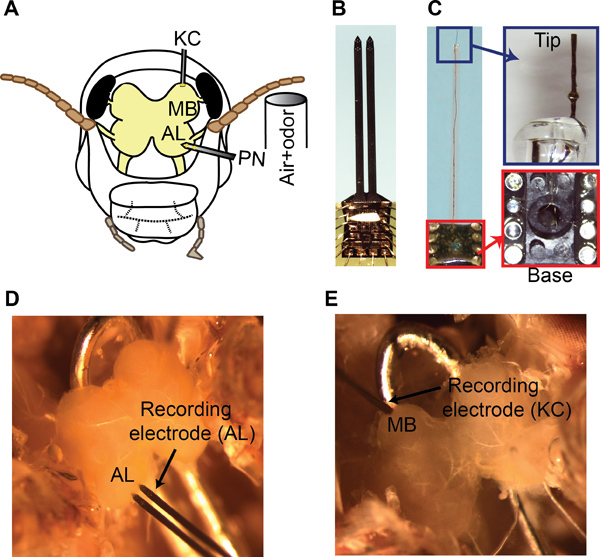 Figure 5. Multi-unit recordings from the antennal lobe and the mushroom body. (A) A schematic showing the recording configuration and the odor delivery setup. (B) A 16-channel NeuroNexus recording electrode used for PN recordings is shown. (C) Left panel, a custom made 8-channel twisted wire electrode is shown. Right panel, the electrode tip and the connections of wires to the IC socket are shown. (D) Placement of the 16-channel recording electrode in the AL. Only the bottom four electrodes in each shank are inserted into the tissue. (F) Placement of the twisted wire electrode in the superficial MB layers for KC recordings is shown.
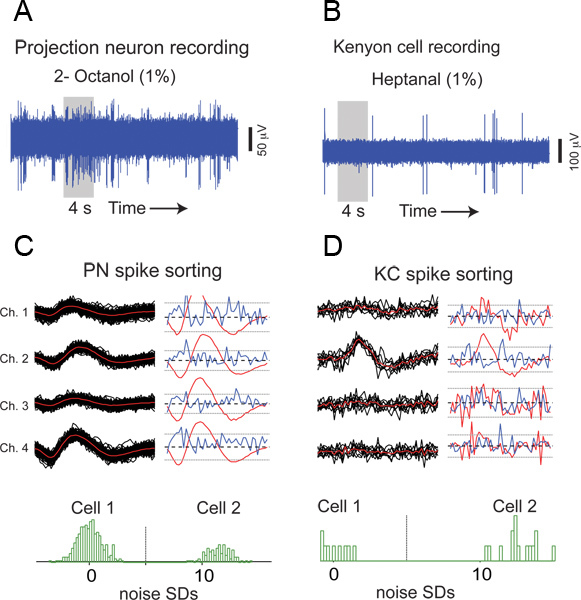 Figure 6. Representative results from an antennal lobe (AL) and a mushroom body (MB) recording. (A) A raw extracellular trace from a multi-unit AL recording is shown. A 4 s odor pulse was applied during the time period indicated by the gray box. (B) Similar plot but showing raw KC responses to an odor. (C) An example of PN spike sorting. Extracellular waveforms from four independent channels of a multi-channel electrode are shown for all spiking events arising from a single PN. Individual events (black), mean (red), and SDs (blue) are shown for both cells. Histograms obtained by projecting high-dimensional PN event representations (180 dimensional vector obtained by concatenating 3 ms signals from all four electrodes) onto the line connecting their means. To be considered a well-isolated unit, as in this case, a bimodal distribution with cluster centers at least five times the noise SD apart is expected for every pair of simultaneously recorded cells12. (D) An example of KC spike sorting is shown.
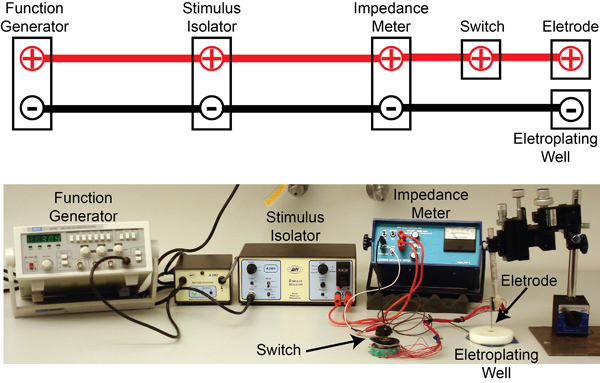 Figure 7. The electroplating set up: The circuit diagram showing connections between the different components are shown above a picture of the actual setup. Briefly, 3 Hz square pulses (5V amplitude) from a function generator (MCP, SG 1639A) are used to gate a stimulus isolator (WPI, A365) that then delivers 5 μA of current to an electrode impedance tester (BAK Electronics, IMP-2). The impedance tester can be operated to either test the electrode impedance or allow current pulses from the stimulus isolator to be applied to the electrode for gold plating. In both cases, the multi-unit electrode is kept immersed in an electroplating well containing gold solution. A switch allows selection of the electrode channel to be gold plated.
Discussion
Most sensory stimuli evoke combinatorial responses that are distributed across ensembles of neurons. Hence, simultaneous monitoring of multi-neuron activity is necessary to understand how stimulus-specific information is represented and processed by neural circuits in the brain. Here, we have demonstrated extracellular multi-unit recording techniques to characterize odor-evoked responses at the first three processing centers along the insect olfactory pathway. We note that the techniques presented here have been used in a number of previous studies on olfactory coding and are becoming a standard practice in this field3,6,13-17. Combining the techniques presented here one can develop a system's approach to investigating the design and computing principles of the invertebrate olfactory system. Here, we must recognize seminal contributions made by Gilles Laurent, Mark Stopfer, and their colleagues2,3,8,9,13,16,18-21, who pioneered these approaches to reveal and elucidate several fundamental principles of olfactory coding.
Finally, it is worth noting that optical techniques have also been successfully used to study ensemble activity in insect olfactory circuits22-27. While these optical techniques are advantageous when the goal is to simultaneously monitor neural activity across a large number of neurons, electrophysiology techniques are still the 'gold standard' when detection of individual action potentials is desired.
Disclosures
No conflicts of interest declared.
Acknowledgments
The authors would like to thank the following for funding this work: generous start-up funds from the Department of Biomedical Engineering in Washington University, a McDonnell Center for Systems Neuroscience grant, a Office of Naval Research grant (Grant#: N000141210089) to B.R.
References
- Ache BW, Young JM. Olfaction: diverse species, conserved principles. Neuron. 2005;48:417–430. doi: 10.1016/j.neuron.2005.10.022. [DOI] [PubMed] [Google Scholar]
- Laurent G, Wehr M, Davidowitz H. Temporal representations of odors in an olfactory network. Journal of Neuroscience. 1996;16:3837–3847. doi: 10.1523/JNEUROSCI.16-12-03837.1996. [DOI] [PMC free article] [PubMed] [Google Scholar]
- Stopfer M, Jayaraman V, Laurent G. Odor identity vs. intensity coding in an olfactory system. Neuron. 2003;39:991–1004. doi: 10.1016/j.neuron.2003.08.011. [DOI] [PubMed] [Google Scholar]
- Steven de Belle J, Heisenberg M. Associative odor learning in Drosophila abolished by chemical ablation of mushroom bodies. Science. 1994;263:692–695. doi: 10.1126/science.8303280. [DOI] [PubMed] [Google Scholar]
- Cassenaer S, Laurent G. Conditional modulation of spike-timing-dependent plasticity for olfactory learning. Nature. 2012;482:47–52. doi: 10.1038/nature10776. [DOI] [PubMed] [Google Scholar]
- Hallem EA, Carlson JR. Coding of odors by a receptor repertoire. Cell. 2006;125:143–160. doi: 10.1016/j.cell.2006.01.050. [DOI] [PubMed] [Google Scholar]
- Raman B, Joseph J, Tang J, Stopfer M. Temporally diverse firing patterns in olfactory receptor neurons underlie spatiotemporal neural codes for odors. Journal of Neuroscience. 2010;30:1994–2006. doi: 10.1523/JNEUROSCI.5639-09.2010. [DOI] [PMC free article] [PubMed] [Google Scholar]
- Perez-Orive J, et al. Oscillations and sparsening of odor representations in the mushroom body. Science. 2002;297:359–365. doi: 10.1126/science.1070502. [DOI] [PubMed] [Google Scholar]
- Naraghi M, Laurent G. Odorant-induced oscillations in the mushroom bodies of the locust. The Journal of Neuroscience. 1994;14:2993–3004. doi: 10.1523/JNEUROSCI.14-05-02993.1994. [DOI] [PMC free article] [PubMed] [Google Scholar]
- Ochieng SA, Hallberg E, Hansson BS. Fine structure and distribution of antennal sensilla of the desert locust, Schistocerca gregaria (Orthoptera: Acrididae) Cell and Tissue Research. 1998;291:525–536. doi: 10.1007/s004410051022. [DOI] [PubMed] [Google Scholar]
- Burrows M, Laurent G. Synaptic Potentials in the Central Terminals of Locust Proprioceptive Afferents Generated by Other Afferents from the Same Sense Organ. Journal of Neuroscience. 1993;13:808–819. doi: 10.1523/JNEUROSCI.13-02-00808.1993. [DOI] [PMC free article] [PubMed] [Google Scholar]
- Pouzat C, Mazor O, Laurent G. Using noise signature to optimize spike-sorting and to assess neuronal classification quality. Journal of Neuroscience Methods. 2002;122:43–57. doi: 10.1016/s0165-0270(02)00276-5. [DOI] [PubMed] [Google Scholar]
- Mazor O, Laurent G. Transient dynamics versus fixed points in odor representations by locust antennal lobe projection neurons. Neuron. 2005;48:661–673. doi: 10.1016/j.neuron.2005.09.032. [DOI] [PubMed] [Google Scholar]
- Christensen TA, Pawlowski VA, Lei H, Hildebrand JG. Multi-unit recordings reveal context dependent modulation of synchrony in odor-specific neural ensembles. Nature Neuroscience. 2000;3:927–931. doi: 10.1038/78840. [DOI] [PubMed] [Google Scholar]
- Pellegrino M, Nakagawa T, Vosshall LB. Single Sensillum Recordings in the Insects Drosophila melanogaster and Anopheles gambiae. J. Vis. Exp. 2010. p. e1725. [DOI] [PMC free article] [PubMed]
- Geffen MN, Broome BM, Laurent G, Meister M. Neural Encoding of Rapidly Fluctuating Odors. Neuron. 2009;61:570–586. doi: 10.1016/j.neuron.2009.01.021. [DOI] [PubMed] [Google Scholar]
- Ito I, Ong RC, Raman B, Stopfer M. Sparse odor representation and olfactory learning. Nature Neuroscience. 2008;11:1177–1184. doi: 10.1038/nn.2192. [DOI] [PMC free article] [PubMed] [Google Scholar]
- Laurent G. Olfactory network dynamics and the coding of multidimensional signals. Nature Review Neuroscience. 2002;3:884–895. doi: 10.1038/nrn964. [DOI] [PubMed] [Google Scholar]
- Brown SL, Joseph J, Stopfer M. Encoding a temporally structured stimulus with a temporally structured neural representation. Nature Neuroscience. 2005;8:1568–1576. doi: 10.1038/nn1559. [DOI] [PubMed] [Google Scholar]
- MacLeod K, Laurent G. Distinct mechanism for synchronization and temporal patterning of odor-encoding neural assemblies. Science. 1996;274:976–979. doi: 10.1126/science.274.5289.976. [DOI] [PubMed] [Google Scholar]
- Wehr M, Laurent G. Relationship between afferent and central temporal patterns in the locust olfactory system. The Journal of Neuroscience. 1999;19:381–390. doi: 10.1523/JNEUROSCI.19-01-00381.1999. [DOI] [PMC free article] [PubMed] [Google Scholar]
- Moreaux L, Laurent G. Estimating firing rates from calcium signals in locust projection neurons in vivo. Frontiers in Neural Circuits. 2007;1:1–13. doi: 10.3389/neuro.04.002.2007. [DOI] [PMC free article] [PubMed] [Google Scholar]
- Galizia CG, Joerges J, Kuttner A, Faber T, Menzel R. A semi-in-vivo preparation for optical recording of the insect brain. Journal of Neuroscience Methods. 1997;76:61–69. doi: 10.1016/s0165-0270(97)00080-0. [DOI] [PubMed] [Google Scholar]
- Galan RF, Sachse S, Galizia CG, Hez AVM. Odor-driven attractor dynamics in the antennal lobe allow for simple and rapid olfactory pattern classification. Neural Computation. 2004;16:999–1012. doi: 10.1162/089976604773135078. [DOI] [PubMed] [Google Scholar]
- Kuebler LS, Schubert M, Karpati Z, Hansson BS, Olsson SB. Antennal Lobe Processing Correlates to Moth Olfactory Behavior. Journal of Neuroscience. 2012;32:5772–5782. doi: 10.1523/JNEUROSCI.6225-11.2012. [DOI] [PMC free article] [PubMed] [Google Scholar]
- Silbering AF, Bell R, Galizia CG, Benton R. Calcium Imaging of Odor-evoked Responses in the Drosophila Antennal Lobe. J. Vis. Exp. 2012. p. e2976. [DOI] [PMC free article] [PubMed]
- Skiri HT, Galizia CG, Mustaparta H. Representation of Primary Plant Odorants in the Antennal Lobe of the Moth Heliothis virescens Using Calcium Imaging. Chemical Senses. 2004;29:253–267. doi: 10.1093/chemse/bjh026. [DOI] [PubMed] [Google Scholar]


