Abstract
The protein kinase C (PKC) family of isozymes is involved in numerous physiological and pathological processes. Our recent data demonstrate that PKC regulates mitochondrial function and cellular energy status. Numerous reports demonstrated that the activation of PKC-a and PKC-ε improves mitochondrial function in the ischemic heart and mediates cardioprotection. In contrast, we have demonstrated that PKC-α and PKC-ε are involved in nephrotoxicant-induced mitochondrial dysfunction and cell death in kidney cells. Therefore, the goal of this study was to develop an in vitro model of renal cells maintaining active mitochondrial functions in which PKC isozymes could be selectively activated or inhibited to determine their role in regulation of oxidative phosphorylation and cell survival. Primary cultures of renal proximal tubular cells (RPTC) were cultured in improved conditions resulting in mitochondrial respiration and activity of mitochondrial enzymes similar to those in RPTC in vivo. Because traditional transfection techniques (Lipofectamine, electroporation) are inefficient in primary cultures and have adverse effects on mitochondrial function, PKC-ε mutant cDNAs were delivered to RPTC through adenoviral vectors. This approach results in transfection of over 90% cultured RPTC.
Here, we present methods for assessing the role of PKC-ε in: 1. regulation of mitochondrial morphology and functions associated with ATP synthesis, and 2. survival of RPTC in primary culture. PKC-ε is activated by overexpressing the constitutively active PKC-ε mutant. PKC-ε is inhibited by overexpressing the inactive mutant of PKC-ε. Mitochondrial function is assessed by examining respiration, integrity of the respiratory chain, activities of respiratory complexes and F0F1-ATPase, ATP production rate, and ATP content. Respiration is assessed in digitonin-permeabilized RPTC as state 3 (maximum respiration in the presence of excess substrates and ADP) and uncoupled respirations. Integrity of the respiratory chain is assessed by measuring activities of all four complexes of the respiratory chain in isolated mitochondria. Capacity of oxidative phosphorylation is evaluated by measuring the mitochondrial membrane potential, ATP production rate, and activity of F0F1-ATPase. Energy status of RPTC is assessed by determining the intracellular ATP content. Mitochondrial morphology in live cells is visualized using MitoTracker Red 580, a fluorescent dye that specifically accumulates in mitochondria, and live monolayers are examined under a fluorescent microscope. RPTC viability is assessed using annexin V/propidium iodide staining followed by flow cytometry to determine apoptosis and oncosis.
These methods allow for a selective activation/inhibition of individual PKC isozymes to assess their role in cellular functions in a variety of physiological and pathological conditions that can be reproduced in in vitro.
Keywords: Cellular Biology, Issue 71, Biochemistry, Molecular Biology, Genetics, Pharmacology, Physiology, Medicine, Protein, Mitochondrial dysfunction, mitochondria, protein kinase C, renal proximal tubular cells, reactive oxygen species, oxygen consumption, electron transport chain, respiratory complexes, ATP, adenovirus, primary culture, ischemia, cells, flow cytometry
Protocol
1. Isolation of Renal Proximal Tubules for Primary Culture
Anesthetize the rabbit, excise both kidneys and place them in a Petri dish filled with sterile prep buffer (DMEM/F12 medium) in a laminar flow hood.
Perfuse each kidney with 50 ml of prep buffer followed by 50 ml of sterile phosphate-buffered saline, pH 7.4 (PBS), and PBS-iron oxide solution (45 ml + 5 ml). De-capsulate kidneys and transfer them to the prep buffer containing deferoxamine.
Harvest the cortex of each kidney.
Homogenize the tissue using a 15 ml Dounce homogenizer. Pour the homogenate over 2 sterile mesh sieves (85 μm on the bottom and 235 μm on top) placed over a 1 L sterile beaker. Rinse the sieves with deferoxamine-containing buffer.
Collect any tissue left on the 85 μm sieve in a sterile conical centrifuge tube filled with 35-40 ml of the deferoxamine-containing buffer. Gently mix the cell suspension.
Place a strong magnet outside of the tube to remove iron filled glomeruli and let the suspension settle. Aspirate iron from the magnet using a Pasteur pipette. Repeat this process.
Prepare 1 ml of digestion medium containing 2,400-2,500 units of collagenase I and 0.6 mg soybean trypsin inhibitor dissolved in the deferoxamine-containing buffer. Filter-sterilize the digestion medium.
Adjust the volume of the cell suspension to 40 ml, and add 1 ml of digestion medium. Incubate at room temperature for 17 min gently mixing the suspension, centrifuge at 50 x g for 2 min at 4 °C, aspirate the medium, and add fresh deferoxamine buffer.
Repeat the iron-removing procedure with the magnet several times, spin the suspension down again, aspirate medium, and add 46 ml of medium containing no glucose.
Mix gently and measure out 500 μl of the suspension into two pre-weighed Eppendorf tubes. Spin cells down at 10,000 x g for 1 min, aspirate the media, and weigh the pellet. Calculate the total yield of wet mass and protein.
Plate the cells in sterile 35 mm culture dishes at the density of 1 mg protein/dish using glucose-free DMEM/F12 medium. Culture cells in 2 ml glucose-free DMEM/F12 medium always on an orbital shaker in the incubator at 37 °C (95% air/5% CO2).1,2
2. Renal Proximal Tubule Cell Culture
The culture medium is a 50:50 mixture of DMEM and Ham's F-12 nutrient mix without phenol red, pyruvate, and glucose, supplemented with 15 mM NaHCO3, 15 mM HEPES, and 6 mM lactate (pH 7.4, 295 mosmol/kgH2O). The media are supplemented with L-ascorbic acid-2-phosphate (50 μM), bovine insulin (10 nM), human transferrin (5 mg/ml), hydrocortisone (50 nM), and selenium (5 ng/ml) immediately before daily media change.
Aspirate old media from dishes using a sterile technique. Add 2 ml of warm, fresh media to each dish using a sterile technique. Renal proximal tubular cells (RPTC) reach confluence in approximately 5-6 days after plating.1,2
3. Adenoviral Infection of RPTC
Adenoviral infection is carried out in confluent, quiescent cultures of RPTC after the daily media change. Dominant negative PKC-ε mutant (dnPKC-ε) was constructed by the replacement of: 1) lysine with arginine at position 436 of the ATP-binding site and 2) alanine with glutamate at position 159 of the pseudosubstrate domain. These mutations destroyed the construct's kinase activity without changing the active conformation of PKC-ε.3 PKC-ε was made constitutively active by deletion of residues 154-163 of its inhibitory pseudosubstrate domain.4
Add stock solution of the adenovirus carrying caPKC-ε cDNA or dnPKC-ε cDNA to each dish to obtain desired multiplicity of infection (MOI) resulting in significant increase in PKC-ε protein levels. Incubate RPTC with adenovirus for 24 hr. Change media and culture cells for another 24 hr. Significantly increased levels of phosphorylated and total PKC-ε proteins can be obtained using 25-50 MOI of adenoviral vector coding caPKC-ε. Greater MOI results in even larger increases in the levels of active PKC-ε, but it is not recommended in RPTC due to the rapid cell death and loss. Significantly increased levels of the inactive PKC-ε protein can be obtained using 50-100 MOI in RPTC without producing adverse effects.5
At 48 hr after infection, aspirate media, wash the monolayers with PBS, and collect cells for immunoblot analysis to determine protein levels of PKC-ε.5
4. Measurement of RPTC Respiration
Prepare an assay buffer for measuring state 3 respiration (120 mM KCl, 5 mM KH2PO4, 10 mM HEPES, 1 mM MgSO4, and 2 mM EGTA, pH 7.4). For measuring complex I-coupled state 3 respiration, supplement the assay buffer with 5 mM glutamate, 5 mM malate and 0.1 mg/ml digitonin. For complex II-coupled state 3 respiration, supplement the assay buffer with 10 mM succinate, 0.1 μM rotenone, and 0.1 mg/ml digitonin. For complex IV-coupled state 3 respiration, supplement the assay buffer with 1 mM ascorbate, 1 mM N,N,N',N'-tetramethyl-p-phenylenediamine (TMPD), and 0.1 mg/ml digitonin. Place the solutions in a 37 °C water bath.
Aspirate media from a culture dish containing RPTC monolayer, add 2 ml of a warm state 3 respiration buffer, gently scrape cells from the dish using a rubber policeman, and transfer the suspension to the oxygen consumption chamber equipped with a Clark-type electrode.
Measure state 2 respiration (in the absence of ADP). Initiate state 3 respiration by adding ADP to a final concentration of 0.4 mM. Initiate state 4 respiration by adding oligomycin to a final concentration of 0.5 μg/ml. Uncoupled respiration is measured by adding 0.5 μM FCCP to cells respiring at state 3.6,7
Collect the cell suspension from the chamber, precipitate protein using perchloric acid, and spin down the precipitate. Determine protein concentration in the cellular pellet.
5. Analysis of Mitochondrial Membrane Potential (ΔΨm)
Prepare 0.5 mM JC-1 solution in the sterile culture medium.
Add slowly 20 μl of JC-1 solution to each dish to obtain final concentration of 5 μM. Swirl the dish to mix the dye thoroughly. Return the dishes to the incubator for 30 min.
Put dishes on ice, aspirate media, and wash monolayers twice with ice-cold PBS. Aspirate PBS, add 1 ml of fresh PBS, scrape cells from the dish and transfer them to an Eppendorf tube. Break up monolayers into single cells by pipetting them up and down.
Spin the suspension down at 1,000 x g for 2 min, aspirate the supernatant, add 1 ml of PBS to the pellet and re-suspend it to obtain a single cell suspension. Repeat this step again if necessary.
Spin cells down at 1,000 x g for 2 min, aspirate the supernatant, add 0.5 ml of PBS, and re-suspend the pellet. Analyze fluorescence by flow cytometry using excitation by a 488-nm argon-ion laser. Read the emission in two separate channels, FL1 at 525 nm and FL2 at 590 nm. Mitochondrial membrane potential is expressed as FL2/FL1 fluorescence ratio.6
6. Isolation of Mitochondria
Prepare isolation buffers: Buffer A (10 mM HEPES, 225 mM mannitol, 75 mM sucrose, 0.1 mM EGTA, pH 7.4), Buffer B (buffer A containing protease inhibitors, 1 mM Na3VO4, 1 mM NaF), and Buffer C (10 mM HEPES, 395 mM sucrose, 0.1 mM EGTA, pH 7.4). Perform all steps on ice.
Wash RPTC monolayers twice with ice-cold PBS buffer. Scrape monolayers into Eppendorf tubes and spin them at 500 x g for 5 min. Wash the pellet in 1 ml of Buffer A.
Re-suspend the pellet in 1 ml of Buffer B, and transfer the suspension to a 2 ml Dounce homogenizer.
Homogenize cells in the Dounce homogenizer until most of the cells in the homogenate are broken when inspected under a microscope.
Centrifuge the homogenate at 1,000 x g for 5 min at 4 °C. Collect the supernatant and spin it down at 15,000 x g for 10 min at 4 °C.
Discard the supernatant and re-suspend the pellet containing crude mitochondria in 1 ml of Buffer C. Spin the supernatants down at 15,000 x g for 10 min at 4 °C. Repeat the washing of the pellet two more times.5
To measure activities of respiratory complexes, re-suspend mitochondrial pellet in 50-100 μl of the assay buffer and freeze in liquid nitrogen. Thaw samples slowly on ice.
7. Measurement of Activity of NADH-ubiquinone Oxidoreductase (Complex I)
Prepare the assay buffer: 10 mM KH2PO4, 5 mM MgCl2, pH 7.2. Add fatty acid-free BSA and NADH to obtain final concentrations of 0.25% and 0.25 mM, respectively. Add 2 μl of antimycin A solution (1 mg/ml) to a final concentration of 2 μg/ml.
Run the samples in a 48-well transparent plate. Include a blank sample that has all additions but no mitochondria. To each well, add 500 μl of the assay buffer with additions and mitochondria, and incubate the plate at 30 °C with mixing for 5 min.
Start the reaction by adding 10 μl of 3.25 mM ubiquinone to each well. Record the absorbance (340 nm) for 3 min in 20 sec intervals. Add 5 μl of rotenone solution (1 mg/ml) to each well and record the absorbance for additional 2 min. Calculate complex I activity as the rotenone-sensitive NADH oxidation.7
8. Measurement of Activity of Succinate-ubiquinone Oxidoreductase (Complex II)
Prepare the assay buffer containing 0.25% fatty acid-free BSA, 20 mM potassium succinate, 0.25 mM 2,6-dichloroindophenol, 2 μg/ml antimycin A, and 10 μg/ml rotenone.
Run the samples in duplicates in a 48-well transparent plate including a blank sample that has all additions but no mitochondria. To each well, add 500 μl of the assay buffer with additions and mitochondria, and incubate the plate at 30 °C with mixing for 2 min.
Start the reaction by adding 10 μl of 3.25 mM ubiquinone to each well. Record the absorbance (595 nm) for 3 min in 20 sec intervals. Calculate Complex II activity by following the reduction of 2,6-dichloroindophenol. 7
9. Measurement of Activity of Ubiquinol-cytochrome c Oxidoreductase (Complex III)
Prepare the assay buffer containing 0.1% fatty acid-free BSA, 80 mM potassium succinate, 10 μg/ml rotenone, and 0.24 mM potassium cyanide.
Run the samples in duplicates in a 48-well transparent plate including a blank sample that has all additions but no mitochondria. To each well, add 291 μl of the assay buffer with additions and mitochondria, and incubate the plate at 30 °C with mixing for 5 min.
Start the reaction by adding 3 μl of 6 mM oxidized cytochrome c to each well. Record the absorbance (550 nm) for 3 min in 20 sec intervals. Add 5 μl of antimycin A solution (1 mg/ml) to each well and record the absorbance for additional 2 min. Calculate complex III activity as the antimycin A-sensitive cytochrome c reduction.7
10. Measurement of Activity of Cytochrome Oxidase (Complex IV)
Prepare reduced cytochrome c by adding sodium ascorbate to 9 mM solution of cytochrome c and dialyzing the solution overnight at 4 °C in 1 L of phosphate buffer (10 mM KH2PO4, pH 7.2) containing 5 mM MgCl2. Prepare the assay buffer containing 0.1% fatty acid-free BSA and antimycin A (2 μg/ml).
Run the samples in a 48-well transparent plate including a blank sample that has all additions but no mitochondria. To each well, add 233 μl of the assay buffer with additions and mitochondria, and incubate the plate at 30 °C with mixing for 5 min.
Start the reaction by addition of reduced cytochrome c (90 μM final concentration). Record the absorbance (550 nm) for 3 min in 20 sec intervals. Add 2 μl of KCN solution (8 μg/ml) to each well and record the absorbance for another 2 min. Calculate complex IV activity as the KCN-sensitive cytochrome c oxidation.7
11. Measurement of Activity of F0F1-ATPase (ATP synthase)
Prepare F0F1-ATPase assay buffer (10 mM Tris-HCl, 200 mM KCl, 2 mM MgCl2 , pH 8.2). Re-suspend mitochondrial pellet in the assay buffer, freeze mitochondrial samples in liquid nitrogen and thaw the samples slowly on ice.
Run the samples in triplicates in a 48-well transparent plate. For each treatment group, 2 wells will be run to measure total ATPase activity (275 μl of the assay buffer, 5 μl mitochondrial suspension, and 5 μl of 95% ethanol) and 1 well to measure oligomycin-insensitive ATPase activity (275 μl of the assay buffer, 5 μl mitochondrial suspension, and 5 μl of 1 mg/ml oligomycin solution in 95% ethanol).
Incubate samples at 31 °C for 10 min with constant shaking. Add 16 μl of 100 mM ATP solution (pH 7.0) and incubate at 31 °C for 5 min with constant shaking.
Transfer 200 μl of the incubation mixture to a tube containing 50 μl of 3 M TCA. Incubate samples on ice for 10 min and spin them down at 10,000 x g for 5 min at 4 °C. Use supernatants and pellets to determine phosphate and protein content, respectively.
Determine phosphate content in the supernatants using the inorganic phosphate assay. Prepare 100 ml of Sumner Reagent by adding 0.88 g FeSO4 to 10 ml of 3.75 M H2SO4 and adjusting to 90 ml with H2O. Add 10 ml of ammonium molybdate solution (0.66 g/10 ml H2O) to the solution of FeSO4 in H2SO4. Protect from light.
Load 96-well plate with 50 μl of each phosphate standard (0 - 1,000 μM KH2PO4) and 50 μl of each supernatant in duplicates. Add 250 μl of the Sumner Reagent to each well and incubate the plate at 30 °C for 15 min with constant shaking.
Record the absorbance at 595 nm at room temperature. F0F1-ATPase activity is determined by measuring the oligomycin-sensitive release of Pi from ATP as we described previously.7,8Calculate total and oligomycin-insensitive F0F1-ATPase activities. To calculate the oligomycin-sensitive ATPase activity, subtract oligomycin-insensitive activity from the total ATPase activity. 8,9
12. Measurement of Intracellular ATP Content
Place culture dishes containing RPTC monolayers on ice, aspirate medium, and wash the monolayers twice with ice cold PBS buffer. Add 1 ml PBS to each monolayer, scrape each monolayer into PBS, and collect the cell suspension in an Eppendorf tube. Spin the Eppendorf tubes in the microfuge for 5 sec.
Determine ATP content in each RPTC sample by the luciferase method using the ATP Bioluminescence Assay Kit HS II (Roche) and the manufacturer's protocol. Determine protein concentration in each sample and calculate ATP concentration per mg protein.8
13. Visualization of Mitochondrial Morphology
Change culture media. Add 2 μl of 100 μM solution of MitoTracker Red 580 to each dish (final conc. 100 nM) and return the dishes to the incubator for 30 min.
Examine the live monolayers under a fluorescent microscope using a water immersion objective.5
14. Analysis of Cell Viability
At 24 hr before starting the assay prepare 50 mM solution of cisplatin to treat cells that will serve as positive control for apoptosis (annexin V-positive cells). Also, prepare 500 mM solution of tert-butylhydroperoxide to treat cells that will serve as positive controls for oncosis (propidium iodide-positive cells).
Treat 2 dishes with 2 μl of 50 mM cisplatin and 2 dishes with 2 μl of 500 mM tert-butylhydroperoxide. Dedicate 1 dish for a no-stain control.
At 24 hr after treatment with cisplatin and TBHP, prepare the binding buffer (10 mM Hepes, 140 mM NaCl, 5 mM KCl, 1 mM MgCl2, 1.8 mM CaCl2) and propidium iodide (PI) solution (50 μg/ml) in the binding buffer.
Wash monolayers once with the binding buffer. Add 1 ml of the ice-cold buffer and 50 μl of PI solution to each dish except for the no-stain and annexin V-positive cells. Cover dishes and incubate on ice for 15 min with gentle orbital shaking.
Wash monolayers with the binding buffer (10 min) and add 1 ml of the binding buffer and 2 μl of Annexin V-FITC solution to each dish except for no-stain and PI-positive cells. Cover dishes and incubate at RT for 10 min with gentle orbital shaking.
Aspirate the buffer and wash the monolayers with 1 ml of the ice-cold binding buffer on ice for 10 min with gentle orbital shaking. Repeat the washing step.
Aspirate the binding buffer and add 500 μl of binding buffer to each dish. Gently scrape the cells using a rubber policeman and transfer the cells to flow cytometry tubes. Disperse the cells into a single cell suspension by pipetting samples up and down. Break up any cell clusters.
Quantify PI and annexin V-FITC fluorescence immediately by flow cytometry using excitation at 488 nm and emission at 590 and 530 nm for PI and FITC, respectively. Count 10,000 events for each sample.
Put the FITC fluorescence on the X-axis and the PI fluorescence on the Y-axis of the flow cytometry dot plot figures. Cells positive for Annexin V and negative for PI are considered apoptotic. Cells positive for PI and negative for Annexin V are considered oncotic.10,11
Representative Results
Figure 1 shows that adenoviral delivery of cDNA coding the constitutively active (caPKC-ε) and inactive (dnPKC-ε) mutants of PKC-ε results in significantly increased protein levels of PKC-ε in RPTC and in mitochondria. Cells infected with cDNA carrying the caPKC-ε vector overexpressed the phosphorylated (active) form of PKC-ε whereas cells infected with cDNA coding dnPKC-ε overexpressed PKC-ε that was inactive (not phosphorylated) (Figure 1). The presence of active PKC-ε decreased mitochondrial respiration in RPTC regardless of the substrate used to energize mitochondria whereas the inactive PKC-ε had no effect (Figure 2). In order to determine the targets of the active PKC-ε within the respiratory chain, we determined the activities of all enzymatic complexes of the respiratory chain. As shown in Figure 3, activation of PKC-ε reduced activity of complex I and complex IV in RPTC but had no effect on the activities of complex II and complex III (data not shown). The decrease in RPTC respiration induced by PKC-ε activation was associated with increases in the mitochondrial membrane potential (mitochondrial hyperpolarization) (Figure 4). These changes were accompanied by decreases in the activity of F0F1-ATPase (ATP synthase) in mitochondria isolated from RPTC overexpressing the active PKC-ε (Figure 5A). As a result, the ATP content of RPTC overexpressing the active PKC-ε decreased (Figure 5B). Sustained activation of PKC-ε had profound effects on mitochondrial morphology by inducing mitochondrial fragmentation (fission) (Figure 6B). PKC-ε activation, but not inhibition, also resulted in changes in RPTC morphology causing cell shrinkage and elongation of surviving cells. Mitochondrial dysfunction and alterations in mitochondrial morphology in RPTC overexpressing the active PKC-ε were accompanied by cell death by both oncosis and apoptosis (Figure 7). At 48 hr after the adenoviral vector delivery, approximately 50% of RPTC overexpressing the active PKC-ε were not viable. Overexpression of the inactive form of PKC-ε had no effect on mitochondrial function and morphology, and on RPTC viability.
Thus, adenoviral delivery of cDNA coding different isozymes of PKC is an effective tool enabling selective overexpression of individual PKC isozymes and their active or inactive mutants in primary cultures of renal cells. It allows for efficient transfection of cells grown in primary culture and for studying the regulation of different cellular functions and for the assessment of cell morphology and viability by protein kinases.
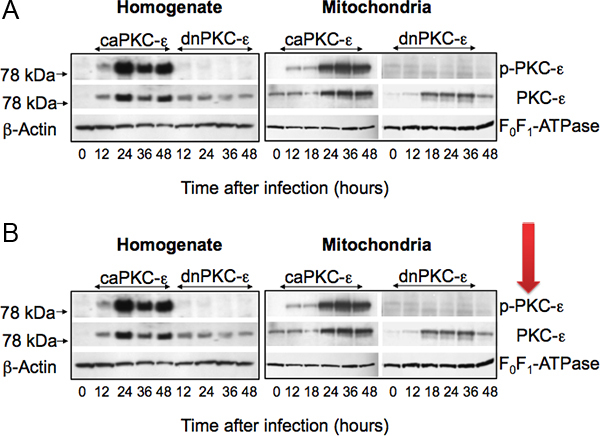 Figure 1. Protein levels of phosphorylated (active) PKC-ε (p-PKC-ε) and total PKC-ε in cell homogenates (left panel) and mitochondria (right panel) isolated from primary cultures of RPTC infected with adenoviral vector carrying the constitutively active (caPKC-ε) or inactive mutants (dnPKC-ε) of PKC-ε at different time points after adenoviral vector delivery. The levels of β-actin and F0F1-ATPase are used as gel loading controls for cell homogenates and mitochondria, respectively. Figure modified from Nowak et al.5
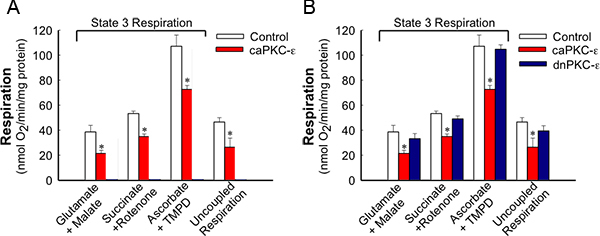 Figure 2. State 3 and uncoupled respirations in RPTC expressing the active and inactive mutants of PKC-ε at 48 h after adenoviral delivery. For state 3 respiration, mitochondria in digitonin-permeabilized cells were energized using 5 mM glutamate + 5 mM malate (substrates oxidized through complex I), 10 mM succinate + 0.1 μM rotenone (substrate oxidized through complex II), or 1 mM ascorbate + 1 mM N,N,N',N'-tetramethyl-p-phenylenediamine (TMPD) (substrates oxidized through complex IV). The results are average ± SE. * - P<0.05.
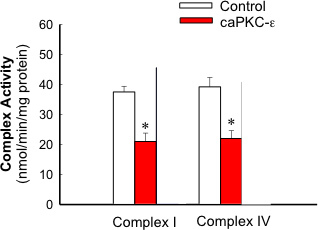 Figure 3. Activities of complex I and complex IV in mitochondria isolated from RPTC expressing the active and inactive mutants of PKC-ε at 48 h after adenoviral vector delivery. The results are average ± SE. * - P<0.05.
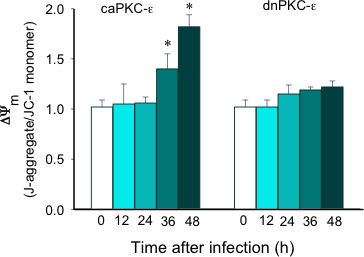 Figure 4. Time-dependent changes in mitochondrial membrane potential (ΔΨm) in RPTC following infection with adenoviral vector carrying the constitutively active (caPKC-ε) and inactive mutants (dnPKC-ε) of PKC-ε. The results are expressed as the ratio of aggregate to monomeric forms of JC-1. The results are average ± SE. * - P<0.05.
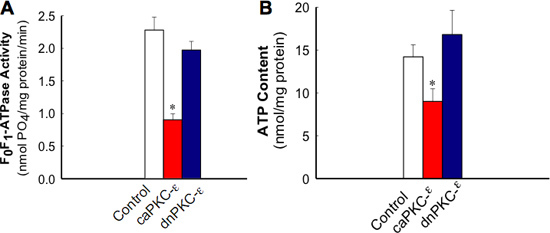 Figure 5. Activity of F0F1-ATPase in isolated mitochondria (A) and ATP content (B) in RPTC expressing the active and inactive mutants of PKC-ε at 48 h after adenoviral vector delivery. The results are average ± SE. * - P<0.05.
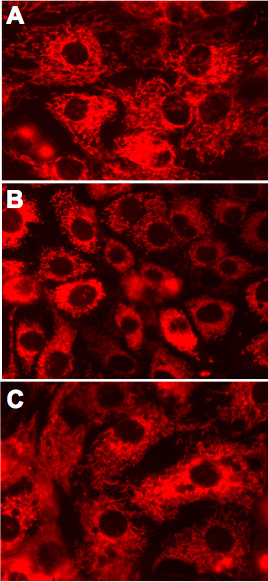 Figure 6. Mitochondrial morphology in live RPTC expressing the active and inactive mutants of PKC-ε at 48 h after adenoviral vector delivery. A. Non-infected controls. B. RPTC expressing caPKC-ε. C. RPTC expressing dnPKC-ε. Representative images of live cells examined under a fluorescent microscope. Original magnification, x630.
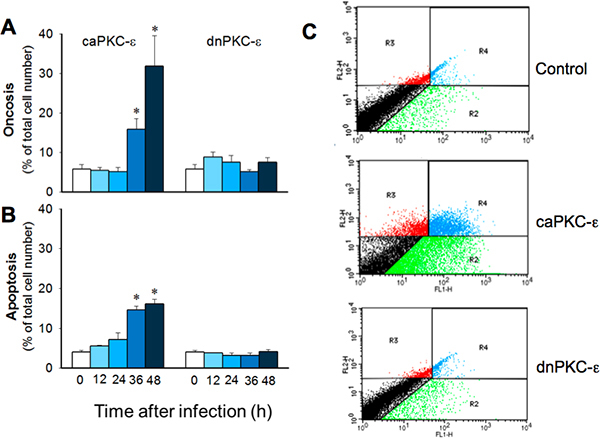 Figure 7. Time-dependent changes in RPTC oncosis (A) and apoptosis (B) following infection with adenoviral vector carrying the constitutively active (caPKC-ε) or inactive mutants (dnPKC-ε) of PKC-ε. Infection with adenoviral particles encoding an empty pShuttle vector (MOI = 50) resulted in 5.2 ± 2.3% oncosis and 5.5 ± 1.0% apoptosis at 48 h after infection. The results are average ± SE. * - P<0.05. C. Representative dot plots demonstrating annexin V and propidium iodide fluorescence in RPTC overexpressing caPKC-ε and dnPKC-ε at 48 h after adenoviral vector delivery.
Discussion
The approach presented here allows for overexpression of individual isozymes of PKC in the primary culture of renal proximal tubular cells. There are several strengths of this approach: 1. It allows for investigating regulatory mechanisms in a homogenous population of cells (renal proximal tubular cells) that are the primary target for various insults (ischemia, hypoxia, oxidative stress), drugs, and nephrotoxicants within the kidney. 2. Mitochondrial functions in this in vitro model of RPTC grown in primary culture in the improved conditions resemble mitochondrial functions of renal proximal tubules in vivo.1,2 3. Response of mitochondria to different toxicants in this in vitro model is similar to the response of renal proximal tubules in vivo. 4. This approach allows for an efficient transfection and delivery of genes coding specific proteins including proteins involved in signal transduction mechanisms that regulate mitochondrial functions. Thus, this model allows for selective expression of constitutively active and inactive isozymes of kinases and phosphatases and replaces the need for pharmacological inhibitors and activators that are not as selective and often have toxic side effects. The limitations of this model are the following: 1. using cultured RPTC in an in vitro environment does not allow for studying endocrine and paracrine signals that contribute to the regulation of mitochondrial function in renal proximal tubules in vivo, and 2. this model does not allow for studying chronic conditions.
Disclosures
No conflicts of interest declared.
Acknowledgments
This work was supported by a grant from the National Institutes of Health, National Institute of Diabetes and Digestive and Kidney Diseases, 2R01DK59558 (to G.N.). UAMS Translational Research Institute supported by the National Institutes of Health National Center for Research Resources grant UL1 RR029884 provided partial funding for Flow Cytometry Core at UAMS. We thank Dr. Peipei Ping (University of California at Los Angeles; Los Angeles, CA) for providing an aliquot of adenovirus carrying cDNA coding the dominant negative (inactive) mutant of PKC-ε and Dr. Allen Samarel (Loyola University Medical Center; Maywood, IL) for providing an aliquot of adenoviral vector coding the constitutively active mutant of PKC-ε. We also thank Drs. Peter Parker and Peter Sugden (Imperial College London, London, UK) for providing cDNA coding constitutively active PKC-ε.
References
- Nowak G, Schnellmann RG. Improved culture conditions stimulate gluconeogenesis in primary cultures of renal proximal tubule cells. Am. J. Physiol. 1995;268:C1053–C1061. doi: 10.1152/ajpcell.1995.268.4.C1053. [DOI] [PubMed] [Google Scholar]
- Nowak G, Schnellmann RG. L-ascorbic acid regulates growth and metabolism of renal cells: improvements in cell culture. Am. J. Physiol. 1996;271:2072–2080. doi: 10.1152/ajpcell.1996.271.6.C2072. [DOI] [PubMed] [Google Scholar]
- Ping P, Takano H, Zhang J, Tang XL, Qiu Y, Li RC, Banerjee S, Dawn B, Balafonova Z, Bolli R. Isoform-selective activation of protein kinase C by nitric oxide in the heart of conscious rabbits: a signaling mechanism for both nitric oxide-induced and ischemia-induced preconditioning. Circ. Res. 1999;84:587–604. doi: 10.1161/01.res.84.5.587. [DOI] [PubMed] [Google Scholar]
- Wotton D, Ways DK, Parker PJ, Owen MJ. Activity of both Raf and Ras is necessary for activation of transcription of the human T cell receptor beta gene by protein kinase C, Ras plays multiple roles. J. Biol. Chem. 1993;268:17975–17982. [PubMed] [Google Scholar]
- Nowak G, Bakajsova D, Samarel AM. Protein kinase C-ε activation induces mitochondrial dysfunction and fragmentation in renal proximal tubules. Am. J. Physiol. Renal Physiol. 2011;301:F197–F208. doi: 10.1152/ajprenal.00364.2010. [DOI] [PMC free article] [PubMed] [Google Scholar]
- Nowak G, Clifton GL, Godwin ML, Bakajsova D. Activation of ERK1/2 pathway mediates oxidant-induced decreases in mitochondrial function in renal cells. Am. J. Physiol. Renal Physiol. 2006;291:840–855. doi: 10.1152/ajprenal.00219.2005. [DOI] [PMC free article] [PubMed] [Google Scholar]
- Shaik ZP, Fifer EK, Nowak G. Akt activation improves oxidative phosphorylation in renal proximal tubular cells following nephrotoxicant injury. Am. J. Physiol. Renal Physiol. 2008;294:F423–F432. doi: 10.1152/ajprenal.00463.2007. [DOI] [PMC free article] [PubMed] [Google Scholar]
- Nowak G. Protein kinase C-α and ERK1/2 mediate mitochondrial dysfunction, decreases in active Na+ transport, and cisplatin-induced apoptosis in renal cells. J. Biol. Chem. 2002;277:43377–43388. doi: 10.1074/jbc.M206373200. [DOI] [PMC free article] [PubMed] [Google Scholar]
- Liu X, Godwin ML, Nowak G. Protein kinase C- a inhibits the repair of oxidative phosphorylation after S-(1,2-dichlorovinyl)-L-cysteine injury in renal cells. Am. J. Physiol. Renal Physiol. 2004;287:F64–F73. doi: 10.1152/ajprenal.00216.2003. [DOI] [PubMed] [Google Scholar]
- Nowak G, Price PM, Schnellmann RG. Lack of a functional p21WAF1/CIP1 gene accelerates caspase-independent apoptosis induced by cisplatin in renal cells. Am. J. Physiol. Renal Physiol. 2003;285:F440–F450. doi: 10.1152/ajprenal.00233.2002. [DOI] [PubMed] [Google Scholar]
- Cummings BS, Schnellmann RG. Cisplatin-induced renal cell apoptosis: caspase 3-dependent and -independent pathways. J. Pharmacol. Exp. Ther. 2002;302:8–17. doi: 10.1124/jpet.302.1.8. [DOI] [PubMed] [Google Scholar]


