

Abstract
Mounting an adaptive immune response is bioenergetically demanding. As a result, T cell activation coincides with profound changes in cellular metabolism that must be coordinated with instructive signals from cytokine and costimulatory receptors to generate an immune response. Studies examining the intimate link between metabolism and immune function have revealed that different types of T cells have distinct metabolic profiles. Data is emerging that place mTOR, an evolutionarily conserved serine-threonine kinase, as a central integrator of these processes. In this review, we will discuss the role of mTOR in determining both CD4 and CD8 T cell metabolism, differentiation, and trafficking.
Keywords: mTOR, metabolism, CD4, CD8 T cells
1. Background
The ability of the immune system to rapidly respond to pathogens poses a unique bioenergetic challenge. Following antigen recognition and costimulation, activated T cells proliferate rapidly, such that the number of cells from a single clone can increase exponentially every 4–6 hours[1]. This abrupt switch from a naïve or resting state is accompanied by profound changes in cellular metabolism similar to that seen in rapidly dividing tumor cells [2, 3]. Interestingly, both cancer cells and activated T cells utilize aerobic glycolysis to meet their energy demands—a phenomenon known as the Warburg effect[4]. That is, even in the presence of oxygen, cancer cells and T cells employ glycolysis as a means of generating ATP. It has been proposed that by doing so, cells are able to more easily generate the cellular building blocks necessary for rapid proliferation[5]. This reliance on glycolysis necessitates glucose as a source of fuel; therefore, limiting the availability of glucose induces rapid cell death, even if alternative fuels such as fatty acids or amino acids are available[6]. The observation that cancer cells and activated T cells employ the same strategies to meet demanding metabolic needs is no coincidence, however. Indeed, the same signaling pathways that promote aerobic glycolysis are upregulated in both cell types. By contrast, naïve and memory T cells, which have enhanced longevity compared to activated T cells, utilize fatty acid oxidation as their primary source of fuel[7, 8]. Thus, it is becoming appreciated that the metabolic needs of naïve, activated, and memory T cells are quite distinct.
A model has emerged whereby metabolism is intimately linked to function in T cells.[2] As such, signals that induce T cell activation also promote upregulation of the metabolic machinery necessary to support activation. Indeed, costimulation in the form of CD28 receptor engagement promotes full T cell activation in part by upregulating the glucose transporter Glut1 and a number of enzymes in the glycolytic pathway. [9, 10] Likewise, instructional signals from the immune microenvironment which guide T cell differentiation also promote selective metabolic pathways. In this review, we will highlight the distinct metabolic demands of different T cell subsets and the central role of mTOR in coordinating T cell function with metabolism.
2. Introduction to mTOR
mTOR is an evolutionarily conserved serine-threonine protein kinase that plays a role in regulating cell growth, metabolism and survival[11]. Yeast express two TOR genes which play critical roles in sensing the availability of nutrients in the environment in order to promote growth only under favorable environmental conditions[12]. Interestingly, in higher organisms TOR exists as one gene product which can signal via two distinct complexes, TORC1 and TORC2[13]. In mammalian cells, TORC1 is responsible for regulating cell growth, metabolism, and cap-dependent protein translation, while TORC2 regulates cellular functions such as actin reorganization and survival[14]. In some mammalian cell lineages such as lymphocytes of the immune system, the nutrient-sensing TOR pathway has been co-opted to perform highly specialized functions, such as the integration of multiple signals in the immune microenvironment to direct cellular differentiation. Various inputs in the form of nutrients, costimulation, and cytokines feed into the mTOR pathway (Figure 1). In turn, mTOR selectively activates downstream signaling pathways that control glycolysis, glutaminolysis, fatty acid oxidation, and mitochondrial biogenesis[15]. These metabolic pathways are inextricably linked to T cell differentiation because it appears that different types of T cells may utilize distinct metabolic programs to perform their functions (Figure 2). In a coordinated fashion, these cell extrinsic differentiation cues are integrated by mTOR, which in turn activates diverse downstream pathways to determine cell fate.
Figure 1. Metabolic inputs and outputs of the mTOR signaling pathway.
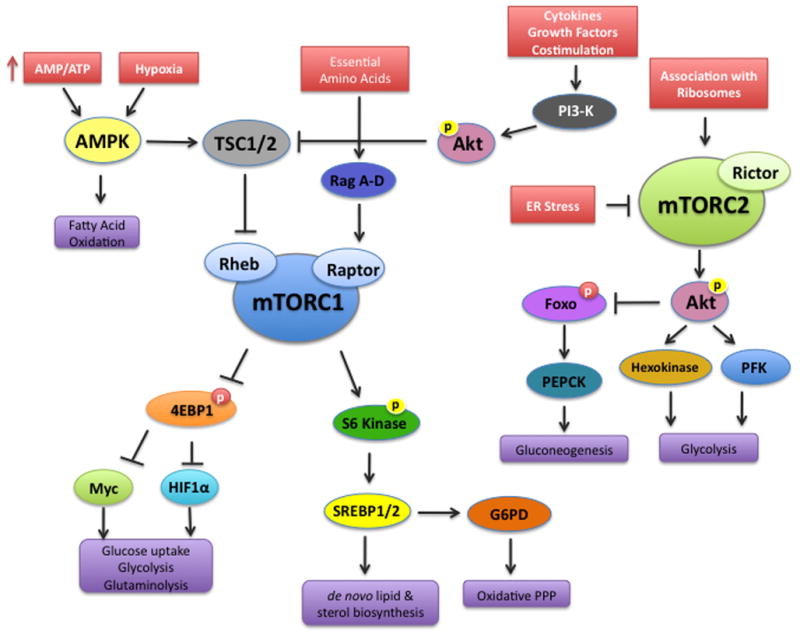
The mammalian target of rapamycin (mTOR) associates with distinct sets of adaptor proteins to form the mTORC1 and mTORC2 signaling complexes. Growth factors, cytokines and comstimulation activate mTORC1 via PI3K activation, while amino acids activate the Ragulator complex (RagA–D). Oxygen and energy availability control mTORC1 via the regulation of AMPK. mTORC1 in turn promotes glycolysis, glutaminolysis, lipid and cholesterol biosynthesis, and the oxidative arm of the pentose phosphate pathway. The canonical downstream targets of mTORC1 include 4E-BP1 and S6 Kinase. While 4E-BP1 regulates the transcription factors HIF-1α and Myc, it appears that S6 Kinase regulates SREBP1/2. mTORC2 is activated by its association with ribosomes and inhibited by endoplasmic reticulum (ER) stress. Akt is activated downstream of mTORC2, but Akt also negatively regulates TSC1/2 upstream of mTORC1. Akt phosphorylates and negatively regulates the Foxo transcription factors, which have been implicated in cell survival and migration. Akt also activates key enzymes in the glycolytic pathway, while simultaneously inhibiting gluconeogenesis through regulation of Foxo transcription factors.
Figure 2. An emerging paradigm linking T cell differentiation and metabolism.
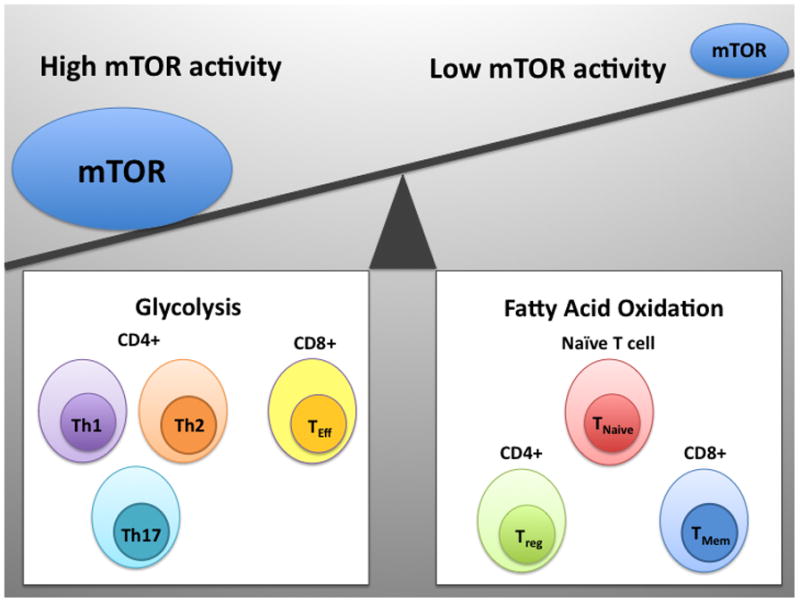
Different lineages of T cells have distinct metabolic profiles. mTOR serves to coordinate differentiation and metabolism. Both CD4+ effector subsets (Th1, Th2, and Th17) and CD8+ effector T cells are characterized by a high rate of glycolysis and high mTOR activity. Conversely, naïve T cells, CD4+ regulatory T cells, and CD8+ memory cells are characterized by low mTOR activity and these cells utilize fatty acid oxidation as a source of fuel.
2.1 mTORC1 signaling
The mTORC1 signaling complex is formed when mTOR associates with a particular set of adaptor proteins, including regulatory-associated protein of mTOR (raptor), mammalian lethal with Sec13 protein 8 (mLST8), and the proline-rich Akt substrate 40 kDa (PRAS40)[11, 16, 17]. mTORC1 activity is activated by its association with the small GTPase Rheb (ras homologue enriched in brain), which itself is negatively regulated by the tuberous sclerosis complex 1/2 (TSC1/2)[18, 19]. The adaptor protein and DEP-domain-containing mTOR-interacting protein (Deptor) can also negatively regulate mTORC1 activity[20]. Both oxygen tension and the energy status of the cell control the activation of TSC1/2 through AMP-activated Kinase (AMPK)[21, 22]. A high AMP/ATP ratio (indicating low energy status) activates AMPK, which in turn activates TSC1/2, leading to repression of mTORC1[23, 24]. Hypoxia also activates AMPK and ultimately leads to decreased mTORC1 activity[25]. By contrast, the availability of essential amino acids leads to activation of mTORC1 through activation of the heterotrimeric GTPases RagA–D, which interact with Raptor to provide a docking site for mTORC1 at lysosomal membranes[26–28]. Additionally, mTORC1 activity can be induced via cytokine and growth factor induced signaling, which is mediated via phosphoinositide 3-kinase (PI-3K) activation.
2.2 mTORC2 signaling
mTORC2 is composed of mLST8 in addition to the scaffolding protein rapamycin-independent companion of TOR (rictor), mammalian stress-activated protein kinase interacting protein (mSIN1), and the protein observed with rictor (Protor)[11, 16]. Recently, two studies have described positive and negative upstream regulators of mTORC2 activity. While physical association of mTORC2 with ribosomes in a PI-3K dependent manner promotes mTORC2 kinase activity, ER stress can inhibit mTORC2 activity via glycogen synthase kinase 3β (GSK3β)[29, 30]. Activation of mTORC2 leads to phosphorylation and activation of a number of downstream AGC kinases including Akt, protein kinase C (PKC), and serum- and glucocorticoid- regulated kinase 1 (SGK1)[31–33].
3. Quiescence vs. Activation
3.1 Role of mTOR in maintaining quiescence
T cell quiescence is an actively maintained state, both at the metabolic and molecular level. Upon emigration from the thymus, naïve T cells circulating in the periphery rely on β-oxidation of fatty acids to maintain their metabolic rate[7]. The quiescent state of naïve T cells is also associated with low mTOR activity, and several studies have shown that high mTOR activity in naïve T cells lacking TSC1 leads to cell death via apoptosis[34–36]. Genetic studies in mice lacking TSC1 have shown that constitutively active mTORC1 results in a loss of quiescence and loss of cellularity, particularly within the CD8 compartment[36]. Cells lacking TSC1 display increased reactive oxygen species (ROS), which leads to mitochondrial damage and activation of the intrinsic cell death pathway[35]. Of the cells that survive despite their abnormally high mTORC1 activity, these cells fail to mount an effective immune response in vivo upon bacterial infection[34]. Thus, low mTOR activity is required to sustain a quiescent metabolic state that promotes survival of naïve T cells.
3.2 Role of mTOR in regulating aerobic glycolysis
Upon simultaneous engagement of antigen and costimulatory recetors, T cells switch their metabolism from fatty acid oxidation to aerobic glycolysis[37]. mTOR is a master regulator of this metabolic switch because mTORC1 in part regulates the activity of 2 key transcription factors that are induced during the first 24 hours of T cell activation: Myc and HIF-1α (Hypoxia-inducible factor 1α)[7, 38]. The first 24 hours of T cell activation seem to be a critical time for reprogramming gene expression to promote a glycolytic phenotype[7]. Although both HIF and Myc are known to drive expression of genes involved in glycolysis, it seems that only Myc is necessary for the glycolytic metabolic switch that occurs in T cells during the early phase of activation[7]. HIF seems to be more important later in T cell development, perhaps in the maintenance of glycolytic metabolism in particular T cell subsets[39].
mTOR promotes Myc translation through phosphorylation and inhibition of the translational repressor 4E-BP1, which liberates eIF-4e. The tertiary structure of the 5′-UTR of Myc mRNA is bound by eIF-4e, which promotes translation of Myc protein[40]. There is also some evidence to suggest that mTOR regulates transcription of Myc through E3-ligase mediated degradation of the transcription factor JunB, which in turn negatively regulates Myc transcription[41]. mTOR-dependent upregulation of Myc during the first 24 hours of T cell activation seems to be a critical event in the transition from a naïve to activated T cell. Mice with T cell-specific inducible deletions of Myc show decreased growth and proliferation, and decreased accumulation of biosynthetic precursors such as lipids, amino acids and nucleotides[7]. Myc deficient T cells fail to upregulate genes involved in the glycolytic pathway and display decreased glycolytic flux.[7] Interestingly, the pentose phosphate pathway and the tricarboxylic acid (TCA) cycle are unperturbed in T cells lacking Myc[7].
In addition to regulating Myc, mTOR promotes a glycolytic phenotype by regulating the expression of key irreversible enzymes at various steps in the pathway, including hexokinase and phosphofructokinase, among others[42]. In order for T cells to maintain aerobic glycolysis, the end product of the glycolytic pathway—pyruvate—must be shunted from the TCA cycle into the production of lactic acid[2, 43]. The conversion of pyruvate to lactate consumes the cofactor NADH, which is necessary for the TCA Cycle to progress. A key regulatory enzyme that catalyzes the conversion of pyruvate to lactate—and thus prevents pyruvate from being converted to acetyl CoA and entering the TCA cycle—is lactate dehydrogenase (LDH). Studies in mouse embryonic fibroblasts (MEFs) and human cancer cells suggest that mTOR controls LDH transcription in a STAT3-dependent manner[44]. It has been shown that HIF-1α regulates LDH transcription in CD4 T cells under Th17 skewing conditions[39], but whether this is a general mechanism that applies to other effector subsets remains uncertain.
3.3 Role of mTOR in regulating glutaminolysis
Glutamine is essential for T cell activation and cytokine production, and uptake of glutamine is increased upon TCR engagement and costimulation[45]. Activated T cells rely on glutamine as an anabolic source of carbon, in addition to being a precursor for polyaminesand glutathione, which can reduce harmful ROS[46]. Glutaminolysis is regulated by Myc which is in part regulated by mTOR [7, 45]. Myc upregulates the surface expression of the glutamine antiporter CD98, which consists of a heterodimer of the solute carrier proteins Slc3a2 and Slc7a5[7]. Beyond glutamine uptake, Myc regulates the catabolism of glutamine by regulating its conversion into glutamate by the enzyme glutaminase[47]. Mechanistically, Myc suppresses the microRNA miR23a/b, which negatively regulates expression of glutaminase[48]. Once glutamine is converted to glutamate, it can be metabolized further into α-ketoglutarate, an oxidative substrate for the TCA cycle. Rather than fueling oxidative phosphorylation, however, α-ketoglutarate can be converted to malate, which can exit the mitochondria to be metabolized into pyruvate and subsequently lactate in the cytoplasm. This shunting of glutamine into lactic acid production is another way that T cells maintain aerobic glycolysis.
3.4 Role of mTOR in regulating lipid and cholesterol biosynthesis
In addition to breaking down carbon sources for fuel, activated T cells must rapidly initiate lipid and cholesterol biosynthesis in order to build cell membranes. This process also seems to be under the control of mTORC1 via activation of the sterol regulatory element-binding protein 1 (SREBP1)[49]. During the first 24 hours of T cell activation, lipid and cholesterol biosynthetic pathways are markedly upregulated, even before DNA replication occurs. mTORC1 controls SREBP via the ribosomal S6 Kinase (S6K)[50]. A recent study on MEFs lacking TSC1/2 suggested that S6K regulates SREBP1 by promoting proteolytic processing of this transcription factor into its active form[42]. SREBP activation leads to upregulation of genes that are involved in de novo lipid and cholesterol biosynthesis, such as HMG CoA reductase and the LDL receptor[42]. Interestingly, SREBP also appears to upregulate transcription of glucose-6-phosphate dehydrogenase (G6PD), an enzyme that catalyzes the rate-limiting step in the pentose phosphate pathway[42]. This pathway is important for generating nucleotide precursors in addition to reducing equivalents in the form of NADPH that can protect rapidly dividing cells against ROS. The generation of cellular building blocks and protection against ROS are critical in the setting of rapid cell proliferation that is observed upon T cell activation, however, little is known about how SREBP regulates these processes specifically in T cells. More work is needed to translate discoveries that have been made about the mTOR pathway in MEFs and transformed cell lines into how these pathways function in T cells.
3.5 Role of mTOR in regulating mitochondrial biogenesis and function
T cells metabolize lipids through β-oxidation of fatty acids, which occurs in the mitochondrial matrix. Thus, it is not surprising that memory CD8 T cells that rely heavily on FAO also have enhanced mitochondrial number and function, both of which are regulated by mTOR[8]. Experiments performed in the Jurkat T cell line have shown that mTORC1 regulates mitochondrial function by increasing mitochondrial membrane potential and oxygen consumption[51]. In skeletal muscle, mTORC1 controls mitochondrial function by promoting the association of PPARγ coactivator 1 (PGC1α) with a zinc-finger transcription factor called yin-yang 1 (YY1)[52]. Treating cells with rapamycin or knockdown of YY1 results in decreased expression of mitochondrial genes and decreased oxygen consumption[52]. In addition, a recent study has described a direct role for mTOR in regulating mitochondrial function via a complex comprising Bcl-xl and the voltage dependent ion channel 1 (VDAC1)[53]. Bcl-xl is directly phosphorylated by mTOR at serine 62[53]. Mechanistically, Bcl-xl associates with VDAC at the outer mitochondrial membrane to keep this channel in an open configuration in order to permit the passage of metabolites into mitochondria[54].
4. Differentiation to effector, regulatory and memory subsets
Metabolism in both CD4 and CD8 T cells is inextricably linked to their differentiation into various effector, regulatory and memory subsets, all of which are coordinated and integrated by mTOR. Recently, there has been much evidence to suggest that mTOR has a role beyond the initial stages of T cell activation in upregulating downstream signaling pathways that dictate T cell differentiation. This is not surprising, however, considering that different lineages of T cells have different metabolic requirements, and there is emerging evidence to suggest that mTOR is responsible for coordinating the upregulation of metabolic machinery to meet those demands. (Figure 2).
4.1 Role of mTOR in CD4 T cell metabolism and differentiation
In CD4 T cells, effector T cells (Teff) utilize glycolysis while regulatory T cells (Treg) primarily utilize fatty acids as a source of fuel[55]. Michalek et al. has shown that overexpression of the glucose transporter Glut1 in T cells enhances Teff differentiation, but Treg differentiation is not affected[55]. Remarkably, culturing T cells with fatty acids leads to an increase in FoxP3 expression and Treg differentiation, while Teff differentiation is suppressed[55]. Inhibition of fatty acid oxidation with etomoxir, an irreversible inhibitor of carnitine palmitoyltransferase I (CPT-I), decreases FoxP3 expression and differentiation of Treg[55]. However, one should be cautious in interpreting this data because etomoxir also activates peroxisome proliferator-activated receptor α (PPARα).
This transcription factor belongs to a family of nuclear receptor proteins that heterodimerize with retinoic acid receptors to upregulate the expression of genes that are involved in fatty acid oxidation by an AMPK-dependent mechanism[56]. Indeed, Treg were shown to have high AMPK activity (and thus low mTOR activity) compared to Teff cells[55]. By contrast, it should be noted that one study has shown that pretreatment of Treg with rapamycin actually resulted in enhanced proliferative capacity, which could be inhibited by addition of the adipokine hormone leptin.[57]
The metabolic profile of Treg versus Teff cells described by Michalek et al. has paralleled our group’s findings on the role of mTOR in regulating T cell differentiation. Just as high AMPK (and low mTOR activity) leads to fatty acid oxidation and Treg differentiation, we have shown using genetic models that low mTOR activity leads to FoxP3 expression and Treg differentiation[58]. We conditionally knocked out mTOR in CD4 T cells and showed that cells could no longer differentiate toward any of the Teff lineages but instead adopted a default regulatory phenotype[58]. Upon activation, mTOR deficient T cells display constitutively high expression of FoxP3 and hyperphosphorylation of Smad3, even in the absence of exogenous TGF-β.
Subsequently we have employed genetic models to study the consequences of selectively ablating mTORC1 or mTORC2 activity in T cells[59]. To generate an mTORC1 knockout, we deleted the small GTPase Rheb in CD4 T cells (T-Rheb−/−)[59]. To generate an mTORC2 knockout, we deleted the adaptor protein Rictor in CD4 T cells (T-Rictor−/−)[59]. We found that T-Rheb−/− mice could not adopt a Th1 or Th17 phenotype [59]. In an experimental autoimmune encephalomyelitis model of disease (EAE), T-Rheb−/− mice were protected from the classical Th1/Th17-mediated autoimmune paralysis, but instead developed a Th2-mediated autoimmune cerebellar ataxia (atypical EAE). By contrast, T-Rictor−/− mice have defective Th2 differentiation, characterized by decreased IL4 production and diminished STAT6 phosphorylation[59]. Interestingly, deletion of either mTORC1 or mTORC2 activity does not lead to an increase in Treg differentiation, suggesting that both mTOR complexes must be inhibited in order to promote a regulatory cell fate[59].
There is also emerging evidence that mTOR controls Th17 differentiation through its regulation of the transcription factor HIF-1α [39, 60]. mTORC1 is known to regulate HIF-1α via phosphorylation and inhibition of the eukaryotic initiation factor 4E (eIF4E)-binding protein 1 (4EBP1)[61]. By repressing 4EBP1, mTORC1 activity leads to upregulation of HIF-1α by stimulating cap-dependent translation from the 5′ untranslated region of HIF-1α mRNA[16, 42]. In turn, HIF-1α promotes the expression of key regulatory genes involved in the glycolytic pathway[62]. Although all Teff subsets utilize aerobic glycolysis as a source of fuel, it seems that the Th17 subset is uniquely dependent on HIF-1α for upregulating the glycolytic machinery[39]. CD4 T cells in which HIF-1α has been genetically deleted cannot differentiate toward the Th17 lineage[39, 60]. By contrast, Th1 and Th2 differentiation remain intact in the absence of HIF-1α[39, 60]. Nevertheless, HIF-1α seems to control the balance between differentiation toward a Th17 phenotype and a Treg phenotype[39, 60]. Upon exposure to TGFβ, CD4 T cells lacking HIF-1α markedly upregulate FoxP3 expression in vitro[39]. In an EAE model, mice with T cell specific deletions of HIF-1α are resistant to disease, presumably because a protective Treg response is generated in these animals[39, 60]. These data suggest that selectively targeting signaling pathways downstream of mTOR can result in highly specific immunomodulation in disease settings, whereby a pathogenic subset of Teff can be inhibited while leaving other Teff subsets and Treg differentiation intact.
There is still much work to be done in order to understand how signaling events downstream of mTOR regulate T cell differentiation and metabolism. We propose that differential signaling via mTORC1 and mTORC2 leads to the upregulation of distinct gene expression programs characteristic of a particular immune and metabolic phenotype. Genetic models may be particularly helpful in elucidating the role of each TOR complex in driving metabolic and fate decisions. For example, the T-Rheb−/− cells can still differentiate towards a Th2 phenotype. It will be interesting to determine if Th2 cells in this setting become glycolytic effector cells or whether they use some other form of energy currency to drive Th2 effector differentiation.
4.2 Role of mTOR in CD8 T cell metabolism, differentiation, and trafficking
Much like mTOR controls the metabolic switch in CD4 T cells, there is new evidence to suggest that mTOR controls the effector to memory transition in CD8 T cells[63–65]. Effector and memory CD8 T cells have unique metabolic demands. While effector CD8 T cells proliferate rapidly and are short-lived, memory CD8 cells have a low turnover rate and proliferate in response to homeostatic cytokines. Like CD4 Teff cells, CD8 Teff utilize glycolysis as their primary source of energy. By contrast, memory CD8 T cells utilize fatty acid oxidation (FAO) and possess a metabolic profile that is more similar to regulatory CD4 T cells[55, 66].
The long lifespan of memory cells poses unique metabolic demands for CD8 lymphocytes, which rely on enhanced mitochondrial function and oxidation of fatty acids as a lasting source of fuel. A recent study showed that CD8 memory cells, but not CD8 Teff cells, have increased mitochondrial spare respiratory capacity (SRC), which is defined as the extra capacity of cells to generate their own sources of energy during nutrient deprivation[8]. Memory cells also rely on signals from homeostatic cytokines such as IL-7 and IL-15 for their survival[67, 68]. Mechanistically, IL-15 (but not IL-2, which is required for the proliferation of Teff cells) regulates SRC by promoting expression of carnitine palmitoyl transferase (CPT1a), an enzyme that is responsible for transporting long-chain fatty acids across mitochondrial membranes so they can undergo β-oxidation in the mitochondrial matrix[8]. CD8 T cells cultured in the presence of IL-15 have better survival compared to those cultured in IL-2, possibly due to the upregulation of the anti-apoptotic factor Bcl-2[8]. Mitochondrial number and function is also enhanced by IL-15, as CD8 T cells cultured with IL-15 display increased mitochondrial biogenesis and ATP production[8]. Such cells demonstrate a better recall response in an in vivo model of Listeria infection, compared to CD8 T cells cultured with IL-2[8]. Thus, the unique bioenergetic demands that memory T cells face in generating a faster and more robust recall response may be explained by their increased SRC and enhanced mitochondrial function.
Several studies have shown that inhibition of mTOR can lead to enhanced memory T cell differentiation[63, 64, 66]. Based on the divergent metabolic demands of effector and memory cells this is not surprising. However, it suggests that rapamycin, initially described as an immunosuppressive agent, may also be employed to enhance CD8 memory generation. Indeed, in a mouse model of Lymphocytic Choriomeningitis Virus (LCMV), rapamycin was shown to increase the number of virus-specific CD8 T cells by promoting survival of memory T cells (TM) during the contraction phase of the immune response[63]. The observed decrease in attrition was due to upregulation of the anti-apoptotic factor Bcl-2[63]. Further, it has been shown that rapamycin can promote CD8 memory cell generation by inhibiting T-bet expression and enhancing eomesodermin expression[64]. In this model, pretreatment of adoptively transferred cells with IL-12 and rapamycin led to tumor rejection and prolonged survival[64]. From a metabolic perspective, it has been shown that AMPK activity is critical for promoting the metabolic program necessary for memory cells and that treatment with metformin can promote this differentiation program[66].
Thus, in CD8 T cells mTOR coordinates metabolism and effector versus memory cell differentiation and function. Interestingly, the mTOR-induced program also coordinates T cell trafficking by regulating cell surface homing receptors. The expression of these homing receptors is in part controlled by mTORC2 via Akt[69]. Activation of Akt downstream of TORC2 results in the downregulation of L-selectin (CD62L), the CC-chemokine receptor 7 (CCR7), and the sphingosine-1-phosphate receptor 1 (S1P1)[70, 71]. These receptors retain CD8 T cells in secondary lymphoid tissues. Increased mTORC2 activity that occurs following T cell activation downregulates the expression of these receptors facilitating homing to the tissues[70]. Mechanistically, the transcription of these homing receptors is controlled by the transcription factor Krüppel-like factor 2 (Klf2)[72]. In turn, transcription of Klf2 is controlled by the forkhead box O (FOXO) family of transcription factors[69]. In resting or naïve T cells where Akt is not active, the FOXO proteins reside in the nucleus where they promote transcription of Klf2[73]. Upon T cell activation, however, Akt phosphorylates the FOXOs, resulting in their translocation from the nucleus to the cytoplasm, where they are held in an inactive state by association with 14-3-3 scaffolding proteins[74–76]. Thus, mTOR is able to simultaneously promote T cell effector differentiation, the upregulation of the metabolic machinery necessary to support this differentiation, and the trafficking of the cells to sites of inflammation.
5. Concluding Remarks
In yeast TOR senses signals from the environment to direct growth and survival. A model has emerged whereby mTOR plays a central role in integrating signals from the immune microenvironment to guide the immune response. This role involves not only promoting differentiation and function but also coordinating metabolism. In this regard it is becoming clear that the upregulation of the metabolic machinery is not simply a consequence of activation but plays a role in promoting activation and differentiation. To this end, it is clear that different T cell subsets have different metabolic requirements. As such, targeting selective metabolic pathways downstream of mTOR may prove to be an effective means of specifically regulating the immune response. That is, targeting pathways that promote glycolysis in T cells may effectively inhibit Th1 responses while simultaneously promoting the development of Tregs. Alternatively, targeting pathways leading to FAO may prove to be an effective means of enhancing anti-tumor responses by enhancing CD8 memory responses and inhibiting CD4 Treg development.
Highlights.
mTOR directs CD4 Th1, Th2, Th17 and regulatory T cell differentiation
mTOR directs CD8 effector versus memory T cell differentiation.
mTOR contributes to the metabolic switch from oxidative phosphorylation in naïve T cells to aerobic glycolysis and glutaminolysis in activated T cells.
mTOR integrates signals to coordinate T cell metabolism, differentiation, and function.
Acknowledgments
We would like to thank members of the Powell Lab for helpful discussions. This work was supported in part by RO1 AI77610 and AI791481
Footnotes
Publisher's Disclaimer: This is a PDF file of an unedited manuscript that has been accepted for publication. As a service to our customers we are providing this early version of the manuscript. The manuscript will undergo copyediting, typesetting, and review of the resulting proof before it is published in its final citable form. Please note that during the production process errors may be discovered which could affect the content, and all legal disclaimers that apply to the journal pertain.
References
- 1.Rathmell JC. T Cell Myc-tabolism. Immunity. 2011;35(6):845–6. doi: 10.1016/j.immuni.2011.12.001. [DOI] [PMC free article] [PubMed] [Google Scholar]
- 2.Fox CJ, Hammerman PS, Thompson CB. Fuel feeds function: energy metabolism and the T-cell response. Nat Rev Immunol. 2005;5(11):844–52. doi: 10.1038/nri1710. [DOI] [PubMed] [Google Scholar]
- 3.Bauer DE, et al. Cytokine stimulation of aerobic glycolysis in hematopoietic cells exceeds proliferative demand. FASEB J. 2004;18(11):1303–5. doi: 10.1096/fj.03-1001fje. [DOI] [PMC free article] [PubMed] [Google Scholar]
- 4.Warburg O. On the origin of cancer cells. Science. 1956;123(3191):309–14. doi: 10.1126/science.123.3191.309. [DOI] [PubMed] [Google Scholar]
- 5.Cairns RA, I, Harris S, Mak TW. Regulation of cancer cell metabolism. Nat Rev Cancer. 2011;11(2):85–95. doi: 10.1038/nrc2981. [DOI] [PubMed] [Google Scholar]
- 6.Gillies RJ, Robey I, Gatenby RA. Causes and consequences of increased glucose metabolism of cancers. J Nucl Med. 2008;49(Suppl 2):24S–42S. doi: 10.2967/jnumed.107.047258. [DOI] [PubMed] [Google Scholar]
- 7.Wang R, et al. The Transcription Factor Myc Controls Metabolic Reprogramming upon T Lymphocyte Activation. Immunity. 2011;35(6):871–82. doi: 10.1016/j.immuni.2011.09.021. [DOI] [PMC free article] [PubMed] [Google Scholar]
- 8.van der Windt GJ, et al. Mitochondrial Respiratory Capacity Is a Critical Regulator of CD8(+) T Cell Memory Development. Immunity. 2011 doi: 10.1016/j.immuni.2011.12.007. [DOI] [PMC free article] [PubMed] [Google Scholar]
- 9.Frauwirth KA, et al. The CD28 signaling pathway regulates glucose metabolism. Immunity. 2002;16(6):769–77. doi: 10.1016/s1074-7613(02)00323-0. [DOI] [PubMed] [Google Scholar]
- 10.Frauwirth KA, Thompson CB. Regulation of T lymphocyte metabolism. J Immunol. 2004;172(8):4661–5. doi: 10.4049/jimmunol.172.8.4661. [DOI] [PubMed] [Google Scholar]
- 11.Laplante M, Sabatini DM. mTOR signaling at a glance. J Cell Sci. 2009;122(Pt 20):3589–94. doi: 10.1242/jcs.051011. [DOI] [PMC free article] [PubMed] [Google Scholar]
- 12.Dann SG, Thomas G. The amino acid sensitive TOR pathway from yeast to mammals. FEBS Lett. 2006;580(12):2821–9. doi: 10.1016/j.febslet.2006.04.068. [DOI] [PubMed] [Google Scholar]
- 13.Zoncu R, Efeyan A, Sabatini DM. mTOR: from growth signal integration to cancer, diabetes and ageing. Nat Rev Mol Cell Biol. 2011;12(1):21–35. doi: 10.1038/nrm3025. [DOI] [PMC free article] [PubMed] [Google Scholar]
- 14.Laplante M, Sabatini DM. mTOR signaling in growth control and disease. Cell. 2012;149(2):274–93. doi: 10.1016/j.cell.2012.03.017. [DOI] [PMC free article] [PubMed] [Google Scholar]
- 15.Waickman AT, Powell JD. mTOR, metabolism, and the regulation of T-cell differentiation and function. Immunol Rev. 2012;249(1):43–58. doi: 10.1111/j.1600-065X.2012.01152.x. [DOI] [PMC free article] [PubMed] [Google Scholar]
- 16.Yecies JL, Manning BD. Transcriptional control of cellular metabolism by mTOR signaling. Cancer Res. 2011;71(8):2815–20. doi: 10.1158/0008-5472.CAN-10-4158. [DOI] [PMC free article] [PubMed] [Google Scholar]
- 17.Wang L, et al. PRAS40 regulates mTORC1 kinase activity by functioning as a direct inhibitor of substrate binding. J Biol Chem. 2007;282(27):20036–44. doi: 10.1074/jbc.M702376200. [DOI] [PubMed] [Google Scholar]
- 18.Yamagata K, et al. rheb, a growth factor- and synaptic activity-regulated gene, encodes a novel Ras-related protein. J Biol Chem. 1994;269(23):16333–9. [PubMed] [Google Scholar]
- 19.Zhang Y, et al. Rheb is a direct target of the tuberous sclerosis tumour suppressor proteins. Nat Cell Biol. 2003;5(6):578–81. doi: 10.1038/ncb999. [DOI] [PubMed] [Google Scholar]
- 20.Peterson TR, et al. DEPTOR is an mTOR inhibitor frequently overexpressed in multiple myeloma cells and required for their survival. Cell. 2009;137(5):873–86. doi: 10.1016/j.cell.2009.03.046. [DOI] [PMC free article] [PubMed] [Google Scholar]
- 21.Corradetti MN, et al. Regulation of the TSC pathway by LKB1: evidence of a molecular link between tuberous sclerosis complex and Peutz-Jeghers syndrome. Genes Dev. 2004;18(13):1533–8. doi: 10.1101/gad.1199104. [DOI] [PMC free article] [PubMed] [Google Scholar]
- 22.Lee M, et al. AMP-activated protein kinase activity is critical for hypoxia-inducible factor-1 transcriptional activity and its target gene expression under hypoxic conditions in DU145 cells. J Biol Chem. 2003;278(41):39653–61. doi: 10.1074/jbc.M306104200. [DOI] [PubMed] [Google Scholar]
- 23.Sengupta S, Peterson TR, Sabatini DM. Regulation of the mTOR complex 1 pathway by nutrients, growth factors, and stress. Mol Cell. 2010;40(2):310–22. doi: 10.1016/j.molcel.2010.09.026. [DOI] [PMC free article] [PubMed] [Google Scholar]
- 24.Gwinn DM, et al. AMPK phosphorylation of raptor mediates a metabolic checkpoint. Mol Cell. 2008;30(2):214–26. doi: 10.1016/j.molcel.2008.03.003. [DOI] [PMC free article] [PubMed] [Google Scholar]
- 25.Schneider A, Younis RH, Gutkind JS. Hypoxia-induced energy stress inhibits the mTOR pathway by activating an AMPK/REDD1 signaling axis in head and neck squamous cell carcinoma. Neoplasia. 2008;10(11):1295–302. doi: 10.1593/neo.08586. [DOI] [PMC free article] [PubMed] [Google Scholar]
- 26.Sancak Y, et al. The Rag GTPases bind raptor and mediate amino acid signaling to mTORC1. Science. 2008;320(5882):1496–501. doi: 10.1126/science.1157535. [DOI] [PMC free article] [PubMed] [Google Scholar]
- 27.Kim E, et al. Regulation of TORC1 by Rag GTPases in nutrient response. Nat Cell Biol. 2008;10(8):935–45. doi: 10.1038/ncb1753. [DOI] [PMC free article] [PubMed] [Google Scholar]
- 28.Sancak Y, et al. Ragulator-Rag complex targets mTORC1 to the lysosomal surface and is necessary for its activation by amino acids. Cell. 2010;141(2):290–303. doi: 10.1016/j.cell.2010.02.024. [DOI] [PMC free article] [PubMed] [Google Scholar]
- 29.Zinzalla V, et al. Activation of mTORC2 by association with the ribosome. Cell. 2011;144(5):757–68. doi: 10.1016/j.cell.2011.02.014. [DOI] [PubMed] [Google Scholar]
- 30.Chen CH, et al. ER stress inhibits mTORC2 and Akt signaling through GSK-3beta-mediated phosphorylation of rictor. Sci Signal. 2011;4(161):ra10. doi: 10.1126/scisignal.2001731. [DOI] [PubMed] [Google Scholar]
- 31.Guertin DA, et al. Ablation in mice of the mTORC components raptor, rictor, or mLST8 reveals that mTORC2 is required for signaling to Akt-FOXO and PKCalpha, but not S6K1. Dev Cell. 2006;11(6):859–71. doi: 10.1016/j.devcel.2006.10.007. [DOI] [PubMed] [Google Scholar]
- 32.Ikenoue T, et al. Essential function of TORC2 in PKC and Akt turn motif phosphorylation, maturation and signalling. EMBO J. 2008;27(14):1919–31. doi: 10.1038/emboj.2008.119. [DOI] [PMC free article] [PubMed] [Google Scholar]
- 33.Garcia-Martinez JM, Alessi DR. mTOR complex 2 (mTORC2) controls hydrophobic motif phosphorylation and activation of serum- and glucocorticoid-induced protein kinase 1 (SGK1) Biochem J. 2008;416(3):375–85. doi: 10.1042/BJ20081668. [DOI] [PubMed] [Google Scholar]
- 34.Yang K, et al. The tumor suppressor Tsc1 enforces quiescence of naive T cells to promote immune homeostasis and function. Nat Immunol. 2011;12(9):888–97. doi: 10.1038/ni.2068. [DOI] [PMC free article] [PubMed] [Google Scholar]
- 35.O’Brien TF, et al. Regulation of T-cell survival and mitochondrial homeostasis by TSC1. Eur J Immunol. 2011;41(11):3361–70. doi: 10.1002/eji.201141411. [DOI] [PMC free article] [PubMed] [Google Scholar]
- 36.Wu Q, et al. The tuberous sclerosis complex-mammalian target of rapamycin pathway maintains the quiescence and survival of naive T cells. J Immunol. 2011;187(3):1106–12. doi: 10.4049/jimmunol.1003968. [DOI] [PMC free article] [PubMed] [Google Scholar]
- 37.Buttgereit F, Brand MD, Muller M. ConA induced changes in energy metabolism of rat thymocytes. Biosci Rep. 1992;12(2):109–14. doi: 10.1007/BF02351215. [DOI] [PubMed] [Google Scholar]
- 38.Gordan JD, Thompson CB, Simon MC. HIF and c-Myc: sibling rivals for control of cancer cell metabolism and proliferation. Cancer Cell. 2007;12(2):108–13. doi: 10.1016/j.ccr.2007.07.006. [DOI] [PMC free article] [PubMed] [Google Scholar]
- 39.Shi LZ, et al. HIF1alpha-dependent glycolytic pathway orchestrates a metabolic checkpoint for the differentiation of TH17 and Treg cells. J Exp Med. 2011;208(7):1367–76. doi: 10.1084/jem.20110278. [DOI] [PMC free article] [PubMed] [Google Scholar]
- 40.Shi Y, et al. Cyclin D1 and c-myc internal ribosome entry site (IRES)-dependent translation is regulated by AKT activity and enhanced by rapamycin through a p38 MAPK- and ERK-dependent pathway. J Biol Chem. 2005;280(12):10964–73. doi: 10.1074/jbc.M407874200. [DOI] [PubMed] [Google Scholar]
- 41.Vartanian R, et al. AP-1 regulates cyclin D1 and c-MYC transcription in an AKT-dependent manner in response to mTOR inhibition: role of AIP4/Itch-mediated JUNB degradation. Mol Cancer Res. 2011;9(1):115–30. doi: 10.1158/1541-7786.MCR-10-0105. [DOI] [PMC free article] [PubMed] [Google Scholar]
- 42.Duvel K, et al. Activation of a metabolic gene regulatory network downstream of mTOR complex 1. Mol Cell. 2010;39(2):171–83. doi: 10.1016/j.molcel.2010.06.022. [DOI] [PMC free article] [PubMed] [Google Scholar]
- 43.Brand K, et al. Cell-cycle-related metabolic and enzymatic events in proliferating rat thymocytes. Eur J Biochem. 1988;172(3):695–702. doi: 10.1111/j.1432-1033.1988.tb13944.x. [DOI] [PubMed] [Google Scholar]
- 44.Zha X, et al. Lactate dehydrogenase B is critical for hyperactive mTOR-mediated tumorigenesis. Cancer Res. 2011;71(1):13–8. doi: 10.1158/0008-5472.CAN-10-1668. [DOI] [PubMed] [Google Scholar]
- 45.Carr EL, et al. Glutamine uptake and metabolism are coordinately regulated by ERK/MAPK during T lymphocyte activation. J Immunol. 2010;185(2):1037–44. doi: 10.4049/jimmunol.0903586. [DOI] [PMC free article] [PubMed] [Google Scholar]
- 46.Thomas T, Thomas TJ. Polyamines in cell growth and cell death: molecular mechanisms and therapeutic applications. Cell Mol Life Sci. 2001;58(2):244–58. doi: 10.1007/PL00000852. [DOI] [PMC free article] [PubMed] [Google Scholar]
- 47.Wise DR, et al. Myc regulates a transcriptional program that stimulates mitochondrial glutaminolysis and leads to glutamine addiction. Proc Natl Acad Sci U S A. 2008;105(48):18782–7. doi: 10.1073/pnas.0810199105. [DOI] [PMC free article] [PubMed] [Google Scholar]
- 48.Gao P, et al. c-Myc suppression of miR-23a/b enhances mitochondrial glutaminase expression and glutamine metabolism. Nature. 2009;458(7239):762–5. doi: 10.1038/nature07823. [DOI] [PMC free article] [PubMed] [Google Scholar]
- 49.Porstmann T, et al. SREBP activity is regulated by mTORC1 and contributes to Akt-dependent cell growth. Cell Metab. 2008;8(3):224–36. doi: 10.1016/j.cmet.2008.07.007. [DOI] [PMC free article] [PubMed] [Google Scholar]
- 50.Yecies JL, et al. Akt stimulates hepatic SREBP1c and lipogenesis through parallel mTORC1-dependent and independent pathways. Cell Metab. 2011;14(1):21–32. doi: 10.1016/j.cmet.2011.06.002. [DOI] [PMC free article] [PubMed] [Google Scholar]
- 51.Schieke SM, et al. The mammalian target of rapamycin (mTOR) pathway regulates mitochondrial oxygen consumption and oxidative capacity. J Biol Chem. 2006;281(37):27643–52. doi: 10.1074/jbc.M603536200. [DOI] [PubMed] [Google Scholar]
- 52.Cunningham JT, et al. mTOR controls mitochondrial oxidative function through a YY1-PGC-1alpha transcriptional complex. Nature. 2007;450(7170):736–40. doi: 10.1038/nature06322. [DOI] [PubMed] [Google Scholar]
- 53.Ramanathan A, Schreiber SL. Direct control of mitochondrial function by mTOR. Proc Natl Acad Sci U S A. 2009;106(52):22229–32. doi: 10.1073/pnas.0912074106. [DOI] [PMC free article] [PubMed] [Google Scholar]
- 54.Vander Heiden MG, et al. Bcl-xL promotes the open configuration of the voltage-dependent anion channel and metabolite passage through the outer mitochondrial membrane. J Biol Chem. 2001;276(22):19414–9. doi: 10.1074/jbc.M101590200. [DOI] [PubMed] [Google Scholar]
- 55.Michalek RD, et al. Cutting edge: distinct glycolytic and lipid oxidative metabolic programs are essential for effector and regulatory CD4+ T cell subsets. J Immunol. 2011;186(6):3299–303. doi: 10.4049/jimmunol.1003613. [DOI] [PMC free article] [PubMed] [Google Scholar]
- 56.Dreyer C, et al. Control of the peroxisomal beta-oxidation pathway by a novel family of nuclear hormone receptors. Cell. 1992;68(5):879–87. doi: 10.1016/0092-8674(92)90031-7. [DOI] [PubMed] [Google Scholar]
- 57.Procaccini C, et al. An oscillatory switch in mTOR kinase activity sets regulatory T cell responsiveness. Immunity. 2010;33(6):929–41. doi: 10.1016/j.immuni.2010.11.024. [DOI] [PMC free article] [PubMed] [Google Scholar]
- 58.Delgoffe GM, et al. The mTOR kinase differentially regulates effector and regulatory T cell lineage commitment. Immunity. 2009;30(6):832–44. doi: 10.1016/j.immuni.2009.04.014. [DOI] [PMC free article] [PubMed] [Google Scholar]
- 59.Delgoffe GM, et al. The kinase mTOR regulates the differentiation of helper T cells through the selective activation of signaling by mTORC1 and mTORC2. Nat Immunol. 2011;12(4):295–303. doi: 10.1038/ni.2005. [DOI] [PMC free article] [PubMed] [Google Scholar]
- 60.Dang EV, et al. Control of T(H)17/T(reg) balance by hypoxia-inducible factor 1. Cell. 2011;146(5):772–84. doi: 10.1016/j.cell.2011.07.033. [DOI] [PMC free article] [PubMed] [Google Scholar]
- 61.Brugarolas J, et al. Regulation of mTOR function in response to hypoxia by REDD1 and the TSC1/TSC2 tumor suppressor complex. Genes Dev. 2004;18(23):2893–904. doi: 10.1101/gad.1256804. [DOI] [PMC free article] [PubMed] [Google Scholar]
- 62.Semenza GL. Hypoxia-inducible factor 1 (HIF-1) pathway. Sci STKE. 2007;2007(407):cm8. doi: 10.1126/stke.4072007cm8. [DOI] [PubMed] [Google Scholar]
- 63.Araki K, et al. mTOR regulates memory CD8 T-cell differentiation. Nature. 2009;460(7251):108–12. doi: 10.1038/nature08155. [DOI] [PMC free article] [PubMed] [Google Scholar]
- 64.Rao RR, et al. The mTOR kinase determines effector versus memory CD8+ T cell fate by regulating the expression of transcription factors T-bet and Eomesodermin. Immunity. 2010;32(1):67–78. doi: 10.1016/j.immuni.2009.10.010. [DOI] [PMC free article] [PubMed] [Google Scholar]
- 65.He S, et al. Characterization of the metabolic phenotype of rapamycin-treated CD8+ T cells with augmented ability to generate long-lasting memory cells. PLoS One. 2011;6(5):e20107. doi: 10.1371/journal.pone.0020107. [DOI] [PMC free article] [PubMed] [Google Scholar]
- 66.Pearce EL, et al. Enhancing CD8 T-cell memory by modulating fatty acid metabolism. Nature. 2009;460(7251):103–7. doi: 10.1038/nature08097. [DOI] [PMC free article] [PubMed] [Google Scholar]
- 67.Schluns KS, et al. Interleukin-7 mediates the homeostasis of naive and memory CD8 T cells in vivo. Nat Immunol. 2000;1(5):426–32. doi: 10.1038/80868. [DOI] [PubMed] [Google Scholar]
- 68.Ku CC, et al. Control of homeostasis of CD8+ memory T cells by opposing cytokines. Science. 2000;288(5466):675–8. doi: 10.1126/science.288.5466.675. [DOI] [PubMed] [Google Scholar]
- 69.Finlay D, Cantrell D. Phosphoinositide 3-kinase and the mammalian target of rapamycin pathways control T cell migration. Ann N Y Acad Sci. 2010;1183:149–57. doi: 10.1111/j.1749-6632.2009.05134.x. [DOI] [PMC free article] [PubMed] [Google Scholar]
- 70.Bai A, et al. Kruppel-like factor 2 controls T cell trafficking by activating L-selectin (CD62L) and sphingosine-1-phosphate receptor 1 transcription. J Immunol. 2007;178(12):7632–9. doi: 10.4049/jimmunol.178.12.7632. [DOI] [PubMed] [Google Scholar]
- 71.Sinclair LV, et al. Phosphatidylinositol-3-OH kinase and nutrient-sensing mTOR pathways control T lymphocyte trafficking. Nat Immunol. 2008;9(5):513–21. doi: 10.1038/ni.1603. [DOI] [PMC free article] [PubMed] [Google Scholar]
- 72.Carlson CM, et al. Kruppel-like factor 2 regulates thymocyte and T-cell migration. Nature. 2006;442(7100):299–302. doi: 10.1038/nature04882. [DOI] [PubMed] [Google Scholar]
- 73.Sebzda E, et al. Transcription factor KLF2 regulates the migration of naive T cells by restricting chemokine receptor expression patterns. Nat Immunol. 2008;9(3):292–300. doi: 10.1038/ni1565. [DOI] [PubMed] [Google Scholar]
- 74.Rena G, et al. Roles of the forkhead in rhabdomyosarcoma (FKHR) phosphorylation sites in regulating 14-3-3 binding, transactivation and nuclear targetting. Biochem J. 2001;354(Pt 3):605–12. doi: 10.1042/0264-6021:3540605. [DOI] [PMC free article] [PubMed] [Google Scholar]
- 75.Brunet A, et al. 14-3-3 transits to the nucleus and participates in dynamic nucleocytoplasmic transport. J Cell Biol. 2002;156(5):817–28. doi: 10.1083/jcb.200112059. [DOI] [PMC free article] [PubMed] [Google Scholar]
- 76.Hedrick SM. The cunning little vixen: Foxo and the cycle of life and death. Nat Immunol. 2009;10(10):1057–63. doi: 10.1038/ni.1784. [DOI] [PMC free article] [PubMed] [Google Scholar]