

Abstract
In this manuscript, we describe a protocol for capturing both physiological and structural properties of living neuronal tissue. An essential aspect of this method is its flexibility and fast turnaround time. It is a streamlined process that includes recording of electrophysiological neuronal activity, calcium imaging, and structural analysis. This is accomplished by placing intact tissue on a modified Millicell Biopore insert. The Biopore membrane suspends the tissue in the perfusion solution, allowing for complete access to nutrients, oxygen, and pharmacological agents. The ring that holds the membrane ensures its structural stability; forceps can be used to grip the ring without contacting the filter or the tissue, for easy transfer between multiple setups. We show that tissue readily adheres to the surface of the membrane, its entire surface is visible in transmitted light and accessible for recording and imaging, and remains responsive to physiological stimuli for extended periods of time.
Keywords: physiology, live imaging, immunohistochemistry, vasculature, retina
1. Introduction
Advanced techniques for assessing physiology of neuronal cells and their networks have been available for many years. In particular, cellular electrophysiology can be performed with single cell patch clamp recordings, or using planar and 3D multielectrode arrays for multicellular responses (Hamill et al., 1981; Meister et al., 1994; Nicolelis et al 1997; Charvet et al., 2010). Fluorescent imaging with ion and voltage-sensitive indicators is used to assess the properties of cellular compartments and their networks (Tsien, 1981; Wong and Oakley, 1996; Lohmann et al., 2002; Stosiek et al., 2003).
Because many response parameters are cell-specific, the need to concurrently analyze both functional and structural aspects has become widespread in neuroscience research (Yaksi et al., 2006). To date, this approach demanded costly customized equipment, procedures, and expertise that are not readily available to many laboratories (Wei et al., 2010). Conventionally, dissected tissue is placed on the glass bottom of a physiological chamber and held in place with an anchored nylon mesh. Alternatively, a tissue sample is pressed down with a filter paper or placed in between two halves of the recording chamber (Newman and Bartosch, 1999; Hu et al., 2000). These approaches have several limitations. Physical pressure can result in structural damage and the tissue may strongly adhere to bottom of the recording chamber, causing damage during transfer. While the latter can be avoided by integrating an imaging unit such as a confocal microscope with the physiological setup, this approach requires costly modifications and prevents the imaging unit from being shared as a standalone workstation (Wei et al., 2010). However, tissue transfer cannot be avoided if performing subsequent immunohistochemical analysis, where preservation of structural integrity is critical. Additionally, with these approaches, only limited parts of the tissue are exposed to the bath solution containing oxygen and nutrients, truncating its viability.
To address these limitations, we describe an affordable solution, using an efficient and flexible protocol, that allows for a comprehensive characterization of neural tissue. To accomplish this goal, we searched for a neutral substrate capable of maintaining the structural and physiological stability of the tissue while providing an opportunity to easily transfer the preparation across multiple experimental setups. Modified Biopore polytetrafluoroethylene (PTFE) membrane inserts fit well for this purpose based on several key features. Due to their superb biocompatibility, Biopore inserts are widely used in medical applications such as growing cell cultures (Falsig et al., 2007, Sawamiphak et al., 2010). Importantly, the porous membrane suspends the tissue in the perfusion solution, allowing easy access to nutrients, oxygen, and when necessary, pharmacological agents. When in solution, the membrane is optically clear, allowing easy observation with common microscope techniques. The ability to present light stimuli using the transmitted light pathway of the microscope without obstructing the preparation is of particular importance to retina and when using optogenetic approach in other tissues.
2. Materials and methods
2.1 Animals
In all experimental procedures, the animals were treated according to the regulations in the ARVO Statement for the Use of Animals in Ophthalmic and Vision Research, in compliance with protocols approved by the Institutional Animal Care and Use Committee Weill Cornell Medical College, and were in accordance with the NIH Guide for the Care and Use of Laboratory Animals. Mice homozygous for the Thy1-YFP allele (B6.Cg-Tg(thy1-YFP)/J) and wild type mice (C57BL/6J) were obtained from the Jackson Laboratory (Bar Harbor, ME). For the recordings of light responses, 2 month old mice were used.
2.2 Flat mount retinal preparation
After the animal was euthanized, its eyes were enucleated and placed in bicarbonate-buffered Ames medium continuously equilibrated with O2/CO2. The retina was dissected as described in detail elsewhere (Sagdullaev et al., 2011) and attached photoreceptor surface down to a modified hydrophilic Millicell Biopore Insert (Cat no. PICM 01250, Millipore, Bedford, MA). During modification the circular holder portion was cut to the final height of 1 mm (Fig. 1A). To reduce the required volume of bathing solution in the chamber, the feet on the underside of the ring were removed or filed down. The neuronal tissue was mounted on the membrane with gentle suction (Fig. 1B). An empty insulin syringe (1 ml) with flat cut needle holding tip was placed tightly against the opposite from the tissue side of the membrane, then the plunger was pulled back to approximately 0.2–0.3 ml. The adhesion does not require any special treatment, because the tissue is physically enmeshed within the membrane pores. With this procedure, we successfully mounted both whole isolated mouse retinas and dissected quadrants. For larger tissue, a larger syringe may be more appropriate. Individual whole mounts attached to the carrier membrane were then transferred to a recording chamber (Fig. 1C) and bath (1 ml/min) with bicarbonate-buffered Ames medium at near physiological level of 32 °C.
Figure 1. Application of modified Millicell Biopore culture plate inserts for mounting intact neuronal tissue for physiological and structural assessment.

A. A view of a 12 mm Millicell insert before and after modification. B. Neuronal tissue/slice is transferred on the top surface of the membrane. Modified insulin syringe is placed on the back of the insert and gentle suction is applied to attach the neuronal tissue to the membrane. In this example, a fraction (left) or a whole (right) retinal tissue is readily attached to the membrane. The preparation can be manipulated with a pair of forceps by the plastic ring of the insert. Once in physiological media, the hydrophilic Biopore membrane becomes virtually transparent. For larger tissue specimens, a combination of larger Millicell Biopore culture plate inserts with a larger diameter syringe could be used. C. An insert with the neuronal tissue transferred into the perfused chamber on the microscope stage for patch-clamp recording and calcium imaging.
2.3 Electrophysiology
Brief characterization of extracellular spiking activity was obtained prior to breaking into the cell for whole-cell current recordings. Synaptic currents were measured using patch pipettes filled with intracellular solution containing (in mM) 120 Cs-2nate, 10 tetraethylammonium chloride (TEA-Cl), 1.0 CaCl2, 1.0 MgCl2, 11 ethylene glycol-bis (beta-aminoethyl ether)-N,N,N′,N′-tetraacetic acid (EGTA), and 10 sodium N-2-hydroxyethylpiperazine- N′-2-ethanesulfonic acid (Na-HEPES), adjusted to pH 7.2 with CsOH. The calculated ECl for this solution was −58 mV. Intracellular solutions were supplemented with 0.05% sulforhodamine B or Alexa Fluor 568 hydrazide to visualize non-prelabeled cells. For designated prolonged recordings of extracellular activity, the electrode was filled with HEPES-buffered extracellular Ringer’s solution 1, containing the following (in mm): 137 NaCl, 2.5 KCl, 2.5 CaCl2, 1.0 MgCl2, 10 Na-HEPES, 28 glucose, pH 7.4. Electrodes were pulled from borosilicate glass (1B150F-4; WPI, Sarasota, FL) with a P-97 Flaming/Brown puller (Sutter Instruments, Novato, CA) and had a measured resistance of ~4–7 ΩM. All recordings were made with MultiClamp 700B patch-clamp amplifier (Molecular Devices, Sunnyvale, CA) using Signal (CED, UK).
2.4 Light Stimulation
For the experiments involving light stimulation, a series of responses was recorded to a single or a pair of light flashes with 3s interstimulus interval (ISI). For GC recordings, the microscope’s illuminator was used to deliver a 250 μm spot of light that was centered on the GC and focused on the photoreceptor cell layer. An aperture, a series of neutral density filters, and the FN-C LWD condenser (Nikon) were used to control the size, intensity, and focal plane of the stimulus. The tissue was adapted at 30 cd/m2, and stimulus was 270 cd/m2. The stimulation routines were controlled by Signal 2 software (CED). Duration of the light stimulus was controlled by a Uniblitz shutter (Vincent Associates). Each set of stimuli was separated by a 60 s ISI. Light responses were not performed while using epifluorescent illumination to image YFP/Ca2+ indicator-loaded cells. YFP-expressing cells were illuminated briefly for identification and location only, and afterwards, the tissue/target cell bodies were positioned relative to markings of the microscope objective. After this, targeting the cell and physiological recordings were accomplished using DIC optics.
2.5 Calcium imaging
Retinas were loaded with the calcium indicator Oregon Green 488 BAPTA-1 AM (OGB-1 AM; Invitrogen) using the multicell bolus loading technique (Stosiek et al., 2003). OGB-1-AM stock 10 mM solution in 2% pluronic in DMSO was diluted 1/10 in HEPES-buffered media. Epifluorescent calcium imaging was performed on an inverted Nikon Eclipse Ti-U microscope. The pipette containing OGB-1-AM was positioned under the inner limiting membrane, and dye was pressure injected for 1 s in three to five locations per retina at a pressure of 10–20 psi (Picosprotzer III, Parker Automation). Images were acquired using a Nikon D5000 DSLR at 24 frames per second at 1280×720 pixels, in exposure locked mode to prevent automatic compensation for changing light levels. Videos were synchronized with physiological recordings with a TTL and audio pulses registered along with the video, and read into the data acquisition unit. The DSLR camera was attached to microscope’s camera port using a commercially available adapter (Part no. MXA29010, Nikon). Images were imported into Matlab (Mathworks, Natick, MA) for ΔF/F analysis. Changes in intracellular ion activities (ΔF/F) were calculated using a custom MATLAB script and mapped to a color gradient for display purposes. Individual events were not time-tagged. Cross-covariance analysis was performed using built-in MATLAB functions to compare entire ΔF/F and whole-cell waveforms, which required resampling whole-cell recording data to match that of the camera frame rate. Otherwise, the analysis did not utilize spatial or temporal binning.
2.6 Live staining and post fix immunohistochemistry
For live nuclear staining, a stock solution, 2 μL of an equal mixture of 12 mM ethidium bromide and 100 μM To-Pro-3 (Invitrogen, Carlsbad, CA) was added to the tissue preparation for determining the borders of the inner plexiform layer. For live vascular staining, 1 μM sulforhodamine was added to the tissue preparation.
For immunohistochemistry, the same retinas can be removed from the filters with forceps and fixed with 4% paraformaldehyde in 0.1 M phosphate buffer (PB) for 15 minutes. Later we modified the procedure by leaving the retina on the filter for the entire staining protocol. For immunostaining, retinal pieces were blocked for 1 h in a solution containing 5% Chemiblocker (membrane-blocking agent, Chemicon), 0.5% Triton X-100, and 0.05% sodium azide (Sigma). Primary antibodies were diluted in the same solution and applied for 48 h, followed by incubation for 12 h in the appropriate secondary antibody, which was conjugated to Alexa 568 (1:600; red fluorescence, Molecular Probes), Alexa 488 (1:600; green fluorescence, Molecular Probes), or Alexa 647 (1:70; far red fluorescence, Molecular probes). All steps were carried out at room temperature. After staining the retina was flat mounted on a slide ganglion cell layer up, and cover slipped using Vectashield mounting medium (H-1000, Vector Laboratories). The coverslip was sealed in place with nail polish. Small pieces of a broken cover slip glass (Number 1 size) were placed in between the slide and the coverslip glasses to avoid extensive squeezing and damage to the retina. The YFP and Alexa 568 fluorescence was sufficient to visualize the YFP-expressing or Alexa 568-filled neurons, without antibody enhancement. Goat anti-choline acetyl transferase (ChAT, 1:2000 for labeling with green or red secondary antibodies and 1:200 for labeling with far red antibodies; Cat # AB144P; Chemicon) is a well-established marker for retinal cholinergic amacrine cells (Haverkamp et al., 2009). The ChAT antiserum recognized a 70 kDa band on a western blot of mouse brain lysate (manufacturer’s datasheet). Blood vessels were visualized in fixed retinal tissue based on the unspecific labeling produced by secondary anti-mouse antibodies.
3. Results
The technique we describe allows for a fast comprehensive physiological, anatomical, and immunohistological characterization of cells in using a flexible branching protocol (Fig. 2). It begins with a modified Biopore membrane-supported flat mount preparation, which can be used for electrophysiological characterization and calcium imaging. This preparation can be transferred immediately to another device such as a confocal microscope for live tissue staining and imaging, and/or it can be fixed and processed afterwards using conventional immunohistochemical protocols.
Figure 2. Flowchart representing flexibility of tissue analysis.

Once mounted on a modified Millipore insert, intact living neuronal tissue could be readily transferred across multiple experimental setups for an array of structural and physiological assessments. The same tissue can then either remain on the Biopore membrane or be easily unmounted, fixed and undergo conventional immunohistochemical analysis.
3.1 Use of Biopore membranes and viability of intact brain tissue
Ideally, any neuronal tissue should be subjected to minimal treatment during preparation. In our approach, this was achieved by adhering the freshly dissected tissue to a modified Biopore insert that contains a type of membrane widely used for growing organotypic cell cultures (see Methods). When in solution, the membrane retains nearly full optical clarity, allowing easy observation with common microscope techniques (Fig. 3A). This feature is of particular importance to retinal tissue, in that light stimuli may be presented without obstruction of the preparation, using the transmitted light pathway of the microscope. The polycarbonate ring that holds the Biopore membrane ensures its structural stability and support, preventing warping and torsion of the flat mount preparation without putting extra strain on the tissue, in contrast to more conventional methods that use a mesh grid to press the specimen against glass. This is particularly crucial during transfer of the preparation with forceps, since any direct contact with the tissue is avoided. Importantly, the membrane insert suspends the tissue in the perfusion solution, allowing it to flow both above and below the tissue instead of on just one side.
Figure 3. Recording procedures and identification of neuronal cells in mounted tissue.

A. The top view of the wholemount retinal preparation mounted on Millicell insert (top). The outlines of individual retinal ganglion cell (RGC) bodies are visible across the field with DIC optics (middle). The recording pipette (arrow) is targeting one of the RGCs (arrowhead). Fluorescent image of RGC with attached recording pipette filled with dye (bottom). B. Physiological responses to light from the same RGC. A spot of light 250 μm in diameter was centered on the RGC receptive field. The spiking activity was recorded first in a cell attached mode, followed by membrane rupture and whole cell patch-clamp current recordings (Vh = −60mV). C. Representative response to a pair of brief light flashes 3 seconds apart. Scale bars in A are adjusted to 50 μm.
As illustrated in Fig. 3, physiological activity is preserved, and both spontaneous activity and light responses are superior to slice preparation (Sagdullaev et al., 2011). We attribute this to both greater preservation of intercellular connections across the tissue as well as thorough perfusion. Both spiking and current responses correlated to the corresponding stimulus, as illustrated for light spot flashes of 0.2, 2.0, and 5.0 seconds, centered on RGC receptive field (Fig. 3B). During our experiments, the physiological responses from the preparation could be obtained for 8–10 hours following dissection of the retina, and stable responses from an individual cell could be maintained for sessions lasting for 2 hours. There were little or no signs of bleaching, as illustrated for pairs of brief flashes of light as illustrated for the same representative RGC (Fig. 3C). This stability may be explained in part by retained RPE cells adhering to photoreceptor outer segments (Fig. 1B) as well as the presence of recently described RPE-independent visual cycle system (Wang et al., 2009).
3.2 Simultaneous electrophysiology, calcium imaging and vasculature staining
The in situ approach allows the recorded cell to function within intact surrounding tissue, permitting visualization of the activity of that tissue, using epifluorescent calcium imaging. Unlike methods of visualization that utilize specialty imaging sensors, we adopted a consumer DSLR camera, which is widely available for a fraction of the cost, with temporal and spatial resolutions that match that of the majority of dedicated sensors. We find that consumer DSLRs may be used in this application, though additional steps must be taken to create a proper hardware/software interface, particularly to synchronize input (see Methods). The viability of this approach is illustrated in Fig. 4. Here, we compare currents from an individual ganglion cell to changes in Ca2+ concentration in surrounding cells. In isolation, retinal bipolar cells oscillate (Burrone and Lagnado, 1997; Ma and Pan, 2003). When inhibitory transmission is blocked in the intact retina, these oscillations result in large repetitive glutamatergic EPSCs in postsynaptic ganglion cells (Yee et al., 2012). Inhibitory activity was blocked by a combination of strychnine, gabazine, and TPMPA, as described previously (Yee et al., 2012). This also results in propagating ganglion cell activity, visualized by the calcium indicator OGB-1 AM (Fig. 4C). Cross-covariance analysis shows that these excitatory currents and increases in intracellular calcium activity in the region of the cell body are temporally correlated (r = 0.74; Fig. 4B, C). Frames extracted from the video and converted to heatmaps show similar increases in calcium concentration (ΔF/F) in surrounding cells (Fig. 4D). In our experiments, we used epifluorescent calcium imaging for brief periods of time (under 2 minutes of continuous illumination). To limit the damaging effect of fluorescent illumination on the tissue, its intensity was attenuated by 0.9–1.2 log units with neutral density filters placed in front of the 100W mercury lamp. For experiments that require prolonged illumination of the specimen, or for experiments that record calcium responses to stimuli within the visible light spectrum, it is more appropriate to use long-wave stimulation and two-photon confocal imaging with the corresponding cellular probes and image sensors.
Figure 4. Network activity assessment using calcium imaging in intact retina.
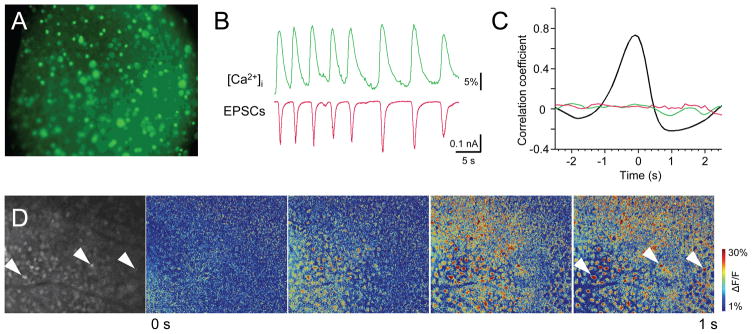
A. Fluorescence image showing loading of calcium indicator OGB-1-AM (green). B. Simultaneous calcium imaging (top) and whole-cell current traces (bottom) from a representative RGC. C. Cross-correlations of membrane oscillations relative to ΔF/F (black, n=21) and each relative to randomized data (green, ΔF/F vs. random; red, current vs. random). Note inverted Y-axis to reflect the opposite directions for correlated events – each increase in intracellular calcium (positive) coincides with an inward current (negative). D. A sequence of ΔF/F pseudo colored time-lapse images during 1 s of retinal activity viewed from the RGC side at P47. Selected cells are marked with arrowheads. Size of the retinal region in each panel is ~636×762 μm.
It can also be advantageous to show the relationship of physiology to the integrity of nearby blood vessels, for diseases where vascular integrity is a key indicator for overall health of the tissue. Here, we demonstrate the visualization of vascular structure with sulforhodamine (1 μM) added to bathing solution (Fig. 5A). As illustrated in Fig. 5B blood vessels are contiguous and form closed loops, and fine capillaries are easily distinguished within 5 minutes after treatment.
Figure 5. Simultaneous characterization of neurons and vasculature.

A. Confocal live imaging of a whole intact retina mounted on Millicell insert. In this sample, a subset of RGCs express yellow fluorescent protein (thy1-YFP, green) and retinal vasculature is stained with endothelial cell-specific marker added to perfusion media (SRH, red). B and C. Individual GC highlighted by an arrow with and without surrounding blood vessels. Scale bars 50 μm.
3.3 Tissue processing following fixation
To evaluate the influence of a conventional fixative and the mounting procedure on the morphological properties of neuronal tissue the recorded RGCs were first scanned in physiological solution using the 20x objective of a Nikon Eclipse Ti confocal microscope at 1.1 μm intervals (Fig. 6A). The retina was then fixed, mounted on a slide and re-scanned (Fig. 6B). The linear distance between two well recognizable structures, typically the diameter of the dendritic field of a cell, was measured on both photographs. We did not find any significant change in the horizontal linear dimensions between live and fixed cells (102 ± 4% of control, p = 0.11, paired t-test, n=12, 5 retinas; Fig. 6C).
Figure 6. Comparison of structural landmarks in living and fixed tissue mounted on a Biopore membrane.
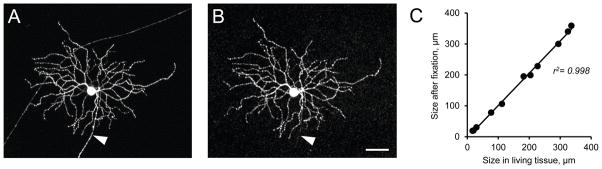
A and B. Confocal images of a representative RGC before and after fixation. Intrinsic fluorescence imaging in thy1-YFP mouse. No GFP antibodies were necessary to enhance the image following fixation. Axon is indicated by an arrowhead. Scale bar 50 mm. C. Correlation between RGC dendritic tree sizes and structural landmarks before and after fixation (n = 12 in 5 retinas).
Next we compared the live image of an RGC with surrounding blood vessels, revealed by sulforhodamine, with an image of the same cells after fixation and staining (Fig. 7). The sulforhodamine staining of blood vessels is washed away in fixed tissue during the staining procedure, therefore we relied on unspecific labeling of blood vessels produced by secondary anti-mouse antibodies coupled to Alexa 568 fluorescence label. Thus, the same blood vessels could be easily visualized in the fixed tissue. To assess the vertical dimensions of the retina after manipulation connected with the staining and mounting protocols, we performed a staining against ChAT, which is widely used to reveal two bands in the inner plexiform layer (IPL), which serve as landmarks in the retina. RGC stratification within the IPL relative to these bands corresponds to physiological type (Fig. 7A, right panel). In our preparation, Z-stack images of RGC dendrites and ChAT were taken with a 60x oil objective at 0.55 μm intervals. After that the vertical retinal images showing stratification of the cells relative to the cholinergic bands were produced in ImageJ program by 90 degree rotation of a thin sliver of the Z-stack image along its long axis (marked by dashed lines). The use of the supportive glass between the slide and the cover slip helps to preserve the natural thickness of the retina. Indeed, the quality of the preparation allows clear identification of the ChAT bands and the dendrites of the RGCs (Fig. 7B).
Figure 7. Imaging of neurons and vasculature in living and fixed tissue following patch-clamp recordings.

A and C. Projections of Z-stack confocal images with YFP-positive (A–B) and Alexa 568 hydrazide filled (C–D) RGCs were first taken in living whole mount retinal tissue (left panels). The blood vessels were stained with sulforhodamine (SRH). After fixation, the retinas were stained for ChAT and the blood vessels were labeled with donkey anti-mouse Alexa 568 antibodies (middle and right panels). B and D. The Z-stacks from the areas highlighted on A and C (right panels) rotated 90° along long sides; the IPL borders are marked by white lines. Scale bars 50 μm.
When a transgenic mouse with labeled GCs is not available, a WT animal can be used instead. A WT GC was filled with Alexa 568 (red fluorescence) during patch-clamp recording to visualize morphological features of the cell (Fig. 7C and D). In contrast to sulforhodamine, which washes out during fixation, Alexa 568 hydrazide can be fixed in the cell and remains visible after the staining procedure (Fig. 7C, middle panel). The dendrites of the GC stratified outside cholinergic bands, suggesting that this was an ON-OFF GC. Thus, staining for ChAT can be useful to confirm the physiological type of a cell and can be used in addition to electrophysiological recordings.
4. Discussion
This work describes a time and cost efficient method for comprehensive functional and structural analysis of neuronal tissue. The central and novel aspect of the proposed approach is that the intact tissue is mounted on a modified Millicell Biopore insert. Below we discuss the advantages of this approach and compare them to more conventional techniques.
4.1 Use of Millicell inserts for tissue support during physiological recordings
The Millicell Biopore inserts used in our protocol are particularly well suited to organotypic cell cultures. They utilize a unique hydrophilic membrane made of PTFE that is extremely biocompatible. Tissue specimens readily adhere to its surface without the addition of an extracellular matrix coating and remain viable and responsive to physiological stimuli for extended periods of time (Figs. 3 and 4). The porous structure of the membrane is advantageous due to its high permeability to nutrients, oxygen and pharmacological agents in the bathing solution. In our approach, the tissue specimen is evenly adhered to the membrane, eliminating pressure points and allowing the full access to the entire preparation. These issues have been hard to address in more conventional approaches in which parts of the tissue are obstructed by the material holding the tissue in place or where the tissue is pressed against the bottom of the recording chamber.
Carbon and cellulose filters have been used to maintain structural stability of brain slices and isolated intact tissue. However, their inability to transmit light had posed several limitations on use of conventional optics. To overcome this, retinal tissue in particular had to be cut into slices and flipped on their side for targeted recordings (Sagdullaev et al., 2006). In contrast, when in physiological solution, the Biopore membrane retains nearly full optical clarity, allowing for easy observation and manipulation with common transmitted light microscope techniques. This is particularly important when recording long-ranging network interactions and/or population imaging is the primary goal of the experiment. The presence of vitreous often obstructs the access to neuronal cells in the intact tissue. Enzymatic treatments have been widely used to reduce the presence of the vitreous to ease access. In our case, however, we found no need for this step as access to retinal ganglion cells was easily gained following gentle removal of the inner limiting membrane with a glass electrode. This can only be achieved when the retina is fully immobilized and does not move together with the glass electrode.
4.2 Use of Millicell inserts for tissue support for imaging of living and fixed neuronal tissue
Once mounted on a modified Biopore insert living neuronal tissue could be readily transferred across multiple experimental setups for an array of structural and physiological assessments. This is illustrated by the experimental approach routinely used in our laboratory (Fig. 2). In particular, following multifaceted functional and structural analysis that includes but not limited to patch-clamp recordings (Fig. 3), calcium imaging (Fig. 4) and vasculature assessment (Fig. 5), the same tissue could be fixed and immunostained while being attached to the insert membrane (Fig. 6). The insert fits easily into a 24-well plate. The tissue remains flat and easily accessible for the antibody penetration. As little as 100 μL of the incubation solution is required, which allows for lower amount of antibodies to be used. The tissue can be easily washed between the incubation steps, precluding the possibility of losing the very small and transparent pieces during the pipetting procedure. Finally, the use of the filter allows easy mounting of the tissue on a slide without any additional need to unfold the tissue with forceps. The filter with the tissue should be cut out of the plastic ring with small scissors prior to mounting. Once in a Vectashield mounting medium, the filter becomes non-transparent. This non transparency will not affect epifluorescence measurements but may prevent any microscopy techniques requiring transmitted light. We find this method to be especially relevant when handling fragile intact tissues such as retina and brain slices that tend to fall apart easily once the connective tissue around them is disrupted during dissection. Alternatively, the same brain tissue can then be easily detached from the membrane, fixed and undergo conventional immunohistochemical treatment (Fig. 7).
4.3 Concurrent visualization of neuronal cells and vasculature in living tissue
Although it is common for staining to be performed after tissue fixation, simultaneous visualization of the cell and its surrounding structures (e.g. vasculature, glial cells) in living tissue is beneficial, as further manipulation of the tissue can risk damage, and certain features cannot be observed in fixed tissue. By infusing a specific fluorophore (sulforhodamine, Alexa Fluors, Lucifer yellow), or by using transgenic animals with genetic markers, cells can be immediately visualized (Feng et al., 2000). Additionally, the relationship of the recorded cell to its neighbors can be shown using a nuclear stains such as ethidium bromide, TO-PRO (Yee et al. 2012), acridine orange (Zhang et al., 2005), Azure B (Hu et al., 2000). Antibodies recognizing an extracellular epitope may also be applied (Ivanova et al., 2006). Vascular damage and/or abnormal angiogenesis occurs in diabetic retinopathy, age-related macular degeneration, and tumors. Additionally, it has been shown in diseases such as retinal angiomatous proliferation and macular telangiectasia that, even without large-scale leakage or hemorrhage, abnormal neovascularization is associated with local neuronal dysfunction (Dorrell et al., 2009). Existing techniques for vasculature characterization rely on multi-step procedures that can take days to complete. In contrast, our approach, in which small amount of endothelial cell-binding fluorescent dye sulforhodamine (~1 μM) is added to perfusing solution, provides an easy and fast way to visualize vascular structure in living tissue within minutes (Fig. 5B).
Highlights.
The described technique allows for an affordable and fast comprehensive physiological, anatomical, and immunological characterization of living neuronal tissue.
Intact tissue is placed on a modified Millicell Biopore insert, which reduces physical damage to the tissue, maintains its structural integrity, and allows easy transfer across multiple setups.
The approach uses affordable alternatives to common techniques to achieve the same results.
Acknowledgments
This work was supported by NIH grant R01-EY020535 (B.T.S), International Retinal Research Foundation and Karl Kirchgessner Foundation (B.T.S).
Footnotes
Publisher's Disclaimer: This is a PDF file of an unedited manuscript that has been accepted for publication. As a service to our customers we are providing this early version of the manuscript. The manuscript will undergo copyediting, typesetting, and review of the resulting proof before it is published in its final citable form. Please note that during the production process errors may be discovered which could affect the content, and all legal disclaimers that apply to the journal pertain.
References
- Charvet G, Rousseau L, Billoint O, Gharbi S, Rostaing JP, Joucla S, Trevisiol M, Bourgerette A, Chauvet P, Moulin C, Goy F, Mercier B, Colin M, Spirkovitch S, Fanet H, Meyrand P, Guillemaud R, Yvert B. BioMEA: a versatile high-density 3D microelectrode array system using integrated electronics. Biosens Bioelectron. 2010;25:1889–96. doi: 10.1016/j.bios.2010.01.001. [DOI] [PubMed] [Google Scholar]
- Dorrell MI, Aguilar E, Jacobson R, Yanes O, Gariano R, Heckenlively J, Banin E, Ramirez GA, Gasmi M, Bird A, Siuzdak G, Friedlander M. Antioxidant or neurotrophic factor treatment preserves function in a mouse model of neovascularization-associated oxidative stress. J Clin Invest. 2009;119:611–23. doi: 10.1172/JCI35977. [DOI] [PMC free article] [PubMed] [Google Scholar]
- Falsig J, Julius C, Margalith I, Schwarz P, Heppner FL, Aguzzi A. A versatile prion replication assay in organotypic brain slices. Nat Neurosci. 2008;11:109–17. doi: 10.1038/nn2028. [DOI] [PMC free article] [PubMed] [Google Scholar]
- Feng G, Mellor RH, Bernstein M, Keller-Peck C, Nguyen QT, Wallace M, Nerbonne JM, Lichtman JW, Sanes JR. Imaging neuronal subsets in transgenic mice expressing multiple spectral variants of GFP. Neuron. 2000;28(1):41–51. doi: 10.1016/s0896-6273(00)00084-2. [DOI] [PubMed] [Google Scholar]
- Hamill OP, Marty A, Neher E, Sakmann B, Sigworth FJ. Improved patch-clamp techniques for high-resolution current recording from cells and cell-free membrane patches. Pflugers Arch. 1981;391:85–100. doi: 10.1007/BF00656997. [DOI] [PubMed] [Google Scholar]
- Haverkamp S, Inta D, Monyer H, Wassle H. Expression analysis of green fluorescent protein in retinal neurons of four transgenic mouse lines. Neuroscience. 2009;160:126–39. doi: 10.1016/j.neuroscience.2009.01.081. [DOI] [PubMed] [Google Scholar]
- Hu EH, Dacheux RF, Bloomfield SA. A flattened retina-eyecup preparation suitable for electrophysiological studies of neurons visualized with trans-scleral infrared illumination. J Neurosci Methods. 2000;103:209–16. doi: 10.1016/s0165-0270(00)00319-8. [DOI] [PubMed] [Google Scholar]
- Ivanova E, Muller U, Wassle H. Characterization of the glycinergic input to bipolar cells of the mouse retina. Eur J Neuroscience. 2006;23:350–364. doi: 10.1111/j.1460-9568.2005.04557.x. [DOI] [PubMed] [Google Scholar]
- Lohmann C, Myhr KL, Wong RO. Transmitter-evoked local calcium release stabilizes developing dendrites. Nature. 2002;418:177–81. doi: 10.1038/nature00850. [DOI] [PubMed] [Google Scholar]
- Meister M, Pine J, Baylor DA. Multi-neuronal signals from the retina: acquisition and analysis. J Neurosci Methods. 1994;51:95–106. doi: 10.1016/0165-0270(94)90030-2. [DOI] [PubMed] [Google Scholar]
- Newman EA, Bartosch R. An eyecup preparation for the rat and mouse. J Neurosci Methods. 1999;93:169–75. doi: 10.1016/s0165-0270(99)00138-7. [DOI] [PubMed] [Google Scholar]
- Nicolelis MA, Ghazanfar AA, Faggin BM, Votaw S, Oliveira LM. Reconstructing the engram: simultaneous, multisite, many single neuron recordings. Neuron. 1997;18:529–37. doi: 10.1016/s0896-6273(00)80295-0. [DOI] [PubMed] [Google Scholar]
- Sagdullaev BT, McCall MA, Lukasiewicz PD. Presynaptic inhibition modulates spillover, creating distinct dynamic response ranges of sensory output. Neuron. 2006;15: 50(6):923–35. doi: 10.1016/j.neuron.2006.05.015. [DOI] [PubMed] [Google Scholar]
- Sagdullaev BT, Eggers ED, Purgert R, Lukasiewicz PD. Nonlinear interactions between excitatory and inhibitory retinal synapses control visual output. J Neurosci. 2011;31:15102–12. doi: 10.1523/JNEUROSCI.1801-11.2011. [DOI] [PMC free article] [PubMed] [Google Scholar]
- Stosiek C, Garaschuk O, Holthoff K, Konnerth A. In vivo two-photon calcium imaging of neuronal networks. Proc Natl Acad Sci U S A. 2003;100:7319–24. doi: 10.1073/pnas.1232232100. [DOI] [PMC free article] [PubMed] [Google Scholar]
- Sawamiphak S, Seidel S, Essmann CL, Wilkinson GA, Pitulescu ME, Acker T, Acker-Palmer A. Ephrin-B2 regulates VEGFR2 function in developmental and tumour angiogenesis. Nature. 2010;465:487–91. doi: 10.1038/nature08995. [DOI] [PubMed] [Google Scholar]
- Tsien RY. A non-disruptive technique for loading calcium buffers and indicators into cells. Nature. 1981;290:527–8. doi: 10.1038/290527a0. [DOI] [PubMed] [Google Scholar]
- Wang JS, Estevez ME, Cornwall MC, Kefalov VJ. Intra-retinal visual cycle required for rapid and complete cone dark adaptation. Nat Neurosci. 2009;12:295–302. doi: 10.1038/nn.2258. [DOI] [PMC free article] [PubMed] [Google Scholar]
- Wei W, Elstrott J, Feller MB. Two-photon targeted recording of GFP-expressing neurons for light responses and live-cell imaging in the mouse retina. Nat Protoc. 2010;5:1347–52. doi: 10.1038/nprot.2010.106. [DOI] [PMC free article] [PubMed] [Google Scholar]
- Wong RO, Oakley DM. Changing patterns of spontaneous bursting activity of on and off retinal ganglion cells during development. Neuron. 1996;16:1087–95. doi: 10.1016/s0896-6273(00)80135-x. [DOI] [PubMed] [Google Scholar]
- Yaksi E, Friedrich RW. Reconstruction of firing rate changes across neuronal populations by temporally deconvolved Ca2+ imaging. Nat Methods. 2006;3:377–83. doi: 10.1038/nmeth874. [DOI] [PubMed] [Google Scholar]
- Yee CW, Toychiev AH, Sagdullaev BT. Network deficiency exacerbates impairment in a mouse model of retinal degeneration. Front Syst Neurosci. 2012;6:8. doi: 10.3389/fnsys.2012.00008. [DOI] [PMC free article] [PubMed] [Google Scholar]
- Zhang J, Li W, Hoshi H, Mills SL, Massey SC. Stratification of alpha ganglion cells and ON/OFF directionally selective ganglion cells in the rabbit retina. Vis Neurosci. 2005;22:535–49. doi: 10.1017/S0952523805224148. [DOI] [PMC free article] [PubMed] [Google Scholar]