

Abstract
Objective
We examined resting state functional connectivity in the brain between key emotion regulation regions in bipolar I disorder to delineate differences in coupling from healthy subjects.
Methods
Euthymic subjects with bipolar I disorder (n = 20) and matched healthy subjects (n = 20) participated in a resting state functional magnetic resonance imaging scan. Low frequency fluctuations in blood oxygen level-dependent (BOLD) signal were correlated in the six connections between four anatomically-defined nodes: left and right amygdala and left and right ventrolateral prefrontal cortex (vlPFC). Seed-to-voxel connectivity results were probed for commonly coupled regions. Following this, an identified region was included in a mediation analysis to determine the potential of mediation.
Results
The bipolar I disorder group exhibited significant hyperconnectivity between right amygdala and right vlPFC relative to healthy subjects. The connectivity between these regions in the bipolar I disorder group was partially mediated by activity in the anterior cingulate cortex (ACC).
Conclusions
Greater coupling between right amygdala and right vlPFC and their partial mediation by the ACC were found in bipolar I disorder subjects in remission and in the absence of a psychological task. These findings have implications for a trait-related and clinically-important imaging biomarker.
Keywords: amygdala, bipolar disorder, euthymia, functional connectivity, resting state, ventrolateral prefrontal cortex
Bipolar disorder is a serious psychiatric illness thought to involve deficits in the neural substrates for emotion regulation because of its characteristic profile of lifetime depressed and manic mood episodes (1, 2). Neuroimaging research in healthy subjects has revealed a number of brain areas involved in emotional regulation, including subcortical (e.g., amygdala) and ventrolateral prefrontal cortical (vlPFC) regions (3, 4). Research in both humans and primates has additionally demonstrated strong anatomical projections between these areas, forming the substrate for which functional coupling (connectivity) is possible (5, 6). The amygdala, for example, is functionally responsive to emotional stimuli, while the vlPFC is instrumental in the regulation of that response. In healthy subjects, during down-regulation of emotion, the functional connectivity between these areas has been observed to increase (7, 8).
The above-referenced functional magnetic resonance imaging (fMRI) studies of emotion regulation involve observation of brain activity while subjects perform a task. Recent studies that have evaluated subjects while not performing any cognitive tasks–e.g., resting state studies–have also revealed intrinsic activation patterns in the brain. Resting state fMRI provides complementary information to task-based fMRI in that both provide a platform for examining functional brain networks. Spatially distributed large-scale brain networks can be reliably derived and interrogated by either kind of fMRI experiment (9–11) and one could argue that both contribute different dimensions to a full characterization of brain activity. A variety of methods have been used to analyze such data (12) and have been applied to diverse clinical populations in the effort to delineate disease-related dysfunctions in connectivity (13).
While there are a handful of studies that have investigated functional connectivity in bipolar disorder, few are resting state studies (Table 1). Of these, there is some overlap with the regions used as seeds, such as the medial prefrontal cortex (14, 15) or amygdala (16, 17) but the findings show differences in connectivity in lateralization (left or right hemisphere), sign (positive or negative coupling), and between-group differences (healthy subjects > bipolar disorder or bipolar disorder > healthy subjects). Three of these studies investigated bipolar mania and/or depression (14, 15, 17); however, one combined several mood states into its bipolar disorder sample (16) while another combined bipolar I and II disorder subjects (14). This latter issue is particularly problematic as there is evidence to suggest that patterns of activation and connectivity change with different mood state and subtype of bipolar disorder (17–19). For a clearer picture of the underlying pathophysiology of bipolar disorder, further research that investigates common regions in both hemispheres in single mood states and in single bipolar disorder subtypes is necessary.
Table 1.
A selection of functional magnetic resonance imaging (fMRI)connectivity studies in bipolar disorder
| Study | Task/rest | BP moodstate | Method | Seed/ROI | BP > HS | HS > BP |
|---|---|---|---|---|---|---|
| Foland-Rosset al. 2008 (29) | Labeling emotional faces | Manic | PPI | L AMYG | Negative FC: ACC (BA32 and 24) and BA10 | Negative FC: LH amygdala—bilateral vlPFC |
| Pompeiet al. 2011 (40) | Color-word Stroop | Euthymic | PPI | RvlPFC | Positive FC: RH vlPFC—insula | Negative FC: RH vlPFC—LH vACC |
| Townsendet al. 2012 (30) | Explicit emotion regulation | Euthymic | PPI | LAMYG | Negative FC: L AMYG—L vlPFC | |
| Versaceet al. 2010 (39) | Labeling sad and happy faces | Depressed and euthymic | Seed-based FC | omPFC (BA 11) and AMYG | Sad: RH AMYG—vmOFC | Happy: LH AMYG—vmOFC |
| Anandet al. 2009 (14) | Rest | Manic and depressed | Seed-based FC | pgACC | LH and RH pgACC—dmTHAL, AMYG, and striatum | |
| Chaiet al. 2011 (15) | Rest | Manic | Seed-based FC | mPFC, AMYG, dlPFC, insula, vlPFC | mPFC—LH insula mPFC—RH BA47 | |
| Chepeniket al. 2010 (16) | Rest | Rapid cyclers, euthymic, depressed, and mixed | Seed-based FC | vlPFC, AMYG | LH vPFC—RH vPFC | Negative FC: LH AMYG—vPFC |
| Cerullo et al. 2012 (17) | Steady state | Manic and depressed (longitudinal) | Seed-based FC | L and RAMYG | N/A | N/A |
BP = bipolar disorder; ROI = region of interest; HS = healthy subjects; PPI = psychophysiological interaction; FC = functional connectivity; L = left; R = right; AMYG = amygdala; PFC = prefrontal cortex: vlPFC = ventrolateral PFC; omPFC = orbitomedial PFC; BA = Brodmann’s Area; pgACC = pregenual ACC; mPFC = medial PFC; dlPFC = dorsolateral PFC; ACC = anterior cingulate cortex; RH = right hemisphere; LH = left hemisphere; — = correlation (coupling); vACC = ventral ACC; vmOFC = ventromedial orbitofrontal cortex; vPFC = ventral PFC; dmTHAL = dorsomedial thalamus; N/A = these direct contrasts were not performed.
The goal of the present resting state study was to elucidate differences in intrinsic functional connectivity that might contribute to mood lability in bipolar I disorder. We therefore took a focused approach to assessing connectivity in two bilateral brain regions strongly implicated in emotion regulation (four regions in total: right and left amygdalae and right and left vlPFC) in a group of euthymic bipolar I disorder subjects. We hypothesized that subjects with bipolar I disorder would demonstrate aberrant functional connectivity relative to healthy subjects between amygdalae and lateral vlPFC–regions that subserve emotion regulation. Furthermore, observed alterations of brain connectivity during the euthymic state may be considered a potential biomarker of trait aspects of the disease.
Methods and materials
Participants
Participants provided written informed consent in accordance with the Institutional Review Boards at the University of California, Los Angeles (UCLA) and the Veterans Affairs (VA) Greater Los Angeles Healthcare System. Subjects with bipolar I disorder were recruited through the outpatient UCLA Mood Disorders Clinic, the outpatient Bipolar Disorders Clinic of the VA Greater Los Angeles Health Care System, and through local advertising in the community. Healthy subjects were recruited by advertisements in local newspapers and campus fliers. All participants were first interviewed using the Structured Clinical Interview (SCID) (20) for DSM-IV to confirm a bipolar I disorder diagnosis or absence thereof. Participants with bipolar I disorder were excluded if they met criteria for any other current Axis I disorder. Healthy subjects were excluded if they had a current or past psychiatric diagnosis (including history of substance abuse) or were taking any medications for medical reasons. Additional exclusion criteria for all participants included left-handedness, neurological illness, metal implants, and a history of skull fracture or head trauma with loss of consciousness of more than five minutes.
In total, 21 bipolar I disorder subjects and 26 healthy subjects were scanned. Mood symptoms were evaluated in all participants on the day of the scan, using the Young Mania Rating Scale (YMRS) (21) and the 21-item Hamilton Depression Rating Scale (HDRS) (22) to assess for any symptoms of mania or depression. Participants were considered appropriate for this study if they had a YMRS score of < 7 (bipolar I disorder: 1.9 ± 1.9; healthy subjects: 0.74 ± 1.19, p = 0.03), a 21-item HDRS score of < 7 (bipolar I disorder: 3.55 ± 2.5; healthy subjects 0.79 ± 0.9, p < 0.001), and had been euthymic by self-report and by SCID for at least one month prior to scanning.
Following the removal of seven subjects due to excessive head motion, 20 bipolar I disorder subjects (10 female, age 42.1 ± 11.4 years) and 20 (10 female, 39.8 ± 12.6 years) age- (p = 0.55) and gender-matched (p = 1.0) healthy subjects were included in the final analysis. Based on their age at first episode, they had been ill an average of 22.7 ± 11 years and currently euthymic an average of 34.5 ± 38.9 weeks. Length of formal education was 14.1 ± 1.9 years for bipolar I disorder subjects and 15.6 ± 2.1 for healthy subjects. Employment rate was 10% for bipolar I disorder subjects and 95% for healthy subjects. Three (15%) of these bipolar I disorder subjects were unmedicated and had been off medications for ≥ two months. The remaining 17 subjects were receiving a number of different medications including antipsychotics (15%), antidepressants (75%), and anticonvulsants (valproic acid: 25%, lamotrigine: 20%).
Image acquisition
Subjects were scanned on a 3T Siemens Trio scanner. They were asked to rest with their eyes closed during the scan but to not fall asleep. A structural T1 MPRAGE was acquired with parameters of repetition time (TR) = 1.9 sec, echo time (TE) = 2.26 msec, flip angle = 9°, matrix = 256 × 256, field of view (FOV) = 250 mm, voxel size = 1 mm isotropic, and total sequence time 6 min and 50 sec. The resting state fMRI scan was acquired using a T2*-weighted echo planar imaging (EPI) gradient-echo pulse sequence with IPAT, with TR = 2 sec, TE = 25 msec, flip angle = 78°, matrix = 64 × 64, FOV = 192 mm, in-plane voxel size = 3 × 3 mm, slice thickness = 3 mm, 0.75 mm gap, and 30 total interleaved slices. To allow for scanner equilibration, two TRs at the beginning of the scan were discarded. The total sequence time was 7 min and 2 sec, with 208 volumes acquired.
fMRI analysis
Following slice-timing correction of functional volumes, we performed motion realignment, gray matter/white matter/cerebral spinal fluid structural segmentation, normalization of both structural and functional scans to Montreal Neurological Institute (MNI) space, 3 mm isotropic voxel re-slicing, and 6 mm full-width at half-maximum (FWHM) Gaussian smoothing. To perform the statistical analysis, we used the CONN-fMRI functional connectivity toolbox, version 12.p (www.nitrc.org/projects/conn) (23), built on SPM8 (www.fil.ion.ucl.ac.uk/spm/).
Head movement can be a serious confound with resting state studies because it can introduce spurious correlations across the brain (11, 24). We took several precautions to ensure that it would not be a factor in our results. First, at a gross level, subjects were excluded if they had translational movement greater than one voxel (3 mm). Second, we tested whether the maximum head motion values (three translation and three rotation) were different between groups and we found no differences (all p-values > 0.05). Third, for each subject we calculated two different combinations of the six motion parameters that indicated total displacement (TD) along the scan or framewise displacement (FD) (i.e., scan-to-scan). Both metrics took into account each subject’s individual head sizes to accurately assess the effects of rotation (25). We tested whether there were differences between groups for these metrics as well. TD did not differ between groups (bipolar I disorder: μ = 0.69 ± 0.3; healthy subjects: μ = 0.89 ± 0.5, p = 0.14) but FD did (bipolar I disorder: μ = 0.14 ± 0.07; healthy subjects: μ = 0.1 ± 0.04, p = 0.01). Therefore, subject-specific FD mean values were added as a separate covariate of non-interest during subsequent analysis and were found to exert no significant influence on the final reported results.
To account for movement and other noise confounds during the preprocessing of the functional images, and to avoid known issues with regressing out the global signal (26), the CONN-fMRI toolbox uses the anatomical component correction (aCompCor) method of flexibly removing physiological noise and movement confounds on a voxel-by-voxel basis (27, 28). The aCompCor approach enhances the sensitivity and specificity of positive correlations and can reveal non-artifactual anticorrelations. We used this method to regress out five principal components from the noise regions of interest (ROI) obtained from the anatomical segmentation as well as the six realignment parameters and their first temporal derivatives for each subject. The functional scans were further band-pass filtered between 0.01 and 0.1 Hz (100- to 10-sec cycles) to investigate low frequency correlations, which are most consistently produced within this range (11).
The CONN-fMRI toolbox implements a default set of (n = 88) Tailarach Daemon masks that may be augmented by additional ROIs. Thus, although the present study was mainly concerned with a focused set of connectivity pairings, the averaged time series from each of 88 cortical and two subcortical anatomical ROIs across the brain were extracted and bivariate Pearson correlations were calculated from each of these time courses at the voxel-level. The two additional subcortical ROIs added to the default Tailarach Daemon masks were the 75% probabilistic Harvard–Oxford’s left and right amygdalae (Harvard Center for Morphometric Analysis).
We performed an analysis among ROIs (ROI-to-ROI) by calculating statistics for all possible connections for a selected subset of ROIs [right and left amygdalae, right and left Brodmann’s Area (BA) 47]. This effectively performs a small volume correction on (Fischer-transformed) correlation values by setting the false discovery rate (FDR) correction to assure that only 5% or less of significant effects could be false positives. Results from this ROI-to-ROI analysis were then checked at the wholebrain level to confirm that they were not driven by a very small number of voxels (the ROI-to-ROI analysis works on the averaged time series of all voxels within the ROI). For this wholebrain (seed-to-voxel) analysis the amygdala was chosen as the seed region from the bi-directional right amygdala-vlPFC finding from the ROI-to-ROI analysis (see results below) to allow comparison with other studies that used the amygdala as a seed in connectivity analyses during rest (15, 16) and in studies of emotion regulation (8,29,30). The toolbox creates t-statistic volumes, which were brought into SPM8 for wholebrain investigations of within- and between-group maps. A voxel statistical height threshold of p < 0.001, k = 10 with a cluster height of p < 0.05 was used to identify significant correspondences between right amygdala wholebrain connectivity in the within- and between-group contrasts. These results were then tabulated (Table 3), with anatomical and Brodmann labels automatically determined by the Tailarach Client (www.talairach.org/client.html) after nonlinear coordinate conversion (www.bioimagesuite.org). These labels were then checked and revised against a probabilistic Anatomy toolbox (31) and an atlas in MNI space (32).
Table 3.
Within-and between-group maps of voxel-level functional connectivity from right amygdala in healthy and bipolar I disorder subjectsa
| Brodmann’s Area | Cluster size | Cluster p-value | Peak Z | MNI | |||
|---|---|---|---|---|---|---|---|
| x | y | z | |||||
| Healthy subjects right amygdala connectivity | |||||||
| Positive | |||||||
| R Amygdala | 2391 | 0.000 | Inf | 21 | −4 | −17 | |
| R Temporal pole | BA 38 | 0.000 | 45 | 23 | −26 | ||
| L Superior temporal gyrus | 0.000 | −54 | −16 | 7 | |||
| L Medial temporal pole | 0.000 | −33 | 8 | −32 | |||
| L Insula | 0.000 | −42 | 8 | −8 | |||
| R Parahippocampal gyrus | BA 36 | 0.000 | 39 | −19 | −32 | ||
| L Hippocampus | 0.000 | −27 | −22 | −17 | |||
| L Superior temporal gyrus | BA 13 | 0.000 | −45 | 5 | −14 | ||
| L Superior temporal gyrus | 0.000 | −39 | 2 | −20 | |||
| R Postcentral gyrus | BA 3 | 0.000 | 63 | −1 | 22 | ||
| R Superior temporal gyrus | BA 22 | 0.000 | 48 | −19 | 1 | ||
| L Middle temporal gyrus | BA22 | 12 | 0.027 | 4.56 | −66 | −55 | 10 |
| L Middle temporal gyrus | BA 39 | 10 | 0.041 | 3.51 | −60 | −64 | 10 |
| Anterior cingulate gyrus | 10 | 0.041 | 3.57 | 0 | 35 | 1 | |
| R Insula | BA 13 | 53 | 0.000 | 4.51 | 36 | −13 | 19 |
| R Thalamus | 16 | 0.013 | 3.66 | 3 | −10 | 7 | |
| Negative | |||||||
| L Middle frontal gyrus | BA 10 | 70 | 0.000 | 4.72 | −24 | 47 | 25 |
| L Inferior parietal lobule | BA 40 | 33 | 0.001 | 4.6 | −48 | −52 | 40 |
| L Precuneus | BA 7 | 14 | 0.019 | 4.07 | −9 | −64 | 49 |
| L Superior parietal lobule | BA 7 | 29 | 0.002 | 3.85 | −39 | −49 | 61 |
| L Middle orbital gyrus | 16 | 0.013 | 3.5 | −42 | 56 | −11 | |
| R Precuneus | BA 7 | 18 | 0.009 | 4.28 | 6 | −70 | 58 |
| R Middle frontal gyrus | 18 | 0.009 | 3.84 | 33 | 50 | 13 | |
| Bipolar euthymic right amygdala connectivity | |||||||
| Positive | |||||||
| R Amygdala | 2020 | 0.000 | Inf | 27 | −4 | −20 | |
| R Inferior temporal gyrus | 5.2 | 51 | −55 | −17 | |||
| R Hippocampus | 5.18 | 33 | −13 | −35 | |||
| R Parahippocampal gyrus | 5.14 | 24 | −25 | −14 | |||
| R Inferior frontal gyrus | BA 45 | 5.04 | 54 | 32 | 10 | ||
| R Ventrolateral prefrontal cortex | BA 45 | 4.93 | 45 | 35 | −2 | ||
| R Fusiform gyrus | BA 36 | 4.8 | 24 | −40 | −17 | ||
| R Middle temporal gyrus | 4.77 | 60 | −7 | −14 | |||
| R Inferior frontal gyrus | BA 47 | 4.66 | 48 | 38 | −5 | ||
| R Temporal pole | BA 38 | 4.3 | 42 | 20 | −38 | ||
| R Thalamus (somatosensory) | 4.18 | 21 | −19 | 4 | |||
| R Superior temporal gyrus | BA 41 | 67 | 0.000 | 4.58 | 66 | −22 | 4 |
| R Posterior insula | BA 13 | 58 | 0.000 | 4.33 | 42 | −28 | 22 |
| R Angular gyrus | BA 39 | 32 | 0.001 | 4.2 | 54 | −67 | 34 |
| R Posterior cingulate | BA 30 | 32 | 0.001 | 4.12 | 15 | −58 | 7 |
| R Insula | BA 13 | 17 | 0.011 | 4.08 | 39 | 5 | 10 |
| R Superior temporal gyrus | 95 | 0.000 | 4.03 | 54 | −46 | 19 | |
| R Middle frontal gyrus | BA 11 | 42 | 0.000 | 4.01 | 18 | 29 | −14 |
| R Precuneus | BA 19 | 13 | 0.022 | 3.99 | 36 | −85 | 37 |
| R Precentral gyrus | BA 6 | 15 | 0.015 | 3.99 | 51 | 2 | 37 |
| R Precentral gyrus | BA 6 | 14 | 0.018 | 3.84 | 54 | −7 | 31 |
| R Middle occipital gyrus | 16 | 0.013 | 3.81 | 36 | −73 | 25 | |
| R Middle frontal gyrus | 12 | 0.027 | 3.66 | 45 | 20 | 28 | |
| R Inferior temporal gyrus | 10 | 0.041 | 3.65 | 45 | −70 | −5 | |
| L fusiform gyrus | BA 37 | 40 | 0.000 | 4.22 | −42 | −49 | −26 |
| L Middle occipital gyrus | BA 19 | 29 | 0.002 | 4.2 | −42 | −85 | 25 |
| L Rolandic operculum | 13 | 0.022 | 4.03 | −51 | −4 | 7 | |
| L Inferior frontal gyrus | 36 | 0.001 | 3.82 | −30 | 35 | −8 | |
| L Posterior cingulate | 11 | 0.033 | 3.64 | −18 | −64 | 13 | |
| L Medial frontal gyrus | BA 10 | 10 | 0.041 | 3.59 | −6 | 62 | 16 |
| Cingulate gyrus | BA 24 | 50 | 0.000 | 5.29 | 0 | 2 | 34 |
| BP > HS right amygdala connectivity | |||||||
| Positive | |||||||
| L Middle frontal gyrus | BA 10 | 16 | 0.021 | 3.5 | −30 | 62 | 13 |
| R Middle frontal gyrus | BA 9 | 14 | 0.029 | 4.3 | 45 | 20 | 40 |
| R Inferior temporal gyrus | BA 20 | 11 | 0.049 | 3.58 | 33 | −4 | −47 |
| R Ventral lateral prefrontal cortex | BA 47 | 11 | 0.049 | 3.52 | 51 | 41 | −8 |
MNI = Montreal Neurological Institute; R = right; L = left; BP = bipolar disorder; HS = healthy subjects.
There were no significant negative connectivity results with bipolar I disorder subjects. Rows in gray represent subclusters within a large cluster. Within-and between-group maps thresholded at p < 0.001, k = 10.
For confidence that findings in the tested model were not simply a reflection of global differences between the bipolar I disorder and healthy subject groups, we ran additional analyses between brain areas in which we did not expect to observe connectivity differences between groups. Specifically, we tested correlations of a number of primary sensory areas with the rest of the brain and compared groups.
Post-hoc associations between correlation values of right amygdala-vlPFC functional connectivity and patient course of illness variables (illness duration, number of depressive and manic episodes) and clinical variables (HDRS and YMRS scores) were assessed through correlations and two-tailed t-tests with right amygdala to right vlPFC beta values. These beta values were extracted from each bipolar I disorder subject’s individual ROI correlation matrices. Prior to conducting these correlational analyses, an outlier correction was applied in which outlying connectivity parameter estimate values were winsorized to a value of 2.5 standard deviations from the group mean as in recent fMRI work (33). These correlations were performed in PASW version 18.0 (SPSS Inc; Chicago, IL, USA).
To explore regions outside our a priori model that may have driven our within-group bipolar functional connectivity results, a connectivity conjunction map of two different statistical maps was performed–the map of whole brain correlations with the right amygdala and the map of wholebrain correlations with right vlPFC–using the toolbox xjView (www.alivelearn.net/xjview8/). Strong correlations common to both connectivity maps outside our ROIs were identified by conjunction (i.e., a logical AND), with each map individually set at p < 0.0001, k = 10. A third brain region was identified in this manner and was included in a group-level mediation analysis, along with the amygdala and vlPFC nodes, to determine whether that region was responsible for a full or partial mediating effect on the main results. The mean times series from the third region were extracted from each of the bipolar I disorder subjects–preprocessed and filtered as the other ROIs–and were included as the mediator in a mixed-effects group-level mediation analysis. Regressions for the mediation analysis were performed in four steps (34) using the all-in-one model described by Beckmann and colleagues (35) which retains the variance of each subject throughout.
Results
Figure 1 (left image) shows the main ROI (ROI-to-ROI) model investigated, with the six labeled functional correlations between the four a priori nodes (left and right amygdalae and left and right vlPFC). Figure 1 (right image) shows the between group ROI-to-ROI positive connectivity result in graphical form. Only the connection ‘IV’ (right amygdala with right vlPFC) survived FDR-multiple comparison correction [t(38) = 3.07, FDR p = 0.024]. Adding head movement measurements TD and FD as covariates of non-interest left this result virtually unchanged [TD: t(37) = 2.93, FDR p = 0.035; FD: t(37) = 2.74, FDR p = 0.028]. Table 2 lists the within- and between-group results for this ROI-to-ROI analysis. The strength of within-group connectivity between all nodes survived FDR correction in both groups with the exception of weaker ‘V’ (right amygdala with left vlPFC) and ‘VI’ (left amygdala with right vlPFC) connections in healthy subjects (p < 0.05, FDR corrected). There were no wholebrain connectivity differences between bipolar disorder subjects and healthy subjects in primary somatosensory (BA 1), auditory (BA 41, 42), or visual (BA 17) regions.
Fig. 1.
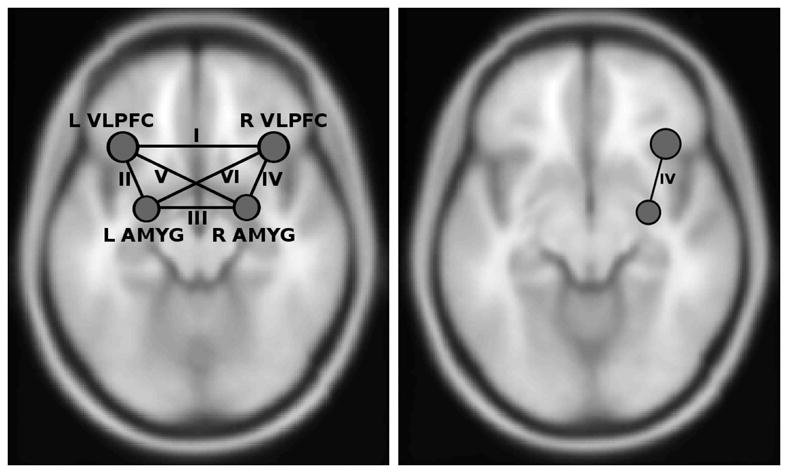
The four node (six correlation) connectivity model that was tested (left image). Node locations at center of mass of anatomical regions of interest. Results of greater positive connectivity between right amygdala (AMYG) and right ventrolateral prefrontal cortex (vlPFC) in bipolar I disorder subjects relative to healthy subjects (right image). L = left; R = right.
Table 2.
Within-and between-group ROI-to-ROI analysis results with connections labeled as in Figure 1 (left image)
| Healthy subjects | Bipolareuthymic | BP>HS | |||||||||||
|---|---|---|---|---|---|---|---|---|---|---|---|---|---|
| Connection | I | II | III | IV | V | VI | I | II | III | IV | V | VI | IV |
| Betasa | 0.52 | 0.11 | 0.31 | 0.07 | 0.04 | 0.04 | 0.51 | 0.12 | 0.26 | 0.2 | 0.14 | 0.1 | 0.12 |
| t-scores | 10.74 | 3.19 | 6.76 | 2.71 | 1.67 | 1.08 | 11.81 | 4.28 | 5.71 | 6.89 | 3.89 | 3.66 | 3.07 |
| Z-scores | 7.24 | 2.98 | 5.44 | 2.58 | 1.63 | 1.07 | 7.61 | 3.84 | 4.82 | 5.52 | 3.55 | 3.37 | 2.88 |
| FDR p-values | 0.0000 | 0.0096 | 0.0000 | 0.0207 | 0.1335 | 0.2947 | 0.0000 | 0.0006 | 0.0000 | 0.0000 | 0.0012 | 0.0017 | 0.0237 |
ROI = region of interest; BP = bipolar disorder; HS = healthy subjects; FDR = false discovery rate.
Fisher-transformed correlation coefficients.
Align values by the decimal point.
As stated, wholebrain connectivity from the right amygdala seed was also assessed to confirm that the ROI-to-ROI results were not driven by a very small number of voxels, as is possible when averaged time series are extracted from an anatomical mask. Figure 2 (top and middle rows) shows within-group axial slices, while Figure 2 (bottom row) shows the between group contrast [circled cluster size =11 voxels, cluster p < 0.05; peak at MNI: (x = 51, y = 41, z = −8), p < 0.0001, Z = 3.52]. Consistent with the ROI-to-ROI result our between-group results (bipolar disorder > healthy subjects) confirmed significant hyperconnectivity between the right amygdala and right vlPFC, but also revealed significant regional hyperactivity between a number of other regions such as the right and left medial frontal gyri (BAs 10 and 11, respectively), the right superior temporal gyrus (BA 41), and the precentral gyrus (BA 6). Table 3 lists these within- and between-group right-amygdala-to-wholebrain connectivity results.
Fig. 2.

Positive connectivity with right amygdala. (Top row) and (middle row): within-group maps for healthy subjects (HS) and bipolar I disorder subjects (BP). (Bottom row): between group contrast. Right ventrolateral prefrontal cortex (vlPFC) cluster circled. Voxels visualized on an average T1-weighted brain in Montreal Neurological Institute (MNI) space, p < 0.001, k = 10.
We found no significant correlations between right amygdala with right vlPFC connectivity and any of the five illness or clinical variables collected (illness duration, number of depressions, number of manias, and HDRS and YMRS scores). We also checked for medication effects on connectivity parameter estimates to make sure our few unmedicated bipolar I disorder subjects were not actually outliers driving our results.
Finally, we conducted a post-hoc test for possible third regions outside our model that may have driven, through mutual coupling, our right amygdala with right vlPFC result in the bipolar I disorder subjects. A significant cluster in the anterior cingulate cortex (ACC) [BA 32, center of gravity (x = 1.9, y = 44, z = 0.63)] was found to be strongly and positively functionally connected to both the right amygdala and the right vlPFC using the connectivity conjunction map procedure (Fig. 3A). We constructed our mediation model with the ACC mediating the influence of vlPFC to amygdala, which is what we hypothesized based on previous regression-based connectivity analyses of these regions (8, 29). A diagram and group-level betas for the analysis are shown in Figure 3B. We found the ACC to partially mediate the influence of vlPFC on the amygdala and this mediation effect was significant with the Sobel test (Z = 7.88).
Fig. 3.
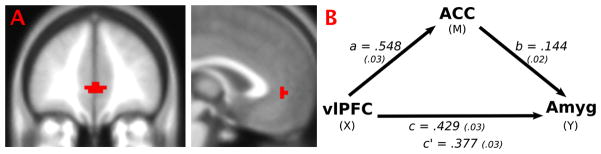
(A) Connectivity conjunction map shows a cluster in the anterior cingulate cortex (ACC) (BA 32) that is strongly positively functionally connected to both the right amygdala (Amyg) and right ventrolateral prefrontal cortex (vlPFC) regions in bipolar I disorder subjects. (B) Group-level analysis of ACC mediating vlPFC to Amyg. Path coefficients labeled with traditional mediation nomenclature and standard errors in parentheses. All paths were significant (p < 0.0001), indicating partial mediation of vlPFC to Amyg by ACC.
Discussion
Bipolar disorder is associated with a trait dysregulation of the corticolimbic network (1, 2), which may in turn result in fluctuations of mood states over time. Here, we investigated the corticolimbic network using a focused, seed-based correlation analysis of resting state data in one mood state of one subtype of bipolar disorder. Our results demonstrate an altered intrinsic connectivity in euthymic bipolar I disorder subjects compared to healthy subjects between brain regions vital for emotion regulation. Specifically, we observed hyperconnectivity of the right hemisphere vlPFC (BA 47) and right amygdala in bipolar I disorder and its partial mediation by the ACC. Here hyperconnectivity refers to greater positive correlations in low-frequency fMRI signal in one group than a reference group (36), which in this case are healthy subjects. Our within-group maps clearly support this difference in magnitude; subjects with bipolar I disorder have greater positive connectivity between these two regions in comparison to healthy subjects (Fig. 2 top and middle rows). Additionally, in subjects with bipolar I disorder, we found this resting hyperconnectivity elsewhere in the brain between amygdala and, for example, the ACC and the middle frontal gyrus (BAs 10 and 11) (see also Table 3).
One interpretation of our hyperconnectivity result is that functional coupling between vlPFC and may be especially sensitized in bipolar disorder and that this may contribute to or reflect the characteristic mood lability of the disease. Whether this sensitization stems from differences in right hemisphere white matter structural connections is unclear and warrants further research (37). The lateralization of differences of brain coupling in bipolar disorder also warrants further exploration and replication in general, however what we report here is consistent with prior neuroimaging research documenting right lateralization for emotion-processing effects (38).
The present findings are also consistent with four other studies in bipolar disorder subjects that have shown increases in seed-based connectivity between or involving at least one of these regions. For example, hyperconnectivity, as measured by mutual information, has been observed in bipolar disorder between ventromedial PFC and right amygdala while labeling sad facial expressions (39). During a psychophysiological interaction, hyperconnectivity was observed in bipolar disorder subjects between right vlPFC and insula (40), and during rest hyperconnectivity was observed during mania between medial and vlPFC (15) as well as between left and right ventral PFC in a variety of mood states (16) (c.f. Table 1.)
We also found that an area of the ACC (BA 32) was significantly coupled with both right amygdala and right vlPFC. The ACC is known to have anatomical and functionally reciprocal connections with the amygdala (41, 42), has been strongly implicated in mood disorders (6), and has been found by one group to mediate the coupling between right vlPFC and amygdala during incidental emotion regulation (3). The functional connectivity between this region and the amygdala has been found by another group to be decreased in bipolar disorder relative to healthy subjects during the processing of fearful and happy faces (43). Therefore, another way we could interpret our results is that the ACC in bipolar I disorder is dysfunctionally mediating the relationship of the vlPFC and amygdala to determine the hyperconnectivity we observed. It is interesting that Chai et al (15) also found hyperconnectivity during rest between the vlPFC and this area in manic bipolar disorder subjects; however, not between this area and the amygdala, as we did. This suggests this connection could be dependent on mood state, and other research that shows the coupling between ACC and amygdala tracking with anxiety (44) supports this. Further investigation is necessary to elucidate the resting effective connections of the ACC.
There are several limitations to the current study. First, the volumes of the anatomical ROIs we used for this seed-based functional connectivity analysis, especially the vlPFC, were based on an atlas and as such will contain certain errors. If, for example, the time-series extracted from an atlas-derived brain region averages over both gray and non-gray matter signals, the resulting series will not properly represent that region’s activation, which can result in unreliable measures. However, the aCompCor algorithm, which incorporates a high-resolution, subject-specific anatomic segmentation into its noise reduction procedure, takes such variability into account and attempts to compensate by higher weighting of gray matter voxels, thereby minimizing the effect of this issue [Nieto Castañón, personal communication; (also see 28)]. Nonetheless, there is likely some degree of functional heterogeneity within both the vlPFC and amygdala atlas ROIs used, which would add variability to the extracted time series. The effect of this, however, could likely dilute our results. Thus, our observed significant effects would likely only become more significant if this limitation were corrected.
A second limitation, characteristic of any bivariate correlation, is that significant couplings between two brain regions could be the result of their being driven by a third. We explored this possibility and found that the ACC is a region potentially driving the apparent coupling between right hemisphere amygdala and vlPFC (see results above and Fig. 3A). We investigated this further and found partial mediation of the ACC with the vlPFC to amygdala connection. Despite our standard arrowed diagram (Fig. 3B) the causality in such a mediation should be interpreted cautiously, as it represents ‘soft’ causal links that stem from the ‘DV’/’IV’ regression relation. The mediation analysis does, however, provide a more mechanistic description of the hyperconnectivity between amygdala and vlPFC. Future studies that systematically expand our four-node model and assess effective connectivity between regions are needed to further elucidate the causal relationship of functional pathology of bipolar disorder (45). Such work is ongoing in our laboratory.
Certain characteristics of our sampled subjects are also limitations. First, many of our bipolar I disorder subjects were medicated. There were too few subjects in each medication group to investigate the effects of specific medications, but this is something future work should address. We did, however, examine the correlation beta values of the three unmedicated subjects in our bipolar I disorder group to make sure their connectivity estimates were not driving the results and found them to be well within one standard deviation of the group mean. Despite the potential, but inconclusive, impact of medications on blood oxygen level-dependent (BOLD) signal in subjects with bipolar disorder (46), we argue that including medicated subjects ensures that our subject population is representative of the bipolar disorder population at large, thereby increasing the generalizability of our results. Second, there was a significant difference in employment between the two groups: the vast majority of bipolar I disorder subjects were unemployed while the majority of healthy subjects were employed. This is not something commonly controlled for in bipolar disorder studies, although future studies would benefit from taking a closer look at this issue. We note that unemployment is often correlated to bipolar disorder severity (47), but the relationship of the variable to resting state functional coupling has, to our knowledge, not been studied.
Finally, and not so much a limitation to our particular study as a reminder to exert interpretive caution with resting state studies, the current state of MRI-based imaging does not yet have a clear explanation of the relationship between task-based and resting state functional brain activity. The extent to which findings from experimental manipulations of cognitive states should and can map to resting states studies is still being actively investigated (10, 11). Many resting state studies have focused on a small set of reliably produced large-scale networks across the brain, and yet, for two decades the majority of cognitive neuroscientists have studied the activity and connectivity in a variety of different networks specific to cognitive processes and which have not been reliably uncovered within resting state analyses. One likely explanation for this discrepancy is that analyses of resting state data are conducted on a much lower and usually non-overlapping end of the fMRI signal frequency spectrum than standard task-based studies (11, 48). Knowledge coming from advances by those researchers actively investigating these important relationships will, no doubt, inform the types of studies, like this one, performed by clinical neuroscientists.
In summary, we took a focused approach to exploring resting state brain patterns in subjects with bipolar disorder during the euthymic mood state. Specifically, we investigated intrinsic connectivity between four ROIs that have been implicated in emotion regulation and have been previously shown to be functionally altered in bipolar disorder. Our results of hyperconnectivity between the right vlPFC and the right amygdala in bipolar I disorder subjects are in accordance with the few prior studies of bipolar disorder that have found either hyperactivation or hyperconnectivity in these brain regions. We further observed a mediating effect from the ACC, which was functionally coupled to both amygdala and vlPFC. Together, these findings suggest a maladaptive misallocation of neural resources in bipolar disorder. Intrinsic hyperconnectivity in the bipolar I disorder group between regions, in the ‘normal’ euthymic state and while at rest, could be evidence of a trait marker of disease pathophysiology.
Acknowledgments
For their financial support of this study, the authors gratefully acknowledge the Furlotti Family Foundation, the Swift Foundation, the UCLA Integrative Study Center in Mood Disorders fellowship, and the following two components of the National Institutes of Health (NIH): the National Institute of Mental Health [K24 MH001848 (LLA), R21 MH075944 (LLA), R01 MH084955 (LLA), T32 MH017140, and the National Center for Research Resources (NCRR) (RR12169, RR13642 and RR00865)]. Contents of this report are solely the responsibility of the authors and do not necessarily represent the official views of any sponsoring organization. For generous support the authors also wish to thank the Brain Mapping Medical Research Organization, Brain Mapping Support Foundation, Pierson-Lovelace Foundation, The Ahmanson Foundation, William M. and Linda R. Dietel Philanthropic Fund at the Northern Piedmont Community Foundation, Tamkin Foundation, Jennifer Jones-Simon Foundation, Capital Group Companies Charitable Foundation, Robson Family, and Northstar Fund. We would also like to acknowledge Alfonso Nieto Castoñón for Toolbox and Jeffrey Rudie for editorial assistance. The sponsors had no role in the design and conduct of the study; collection, management, analysis, and interpretation of the data; and preparation, review, or approval of the manuscript. LLA, SYB, TDM, MET, MMM, NV, and JDT had full access to all study data and take responsibility for its integrity and the accuracy of data analysis.
Footnotes
Disclosures
LLA has received past funding from Sepracor (advisory board honoraria, January 2010) and Eli Lilly & Co. (consultant, September 2010); and no past, but potential future honoraria from AstraZeneca (speakers bureau) and Merck and Co. (consulting). ST, TDM, NV, MET, MMM, JDT, and SYB report no financial relationships with commercial interests in relation to this paper.
References
- 1.Green M, Cahill C, Malhi GS. The cognitive and neurophysiological basis of emotion dysregulation in bipolar disorder. J Affect Disord. 2007;103:29–42. doi: 10.1016/j.jad.2007.01.024. [DOI] [PubMed] [Google Scholar]
- 2.Phillips ML, Ladouceur CD, Drevets WC. A neural model of voluntary and automatic emotion regulation: implications for understanding the pathophysiology and neurodevelopment of bipolar disorder. Mol Psychiatry. 2008;13:833–857. doi: 10.1038/mp.2008.65. [DOI] [PMC free article] [PubMed] [Google Scholar]
- 3.Lieberman MD, Eisenberger NI, Crockett MJ, Tom SM, Pfeifer JH, Way BM. Putting feelings into words: affect labeling disrupts amygdala activity in response to affective stimuli. Psychological Sci. 2007;18:421–428. doi: 10.1111/j.1467-9280.2007.01916.x. [DOI] [PubMed] [Google Scholar]
- 4.Ochsner KN, Ray R, Cooper J, et al. For better or for worse: neural systems supporting the cognitive down- and up-regulation of negative emotion. Neuroimage. 2004;23:483–499. doi: 10.1016/j.neuroimage.2004.06.030. [DOI] [PubMed] [Google Scholar]
- 5.Ghashghaei H, Barbas H. Pathways for emotion: Interactions of prefrontal and anterior temporal pathways in the amygdala of the rhesus monkey. Neuroscience. 2002;115:1261–1279. doi: 10.1016/s0306-4522(02)00446-3. [DOI] [PubMed] [Google Scholar]
- 6.Price JL, Drevets WC. Neurocircuitry of mood disorders. Neuropsychopharmacology. 2010;35:192–216. doi: 10.1038/npp.2009.104. [DOI] [PMC free article] [PubMed] [Google Scholar]
- 7.Banks S, Eddy K, Angstadt M, Nathan P, Phan K. Amygdala-frontal connectivity during emotion regulation. Soc Cog Affect Neurosci. 2007;2:303–312. doi: 10.1093/scan/nsm029. [DOI] [PMC free article] [PubMed] [Google Scholar]
- 8.Hariri AR, Bookheimer SY, Mazziotta JC. Modulating emotional responses: effects of a neocortical network on the limbic system. NeuroReport. 2000;11(1):43–48. doi: 10.1097/00001756-200001170-00009. [DOI] [PubMed] [Google Scholar]
- 9.Biswal BB, Yetkin FZ, Haughton VM, Hyde JS. Functional connectivity in the motor cortex of resting human brain using echo-planar MRI. Magn Reson Med. 1995;34:537–541. doi: 10.1002/mrm.1910340409. [DOI] [PubMed] [Google Scholar]
- 10.Smith SM, Fox PT, Miller KL, et al. Correspondence of the brain’s functional architecture during activation and rest. Proc Natl Acad Sci USA. 2009;106:13040–13045. doi: 10.1073/pnas.0905267106. [DOI] [PMC free article] [PubMed] [Google Scholar]
- 11.Van Dijk KRA, Hedden T, Venkataraman A, Evans KC, Lazar SW, Buckner RL. Intrinsic functional connectivity as a tool for human connectomics: theory, properties, and optimization. J Neurophysiology. 2010;103:297–321. doi: 10.1152/jn.00783.2009. [DOI] [PMC free article] [PubMed] [Google Scholar]
- 12.Fox MD, Raichle ME. Spontaneous fluctuations in brain activity observed with functional magnetic resonance imaging. Nat Rev Neurosci. 2007;8:700–711. doi: 10.1038/nrn2201. [DOI] [PubMed] [Google Scholar]
- 13.Fox MD, Greicius MD. Clinical applications of resting state functional connectivity. Front Syst Neurosci. 2010;4:1–13. doi: 10.3389/fnsys.2010.00019. [DOI] [PMC free article] [PubMed] [Google Scholar]
- 14.Anand A, Li Y, Wang Y, Lowe MJ, Dzemidzic M. Resting state corticolimbic connectivity abnormalities in unmedicated bipolar disorder and unipolar depression. Psychiatry Res. 2009;171:189–198. doi: 10.1016/j.pscychresns.2008.03.012. [DOI] [PMC free article] [PubMed] [Google Scholar]
- 15.Chai XJ, Whitfield-Gabrieli S, Shinn AK, et al. Abnormal medial prefrontal cortex resting-state connectivity in bipolar disorder and schizophrenia. Neuropsychopharmacology. 2011;36:2009–2017. doi: 10.1038/npp.2011.88. [DOI] [PMC free article] [PubMed] [Google Scholar]
- 16.Chepenik LG, Raffo M, Hampson M, et al. Functional connectivity between ventral prefrontal cortex and amygdala at low frequency in the resting state in bipolar disorder. Psychiatry Res. 2010;182:207–210. doi: 10.1016/j.pscychresns.2010.04.002. [DOI] [PMC free article] [PubMed] [Google Scholar]
- 17.Cerullo MA, Fleck DE, Eliassen JC, et al. A longitudinal functional connectivity analysis of the amygdala in bipolar I disorder across mood states. Bipolar Disord. 2012;14:175–184. doi: 10.1111/j.1399-5618.2012.01002.x. [DOI] [PMC free article] [PubMed] [Google Scholar]
- 18.Townsend J, Bookheimer SY, Foland-Ross LC, Sugar CA, Altshuler LL. fMRI abnormalities in dorsolateral prefrontal cortex during a working memory task in manic, euthymic and depressed bipolar subjects. Psychiatry Res. 2010;182:22–29. doi: 10.1016/j.pscychresns.2009.11.010. [DOI] [PMC free article] [PubMed] [Google Scholar]
- 19.Vizueta N, Rudie J, Townsend JD, et al. Regional fMRI hypoactivation and altered functional connectivity during emotion processing in nonmedicated depressed patients with bipolar II disorder. Am J Psychiatry. 2012;169:831–840. doi: 10.1176/appi.ajp.2012.11030349. [DOI] [PMC free article] [PubMed] [Google Scholar]
- 20.First MB, Frances A, Pincus HA. DSM-IV-TR Handbook of Differential Diagnosis. Arlington: American Psychiatric Publishers; 2002. [Google Scholar]
- 21.Young R, Biggs J, Ziegler V, Meyer D. A rating scale for mania: reliability, validity and sensitivity. Br J Psychiatry. 1978;133:429–435. doi: 10.1192/bjp.133.5.429. [DOI] [PubMed] [Google Scholar]
- 22.Hamilton M. A rating scale for depression. J Neurol Neurosurg Psychiatry. 1960;23:56–62. doi: 10.1136/jnnp.23.1.56. [DOI] [PMC free article] [PubMed] [Google Scholar]
- 23.Whitfield-Gabrieli S, Nieto-Castanon A. Conn: a functional connectivity toolbox for correlated and anticorrelated brain networks. Brain Connect. 2012;2:125–141. doi: 10.1089/brain.2012.0073. [DOI] [PubMed] [Google Scholar]
- 24.Power JD, Barnes KA, Snyder AZ, Schlaggar BL, Petersen SE. Spurious but systematic correlations in functional connectivity MRI networks arise from subject motion. Neuroimage. 2012;59:2142–2154. doi: 10.1016/j.neuroimage.2011.10.018. [DOI] [PMC free article] [PubMed] [Google Scholar]
- 25.Wilke M. An alternative approach towards assessing and accounting for individual motion in fMRI time series. Neuroimage. 2012;59:2062–2072. doi: 10.1016/j.neuroimage.2011.10.043. [DOI] [PubMed] [Google Scholar]
- 26.Murphy K, Birn RM, Handwerker DA, Jones TB, Bandettini PA. The impact of global signal regression on resting state correlations: are anti-correlated networks introduced? Neuroimage. 2009;44:893–905. doi: 10.1016/j.neuroimage.2008.09.036. [DOI] [PMC free article] [PubMed] [Google Scholar]
- 27.Behzadi Y, Restom K, Liau J, Liu TT. A component based noise correction method (CompCor) for BOLD and perfusion based fMRI. Neuroimage. 2007;37:90–101. doi: 10.1016/j.neuroimage.2007.04.042. [DOI] [PMC free article] [PubMed] [Google Scholar]
- 28.Chai XJ, Castonon AN, Öngür D, Whitfield-Gabrieli S. Anticorrelations in resting state networks without global signal regression. Neuroimage. 2012;59:1420–1428. doi: 10.1016/j.neuroimage.2011.08.048. [DOI] [PMC free article] [PubMed] [Google Scholar]
- 29.Foland-Ross LC, Altshuler LL, Bookheimer SY, Eisenberger NI, Townsend JD, Thompson PM. Evidence for deficient modulation of amygdala response by prefrontal cortex in bipolar mania. Psychiatry Res. 2008;162:27–37. doi: 10.1016/j.pscychresns.2007.04.007. [DOI] [PMC free article] [PubMed] [Google Scholar]
- 30.Townsend JD, Torrisi SJ, Lieberman MD, Sugar CA, Bookheimer SY, Altshuler LL. Frontal-amygdala connectivity alterations during emotion downregulation in bipolar I disorder. Biol Psychiatry. 2012 doi: 10.1016/j.biopsych.2012.06.030. [DOI] [PMC free article] [PubMed] [Google Scholar]
- 31.Eickhoff SB, Stephan KE, Mohlberg H, et al. A new SPM toolbox for combining probabilistic cytoarchitectonic maps and functional imaging data. Neuroimage. 2005;25:1325–1335. doi: 10.1016/j.neuroimage.2004.12.034. [DOI] [PubMed] [Google Scholar]
- 32.Oishi K, Faria AV, van Zijl PC, Mori S. MRI Atlas of Human White Matter. 2. London: Elsevier, B.V; 2011. [Google Scholar]
- 33.Vizueta N, Patrick CJ, Jiang Y, Thomas KM, He S. Dispositional fear, negative affectivity, and neuroimaging response to visually suppressed emotional faces. Neuroimage. 2012;59:761–771. doi: 10.1016/j.neuroimage.2011.07.015. [DOI] [PMC free article] [PubMed] [Google Scholar]
- 34.Baron RM, Kenny DA. The moderator-mediator variable distinction in social psychological research: conceptual, strategic, and statistical considerations. J Personal Soc Psychol. 1986;51:1173–1182. doi: 10.1037//0022-3514.51.6.1173. [DOI] [PubMed] [Google Scholar]
- 35.Beckmann CF, Jenkinson M, Smith SM. General multilevel linear modeling for group analysis in FMRI. Neuroimage. 2003;20:1052–1063. doi: 10.1016/S1053-8119(03)00435-X. [DOI] [PubMed] [Google Scholar]
- 36.Whitfield-Gabrieli S, Thermenos HW, Milanovic S, et al. Hyperactivity and hyperconnectivity of the default network in schizophrenia and in first-degree relatives of persons with schizophrenia. PNAS. 2009;106:1279–1284. doi: 10.1073/pnas.0809141106. [DOI] [PMC free article] [PubMed] [Google Scholar]
- 37.Honey CJ, Thivierge J-P, Sporns O. Can structure predict function in the human brain? Neuroimage. 2010;52:766–776. doi: 10.1016/j.neuroimage.2010.01.071. [DOI] [PubMed] [Google Scholar]
- 38.Noesselt T, Driver J, Heinze HJ, Dolan R. Asymmetrical activation in the human brain during processing of fearful faces. Curr Biol. 2005;15:424–429. doi: 10.1016/j.cub.2004.12.075. [DOI] [PubMed] [Google Scholar]
- 39.Versace A, Thompson WK, Zhou D, et al. Abnormal left and right amygdala-orbitofrontal cortical functional connectivity to emotional faces: state versus trait vulnerability markers of depression in bipolar disorder. Biol Psychiatry. 2010;67:422–431. doi: 10.1016/j.biopsych.2009.11.025. [DOI] [PMC free article] [PubMed] [Google Scholar]
- 40.Pompei F, Dima D, Rubia K, Kumari V, Frangou S. Dissociable functional connectivity changes during the Stroop task relating to risk, resilience and disease expression in bipolar disorder. Neuroimage. 2011;57:576–582. doi: 10.1016/j.neuroimage.2011.04.055. [DOI] [PubMed] [Google Scholar]
- 41.Beckmann M, Johansen-Berg H, Rushworth MFS. Connectivity-based parcellation of human cingulate cortex and its relation to functional specialization. J Neurosci. 2009;29:1175–1190. doi: 10.1523/JNEUROSCI.3328-08.2009. [DOI] [PMC free article] [PubMed] [Google Scholar]
- 42.Stein JL, Wiedholz, Bassett D, et al. A validated network of effective amygdala connectivity. Neuroimage. 2007;36:736–745. doi: 10.1016/j.neuroimage.2007.03.022. [DOI] [PubMed] [Google Scholar]
- 43.Wang F, Kalmar JH, He Y, et al. Functional and structural connectivity between the perigenual anterior cingulate and amygdala in bipolar disorder. Biol Psychiatry. 2009;66:516–521. doi: 10.1016/j.biopsych.2009.03.023. [DOI] [PMC free article] [PubMed] [Google Scholar]
- 44.Kim MJ, Gee DG, Loucks RA, Davis FC, Whalen PJ. Anxiety dissociates dorsal and ventral medial prefrontal cortex functional connectivity with the amygdala at rest. Cereb Cortex. 2011;21:1667–1673. doi: 10.1093/cercor/bhq237. [DOI] [PMC free article] [PubMed] [Google Scholar]
- 45.Palaniyappan L, Cousins DA. Brain networks: foundations and futures in bipolar disorder. J Ment Health. 2010;19:157–167. doi: 10.3109/09638230903469129. [DOI] [PubMed] [Google Scholar]
- 46.Phillips ML, Travis MJ, Fagiolini A, Kupfer DJ. Medication effects in neuroimaging studies of bipolar disorder. Am J Psychiatry. 2008;165:313–320. doi: 10.1176/appi.ajp.2007.07071066. [DOI] [PMC free article] [PubMed] [Google Scholar]
- 47.Goodwin FK, Jamison KR. Bipolar Disorders and Recurrent Depression. 2. Oxford: Oxford University Press; 2007. Manic-Depressive Illness. [Google Scholar]
- 48.Fox MD, Snyder AZ, Zacks JM, Raichle ME. Coherent spontaneous activity accounts for trial-to-trial variability in human evoked brain responses. Nat Neurosci. 2006;9:23–25. doi: 10.1038/nn1616. [DOI] [PubMed] [Google Scholar]