

Abstract
Sorafenib was shown in clinical trial to enhance survival in hepatocellular carcinoma (HCC) patients, but with minimal tumor shrinkage. To correlate several indices of HCC growth at various drug concentrations, HCC cells were grown in various low concentrations of two multi-kinase inhibitors, Regorafenib (Stivarga) and Sorafenib (Nexavar) and their effects were examined on alpha-fetoprotein (AFP), cell growth, migration and invasion. In two AFP positive human HCC cell lines, AFP was inhibited at 0.1–1µM drug concentrations. Cell migration and invasion were also inhibited at similar low drug concentrations. However, 10-fold higher drug concentrations were required to inhibit cell growth in both AFP positive and negative cells. To investigate this concentration discrepancy of effects, cells were then grown for prolonged times and sub-cultured in low drug concentrations and then their growth was re-tested. The growth in these drug-exposed cells was found to be slower than cells without prior drug exposure and they were also more sensitive to subsequent drug challenge. Evidence was also found for changes in cell signaling pathways in these slow-growth cells. Low multi-kinase inhibitor concentrations thus modulate several aspects of HCC cell biology.
Keywords: HCC, alpha-fetoprotein, Regorafenib, migration
INTRODUCTION
Regorafenib (Stivarga) and Sorafenib (Nexavar) are multikinase inhibitors that have growth inhibitory action against a variety of tumors in vitro (Adnane et al., 2006; Liu et al., 2006; Wilhelm et al., 2004; Wei et al., 2011). Sorafenib has been approved for human use by the FDA against renal cancer and hepatocellular carcinoma (HCC). Regorafenib is in current clinical trials for colorectal cancer and HCC. Although Sorafenib enhanced survival by 10 weeks in a large randomized placebo controlled clinical trial (SHARP) against HCC, tumor shrinkage was minimal (Llovetet al., 2008). There is also considerable clinical toxicity associated with its use (Di Fiore et al., 2011; Zhang et al., 2011; Schutz et al., 2011) and the mechanisms of its life-extending actions are only partially. To better understand how survival might be enhanced without tumor shrinkage, further studies on HCC cell growth were undertaken. We found a 10-fold lower drug concentration was needed to inhibit alpha-fetoprotein (AFP), cell migration and invasion than was needed to inhibit growth. However, longer duration of cell exposure to low drug concentrations also altered cell growth.
MATERIALS AND METHODS
Cells and drugs
Regorafenib or Sorafenib were gifts from the Bayer Corp (West Haven, CT USA). Hep3B, HepG2 and PLC/PRF/5 human HCC cells were purchased from the American Type Culture Collection (ATCC, Rockville, MD, USA). The culture medium was Dulbecco’s Modified Eagle’s Medium (DMEM). All cell culture components were purchased from Sigma- Aldrich (Milan, Italy).
Cell culture
Cells were cultured in DMEM in monolayer culture, and supplemented with 10% fetal bovine serum (FBS), 100U/ml penicillin, 100µg/ml streptomycin, and incubated at 37°C in a humidified atmosphere containing 5% CO2 in air. At confluence, the growing cells were harvested by means of trypsinization and serially sub-cultured with a 1:4 split ratio.
Regorafenib and Sorafenib treatment
Cells were seeded at 0.3x10⁵ cells/2ml of DMEM containing 10% FBS in 35mm tissue culture dishes (Corning Costar Co., Milan, Italy). The cells were incubated for 24h to allow attachment, and then the medium was replaced by fresh culture medium containing Regorafenib or Sorafenib at both low (0.25µM, 0.5µM and 1µM) and high concentrations (2.5µM and 5µM) dissolved in dimethyl sulfoxide (DMSO). In these experimental conditions, the cells were allowed to grow for various times and then processed for subsequent analyses. Each experiment included an untreated control and a control with the equivalent concentration of DMSO (solvent control) as the one used for adding the drugs. Triplicate cultures were set up for each drug concentration and for the controls, and each experiment was repeated three times.
Assessment of cell proliferation
After cells had been cultured with different drug concentrations, the proliferative response was estimated at each time point by colorimetric 3-(4,5 di-methylthiazol-2-yl)-2,5-diphenyltetrazolium bromide (MTT) test. To determine cell growth by the colorimetric test, MTT stock solution (5mg/ml in medium) was added to each dish at a volume of one-tenth the original culture volume and incubated for 2h at 37°C in humidified CO2. At the end of incubation period, the medium was removed, and the blue formazan crystals were solubilized with acidic isopropanol (0.1 N HCl in absolute isopropanol). MTT conversion to formazan by metabolically viable cells was monitored using a spectrophotometer at an optical density of 570nm. The trypan blue exclusion assay was used to evaluate cell viability. Each experiment was performed in triplicate and repeated three times.
AFP measurement
Medium AFP levels were measured by use of an automated system (UniCel Integrated WorkstationsDxC 660i, Beckman Coulter, Fullerton, California, USA) using a chemiluminescent immunometric method. Sample measurements over the calibration range were automatically re-analyzed according to constructor's instructions. Intracellular AFP was evaluated, at protein and mRNA level, by Western and real-time PCR, respectively, as described below.
Migration assay
Cells were growing for 48h in medium containing different concentrations of Regorafenib or Sorafenib or their solvent (control), until confluence. A scratch wound was generated by scratching with a pipette tip (Liang et al., 2007). After rinsing with medium to remove detached cells, low serum medium (1% FBS) with different concentrations of drugs was added. Photographic images were taken from each well immediately (T0) and again after 24h (T1), 48h (T2) and 72h (T3) using a Leica DMRXA camera (Leica Microsystems). Images were analyzed using ImageJ Software (http://rsb.info.nih.gov/ij/). The distance that cells migrated through the area created by scratching was determined by measuring the wound width at 24h, 48h and 72h. The values obtained were then expressed as percentage of open area, setting the area of the wound at T0 as 100%. The results were representative of three independent experiments.
Invasion assay
Cell invasion assays were performed using Matrigel (BD Transduction, San Jose, CA, USA)-coated Transwells (8µm pore PET membrane, Millipore, Billerica, MA, USA). 1.0×10⁵ cells per well were suspended in 100µl of low-serum medium containing different concentrations of Regorafenib or Sorafenib or their solvent (control). Complete medium (500µl) containing 10% FBS was added to the bottom wells of the plate. Cells were incubated for 24h. Non-migrating cells were wiped away and washed with PBS. The membranes were fixed with methanol and stained with a crystal violet stain solution (Chem. Cruz). Images were acquired using Leica DMRXA camera (Leica Microsystems) and analyzed using ImageJ Software (http://rsb.info.nih.gov/ij/). Migrated cells were counted in six separated fields per well. The values obtained were then expressed as percentage of invasion, setting the cell counts of control cells as 100%. The results were representative of three independent experiments.
Real-time PCR (qPCR)
Cellular AFP mRNA levels in HepG2 and PLC cells was evaluated by reverse transcriptase and real-time PCR. The primers for AFP mRNA sequence (GeneBank accession: NM_001134) were selected by Primer Premier 6.0 software (PREMIER Biosoft, Palo Alto, CA, USA). The primers were: 5’- AAAAGCCCACTCCAGCATC-3’ (forward) and 5’-GCGAGCAGCCCAAAGAAGA-3’ (reverse). β-actin was used as housekeeping gene. The β-actin primers were: 5’- AAGACCTGTACGCCAACACAGTGCTGTCTGG-3’ (forward) and 5’- CGTCATACTCCTGCTTGCTGATCCACATCTGC-3’ (reverse).
Total RNA was extracted by TRIzol reagent and an aliquot of 2µg of RNA in a final volume of 20µl was reverse-transcribed (RT) by SuperScript First-Strand Synthesis System (Invitrogen, Milan, Italy). The 5µl of cDNA was amplified by qPCR (iQCycler, BioRad, Milan, Italy) at 94°C for 10 sec, 55°C for 10 sec and 72°C for 30 sec repeated for 40 cycles. For amplification of β-actin was used 2µl of cDNA.
The experiments were repeated three times and the AFP mRNA levels were calculated as AFP/β-actin ratio.
Western blotting analysis
To evaluate Regorafenib or Sorafenib effects on cellular MAPK signaling, apoptosis and autophagy pathways, western blotting analysis was performed in Hep3B and PLC/PRF/5 cell lines. The AFP expression was evaluated in Hep3B and PLC/PFF/5 cell lines. After harvest, the cells were washed twice with cold PBS and then lysed in RIPA buffer (Sigma-Aldrich, Milan; Italy). Protein concentration was determined using Micro BCA Protein Assay kit (Thermo Scientific, Rockford, IL USA) as described in manufacture manual. Equal amount of protein (20µg) were resolved on SDS–PAGE and transferred to polyvinyldifluoride (PVDF) filters (BioRad, Milan; Italy). The blots were blocked 5% (w/v) nonfat dry milk for 2h at room temperature and then probed with primary antibody overnight at 4°C. The primary antibodies were directed against the following proteins: ERK and phospho-ERK, MEK and phospho-MEK, Atg4A, Bad, Bid, AFP and β-actin (Cell Signaling, Beverly, MA, USA); cleaved caspase-3, -7, -8, -9, MAP LC3-I/II, phospho-survivin, Bcl-2, Bax and Beclin-1 (Santa Cruz Biotechnology, Santa Cruz, CA, USA). After three washes, incubation was followed by the reaction with horseradish peroxidase-conjugated secondary antibody for 1h at room temperature. The immunoreactive bands were visualized and analyzed using the enhanced chemiluminescence detection reagents (Cell Signaling), according to the manufacturer’s instructions, and chemiluminescence detection system (ChemiDoc XRS apparatus and software, Bio-Rad).
Statistical analysis
All experiments were performed in triplicate. Data are expressed as mean ± standard deviation and comparisons between groups were made using one-way ANOVA test followed by Dunnett’s post test. P values of <0.05 were considered to be significant.
RESULTS
Growth inhibition
AFP positive PLC/PRF/5 and HepG2 cells and AFP negative Hep3B cells were treated in tissue culture with various concentrations of either Regorafenib or Sorafenib and growth was assessed at 72h. Cell growth was inhibited with each agent in the range of 1–5µM, depending on the cell line (Fig. 1).
Fig. 1. Effects of Regorafenib and Sorafenib on cell proliferation.

Growth curves for three different human HCC cell lines, PLC/PRF/5, HepG2 and Hep3B, treated with drug for 24, 48 and 72 hours.
AFP response
Since AFP is an important clinical tumor marker for HCC, we examined the effects of Regorafenib or Sorafenib on AFP levels, using the two AFP-secreting human HCC cell lines, PLC/PRF/5 and HepG2. A dose-dependent decrease in medium AFP levels was found for each cell line, after drug exposure (Fig. 2A). The concentrations used to obtain the IC50 for AFP were 0.25–0.5µM, 5–10-fold lower than those needed for growth inhibition (1–5µM). Cells, treated in the same conditions, were then lysed and subjected to qPCR and Western blot analysis for cellular AFP expression. A concentration-dependent decrease in cellular AFP levels was found (Fig. 2B). Moreover, HepG2 cells are more sensitive to the drugs action despite their higher cellular AFP content (about 40% more) compared to PLC/PRF/5 cells (data not shown).
Fig. 2. AFP changes after Regorafenib or Sorafenib exposure.
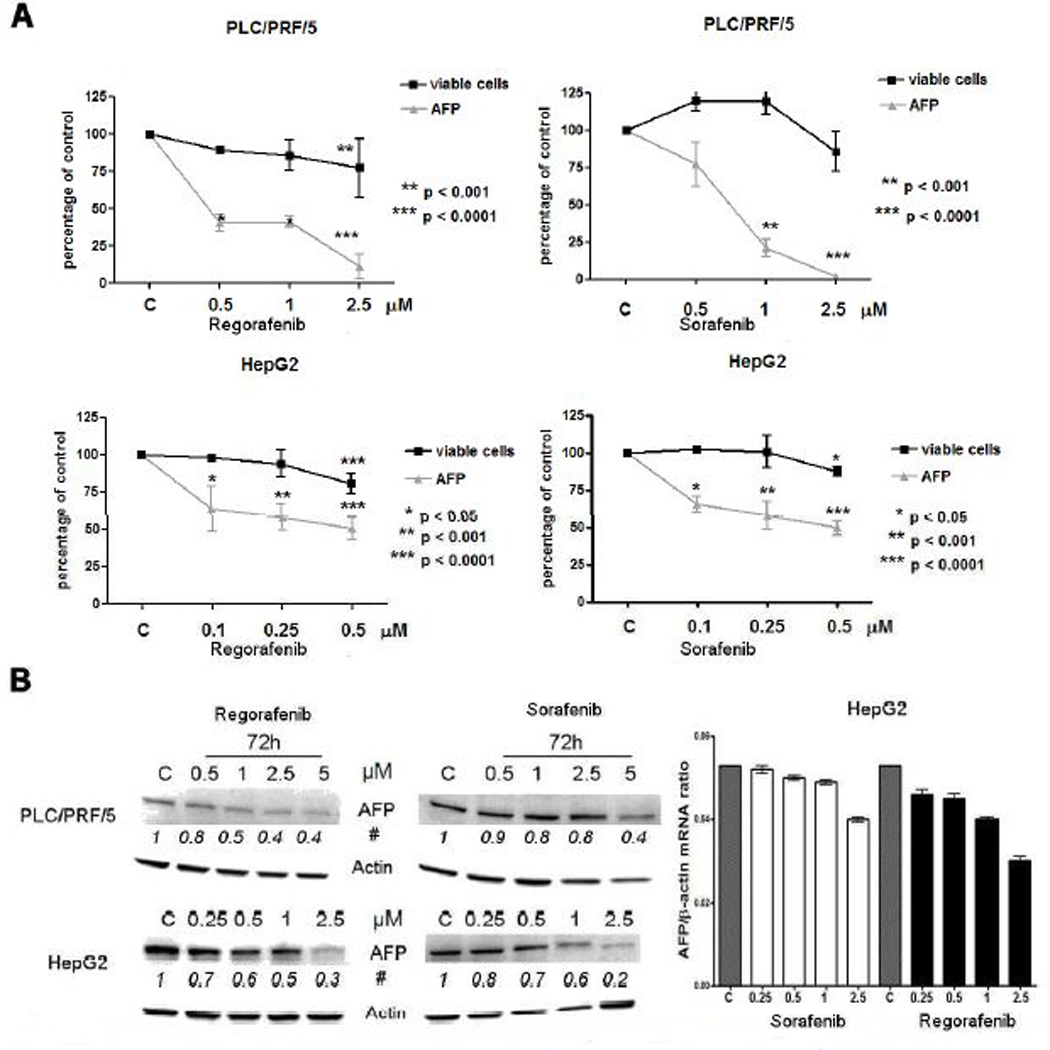
A: AFP levels in the cell culture medium of PLC/PRF/5 and HepG2 cell lines and the number of viable cells after treatment with different drug concentrations.
B: Western blotting and real-time PCR analysis of cellular AFP in relation to drug concentrations. The experiments were repeated three times.
# Average of changes in protein band densities using arbitrary control values as unity.
The relative AFP mRNA expression (mean ± SD) is expressed as AFP/β-actin ratio.
C = control, vehicle treated cells.
Cell migration and invasion
A scratch assay was used to examine the effects of Regorafenib or Sorafenib on HCC cell migration, in the same cell lines as were used in Fig.1. We found that either Regorafenib or Sorafenib inhibited HCC cell migration in both AFP-positive and AFP-negative cells, as shown in Fig. 3A for PLC cells, at the same low concentration range as inhibited AFP levels. Similar results were found in a cell invasion assay, at almost identical drug concentrations (Fig.3B).
Fig. 3. Effects of Regorafenib or Sorafenib on cell migration and invasion.
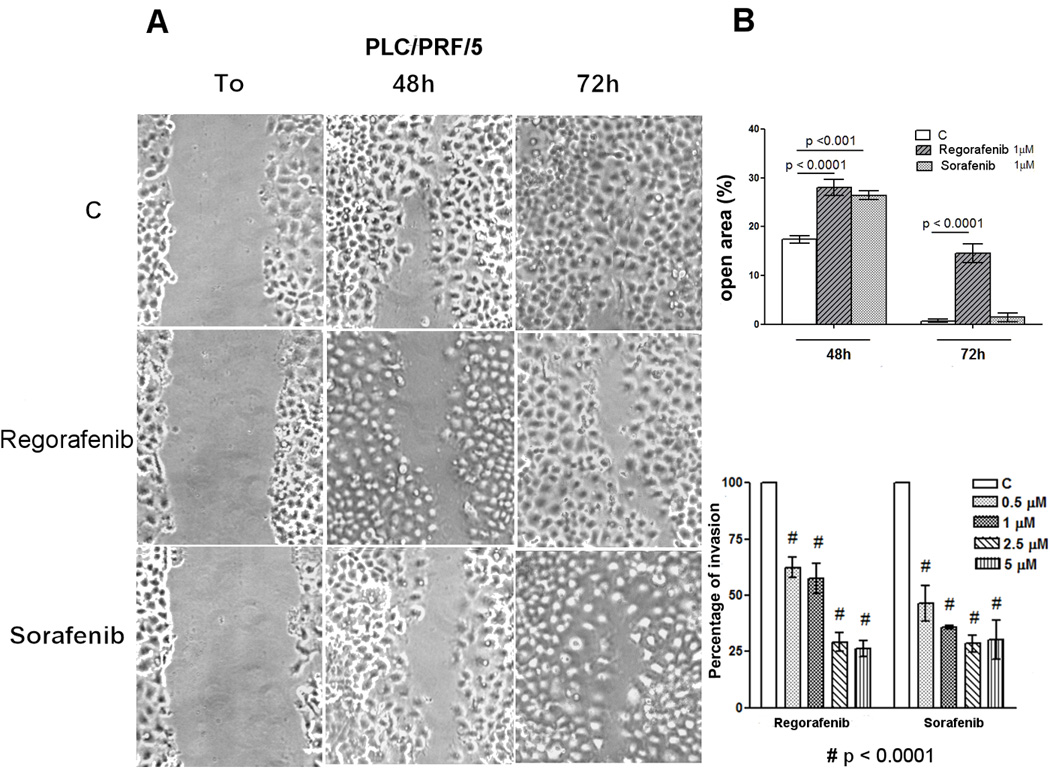
A: Migration assay. PLC/PRF/5 cells were treated with the drugs and microscopically analyzed at the time of the scratch (T0) and after 48 and 72 hours. Original photographs and quantitative analysis of the cell-free scratch path areas, each performed in triplicate, are shown.
B: Migration and Invasion assays quantization. Invasion assay: Invading PLC/PRF/5 cells were treated with different drug concentrations. Invasion was calculated as a percentage of the invading drug-treated cells compared to drug-untreated control cells.
Low drug concentration-mediated growth changes
The low concentrations of drugs which resulted in decreased AFP levels, cell migration and invasion, were not sufficient to induce changes in a standard cell growth assay (Fig.1). To better understand the significance of the decreased AFP levels, which usually accompany tumor responses to therapy in HCC patients, we grew all three cell lines in a range of concentrations, 0.1–1µM, of Regorafenib or Sorafenib which had no effect on cell proliferation in short-term continuous treatments. Then the cells were sub-cultured for 4 weeks in drug-containing medium. The drug was then removed, drug-free fresh medium was substituted and the subsequent cell growth was monitored and compared to the growth of parallel cells which had no prior drug exposure. The results, referred to the experiment with 1 µM for Hep3B and PLC/PRF/5 and with 0.1 µM for HepG2, showed that drug pre-treated cells grew more slowly compared with untreated cells of each cell line (Fig. 4A). The results obtained with the other concentration were not shown. The experiment was then repeated, but the cells that were previously growing and sub-cultured in 0.1–1µM Regorafenib, were next treated with a range of concentrations of the same drug. The growth of these cells was then compared with the growth of drug-untreated cells that were now exposed to the same range of Regorafenib concentrations in culture. The results showed that growth of HCC cells that were pre-treated for longer times at low concentrations of either drug was slower after release from drug exposure than the growth of non pre-treated cells. Furthermore, pre-treated cells also had some enhanced sensitivity to subsequent challenge by various concentrations of Regorafenib, compared with the same challenge to non pre-treated cells (Fig. 4B).
Fig. 4. Cell growth after 4 weeks of exposure to 1 µM Regorafenib or Sorafenib.
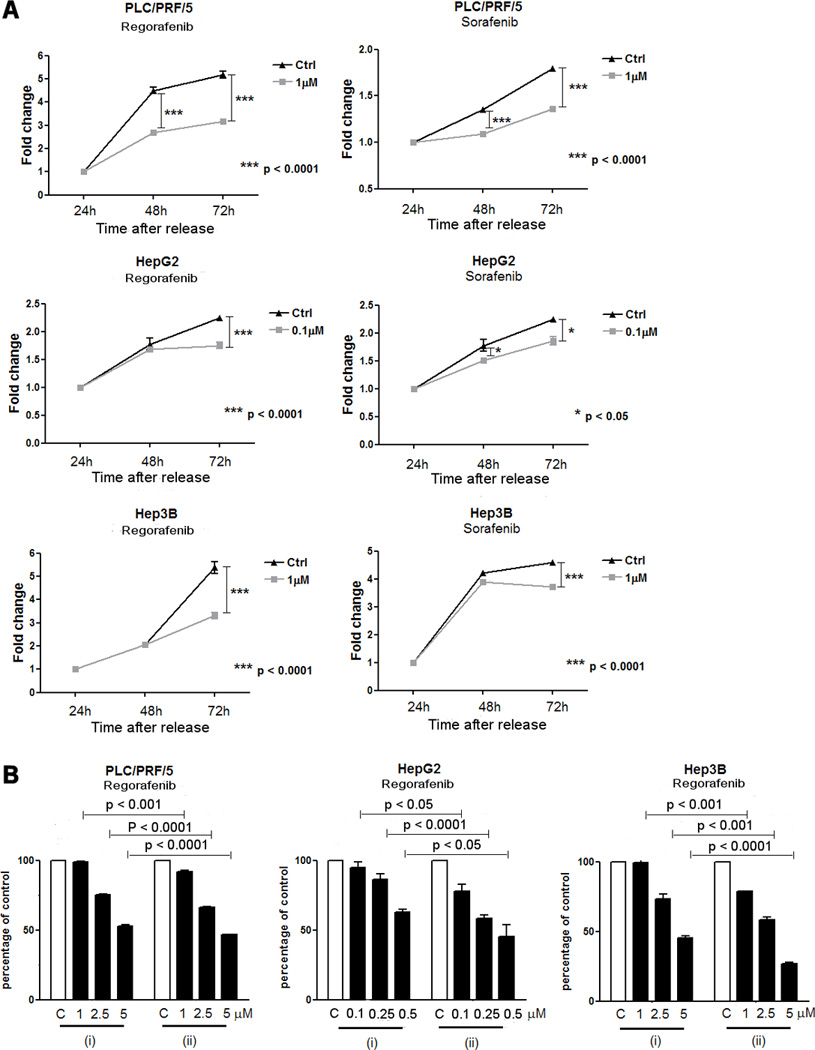
A: Cell growth after release from drug exposure (0.1µM for HepG2 cells and 1µM for PLC/PRF/5 and Hep3B cells) for 4 weeks.
B: Cell growth after release from Regorafenib 0.1 or 1µM as in A, and subsequent challenge with various Regorafenib concentrations (ii), compared with the same challenge to non-pretreated cells (i).
Mechanisms associated with growth inhibition at low drug concentrations
Cells were treated with 1µM Regorafenib or Sorafenib continuously and sub-cultured as needed, for 7 or 14 days and were then harvested for WB analysis. Since growth was slowed, but not inhibited at the low drug concentrations used in these experiments, we initially examined the levels of phospho-ERK, since this is a main downstream target of Raf, itself one of the primary HCC targets of these 2 multikinase inhibitors. We found that phospho-MEK and phospho-ERK levels decreased with long times of drug exposure, consistent with the slower cell growth. We previously found that they decreased within minutes of drug exposure and then recovered (Carr et al., 2012). Evidence was also sought for the presence of apoptosis or autophagy, since these processes are considered to be important in the mechanisms of several multikinase growth inhibitors, including Sorafenib. However, we found stable levels of apoptotic and autophagic markers (suppl. Fig. S1).
DISCUSSION
Serum AFP levels are routinely used to monitor the progression of HCC disease or response to therapy (Memonet al., 2012). Not all HCCs are AFP positive and there is likewise heterogeneity among HCC tumors (Personeni et al., 2012; Carr et al., 2009) and cell lines. Two AFP-positive human HCC cell lines were used to evaluate the effects of either Regorafenib or Sorafenib on secreted AFP levels in the HCC cell culture medium. Each agent at low drug concentrations decreased AFP levels both in the medium and in the cells. We were interested in the apparent difference between the low drug concentrations needed to inhibit levels of AFP, a growth-associated tumor marker, and the much higher concentrations needed for cell growth inhibition (Figs. 1 and 2). Both a cell migration and an invasion assay showed that similar low drug concentrations could also inhibit each of these cell properties in all three cell lines tested. We used a standard MTT in vitro cell viability assay and determined that much higher drug concentrations were required to inhibit growth both in AFP-producing and AFP non-producing cells, at similar drug concentrations that have been used previously (Adnane et al., 2006; Liu et al.,2006; Wei et al., 2010). Since AFP response is widely regarded as a marker for clinical tumor responses to patient treatment (Memon et al., 2012) or for tumor progression, we suspected that the low concentrations of drug needed to inhibit AFP levels, cell migration and invasion in these experiments, were likely having a subtle effect on cell growth that standard cell growth assays were not detecting. We therefore increased the time of exposure of cells to test drug, by sub-culturing the cells in the same low drug concentrations (0.1 –1µM) that inhibited AFP levels, cell migration and invasion. Many HCC properties contribute to patient death, including cell invasion and resulting metastasis. These results, showing significant inhibition of migration and invasion, may also be useful for therapy, in addition to cell growth inhibition. The increased time of exposure of the cells to low drug concentrations, resulted in a measurable decrease in cell growth after drug release, as well as in some increase in sensitivity to subsequent challenge of the cells by higher drug concentrations. The mechanisms involved in the slower growth induced by low drug concentrations are not clear, since there was little evidence for apoptosis or autophagy after low concentrations of drug treatment. Most likely, the low drug concentrations affect cell signaling mechanisms involved in cell proliferation, as judged by the altered phospho-ERK levels seen in longer term low concentration drug-treated cells. These results may contribute to understanding the increased survival in the SHARP trial for Sorafenib therapy for HCC, despite an absence of tumor shrinkage as measured on radiology, likely by slowing cell growth without causing cell death and necrosis. This probably relates to the increased time to tumor progression found in the Sorafenib treated patients in that trial. While the trial showed minimal tumor shrinkage, both the SHARP trial and the phase II trial showed evidence of decreased HCC vascularity. HCCs are highly vascular tumors and consist of multiple cell types in addition to HCC cells, such as endothelial and other mesenchymal cells and Sorafenib also has inhibitory actions on the VEGFR in the endothelial cells. The tumor complexity is not reflected in the single HCC cell type of continuous cell lines in culture, as used here.
This class of drug is not cytocidal, but alters cell growth, likely by multiple mechanisms. The SHARP trial showed that Nexavar enhanced survival without tumor size change. Our results with migration and invasion inhibition add another dimension to the range of tumor responses of this class of agent. Others have also recently reported different signaling effects of Sorafenib, depending on drug concentrations (Rose et al., 2010). A possible clinical application of these results could be in the use of lower concentrations of either Sorafenib or Regorafenib, with expected decrease in clinical side-effects, yet still permitting a useful slowing of tumor growth. There has recently been some clinical evidence in support of this possibility (Iavarone et al., 2011; Kim et al., 2012).
Sorafenib is currently in clinical trial for neo-adjuvant therapy for HCC patients awaiting liver transplant. Low doses of Regorafenib might also have potential for adjuvant or neo-adjuvant therapy for these patients.
Supplementary Material
A representative Western blotting analysis of apoptotic and autophagic markers in a HCC cell line (Hep3B) treated with 1µM Regorafenib for 14 days.
No induction of apoptotic and autophagic processes was observed and the same results were obtained with Sorafenib or with PLC/PRF/5 cells.
C = control, vehicle treated cells.
Fig. 5. Signaling in cells treated with prolonged Regorafenib or Sorafenib.
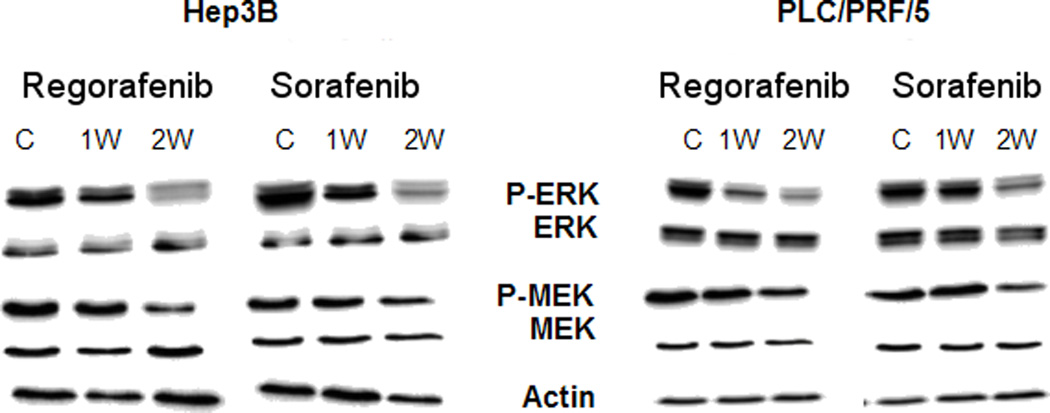
Western blotting analysis for phosphorylated ERK (P-ERK) and phosphorylated MEK (P-MEK) (compared with ERK and MEK) in Hep3B and PLC/PRF/5 cells after exposure to either 1µM Regorafenib or Sorafenib for 1 or 2 weeks (1W; 2W).
Acknowledgments
Authors wish to acknowledge the support of MD Antonio Francavilla.
Footnotes
Conflict of Interest Statement: None declared by any author.
Contributor Information
Brian Irving Carr, Email: brianicarr@hotmail.com.
Rosalba D’Alessandro, Email: dalessandro.rosalba@libero.it.
Maria Grazia Refolo, Email: mgrefolo@libero.it.
Palma Aurelia Iacovazzi, Email: mina.iacovazzi@irccsdebellis.it.
Catia Lippolis, Email: catia.lippolis20@libero.it.
Caterina Messa, Email: caterina.messa@irccsdebellis.it.
Aldo Cavallini, Email: cavaldo@libero.it.
Mario Correale, Email: mario.correale@tin.it.
Antonio Di Carlo, Email: antonio.dicarlo@irccsdebellis.it.
REFERENCES
- Adnane L, Trail PA, Taylor I, Wilhelm SM. Sorafenib (BAY 43–9006, Nexavar), a dual-action inhibitor that targets RAF/MEK/ERK pathway in tumor cells and tyrosine kinases VEGFR/PDGFR in tumor vasculature. Methods Enzymol. 2006;407:597–612. doi: 10.1016/S0076-6879(05)07047-3. [DOI] [PubMed] [Google Scholar]
- Carr BI, Cavallini A, Lippolis C, D’Alessandro R, Messa C, Refolo MG, Tafaro A. Fluoro-Sorafenib (Regorafenib) effects on hepatoma cells: growth inhibition, quiescence and recovery. J Cell Physiol. 2012 doi: 10.1002/jcp.24148. (in press). [DOI] [PMC free article] [PubMed] [Google Scholar]
- Carr BI, Pancoska P, Branch RA. Tumor and liver determinants of prognosis in unresecable hepatocellular carcinoma: a large case cohort study. Hepatol Int. 2009;4:396–405. doi: 10.1007/s12072-009-9157-7. [DOI] [PMC free article] [PubMed] [Google Scholar]
- Di Fiore F, Rigal O, Ménager C, Michel P, Pfister C. Severe clinical toxicities are correlated with survival in patients with advanced renal cell carcinoma treated with sunitinib and Sorafenib. Br J Cancer. 2011;105:1811–1813. doi: 10.1038/bjc.2011.507. [DOI] [PMC free article] [PubMed] [Google Scholar]
- Iavarone M, Cabibbo G, Piscaglia F, Zavaglia C, Grieco A, Villa E, Cammà C, Colombo M SOFIA (SoraFenibItalianAssessment) study group. Field-practice study of Sorafenib therapy for hepatocellular carcinoma: a prospective multicenter study in Italy. Hepatology. 2011;54:2055–2063. doi: 10.1002/hep.24644. [DOI] [PubMed] [Google Scholar]
- Kim JE, Ryoo BY, Ryu MH, Chang HM, Suh DJ, Lee HC, Lim YS, Kim KM, Kang YK. Sorafenib dose escalation in the treatment of advance hepatocellular carcinoma. Oncology. 2012;82:119–125. doi: 10.1159/000336082. [DOI] [PubMed] [Google Scholar]
- Liang CC, Park AY, Guan JL. In vitro scratch assay: a convenient and inexpensive method for analysis of cell migration in vitro. Nat Protoc. 2007;2:329–333. doi: 10.1038/nprot.2007.30. [DOI] [PubMed] [Google Scholar]
- Liu L, Cao Y, Chen C, Zhang X, McNabola A, Wilkie D, Wilhelm S, Lynch M, Carter C. Sorafenib blocks the RAF/MEK/ERK pathway, inhibits tumor angiogenesis, and induces tumor cell apoptosis in hepatocellular carcinoma model PLC/PRF/5. Cancer Res. 2006;66:11851–11858. doi: 10.1158/0008-5472.CAN-06-1377. [DOI] [PubMed] [Google Scholar]
- Llovet JM, Ricci S, Mazzaferro V, Hilgard P, Gane E, Blanc JF, de Oliveira AC, Santoro A, Raoul JL, Forner A, Schwartz M, Porta C, Zeuzem S, Bolondi L, Greten TF, Galle PR, Seitz JF, Borbath I, Haussinger D, Giannaris T, Shan M, Moscovici M, Voliotis D, Bruix J SHARP Investigators Study Group. Sorafenib in advanced hepatocellular carcinoma. N Engl J Med. 2008;359:378–390. doi: 10.1056/NEJMoa0708857. [DOI] [PubMed] [Google Scholar]
- Memon K, Kulik L, Lewandowski RJ, Wang E, Ryu RK, Riaz A, Nikolaidis P, Miller FH, Yaghmai V, Baker T, Abecassis M, Benson AB, 3rd, Mulcahy MF, Omary RA, Salem R. Alpha-fetoprotein response correlates with EASL response and survival in solitary hepatocellular carcinoma treated with transarterial therapies: A subgroup analysis. J Hepatol. 2012;56:1112–1120. doi: 10.1016/j.jhep.2011.11.020. [DOI] [PMC free article] [PubMed] [Google Scholar]
- Personeni N, Bozzarelli S, Pressiani T, Rimassa L, Tronconi MC, Sclafani F, Carnaghi C, Pedicini V, Giordano L, Santoro A. Usefulness of alpha-fetoprotein response in patients treated with Sorafenib for advanced hepatocellular carcinoma. J Hepatol. 2012;57:101–107. doi: 10.1016/j.jhep.2012.02.016. [DOI] [PubMed] [Google Scholar]
- Rose A, Grandoch M, vomDorp F, Rubben H, Rosenkranz A, Fischer JW, Weber AA. Stimulatory effects of the multi-kinase inhibitor Sorafenib on human bladder cancer cells. Br J Pharmacol. 2010;160:1690–1698. doi: 10.1111/j.1476-5381.2010.00838.x. [DOI] [PMC free article] [PubMed] [Google Scholar]
- Schutz FA, Je Y, Choueiri TK. Hematologic toxicities in cancer patients treated with the multi-tyrosine kinase Sorafenib: a meta-analysis of clinical trials. Crit Rev Oncol Hematol. 2011;80:291–300. doi: 10.1016/j.critrevonc.2010.11.007. [DOI] [PubMed] [Google Scholar]
- Wei G, Wang M, Hyslop T, Wang Z, Carr BI. Vitamin K enhancement of Sorafenib-mediated HCC cell growth inhibition in vitro and in vivo. Int J Cancer. 2010;127:2949–2958. doi: 10.1002/ijc.25498. [DOI] [PMC free article] [PubMed] [Google Scholar]
- Wilhelm SM, Carter C, Tang L, Wilkie D, McNabola A, Rong H, Chen C, Zhang X, Vincent P, McHugh M, Cao Y, Shujath J, Gawlak S, Eveleigh D, Rowley B, Liu L, Adnone L, Lynch M, Auclair D, taylor I, Gendrich R, Voznesensky A, Riedl B, Post LE, Bollag G, Trail PA. BAY 43–9006 exhibits broad spectrum oral antitumor activity and targets the RAF/MEK/ERK pathway and receptor tyrosine kinases involved in tumor progression and angiogenesis. Cancer Res. 2004;64:7099–7109. doi: 10.1158/0008-5472.CAN-04-1443. [DOI] [PubMed] [Google Scholar]
- Wilhelm SM, Dumas J, Adnane L, Lynch M, Carter CA, Schütz G, Thierauch KH, Zopf D. Regorafenib (BAY 73–4506): a new oral multikinase inhibitor of angiogenic, stromal and oncogenic receptor tyrosine kinases with potent preclinical antitumor activity. Int J Cancer. 2011;129:245–255. doi: 10.1002/ijc.25864. [DOI] [PubMed] [Google Scholar]
- Zhang L, Zhou Q, Ma L, Wu Z, Wang Y. Meta-analysis of dermatological toxicities associated with Sorafenib. Clin Exp Dermatol. 2011;36:344–350. doi: 10.1111/j.1365-2230.2011.04060.x. [DOI] [PubMed] [Google Scholar]
Associated Data
This section collects any data citations, data availability statements, or supplementary materials included in this article.
Supplementary Materials
A representative Western blotting analysis of apoptotic and autophagic markers in a HCC cell line (Hep3B) treated with 1µM Regorafenib for 14 days.
No induction of apoptotic and autophagic processes was observed and the same results were obtained with Sorafenib or with PLC/PRF/5 cells.
C = control, vehicle treated cells.