Abstract
Transcription factors are regulatory proteins that bind to specific sites of chromosomal DNA to enact responses to intracellular and extracellular stimuli. Transcription factor signalling networks are branched and interconnected so that any single transcription factor can activate many different genes and one gene can be activated by a combination of different transcription factors. Thus, trying to characterize a cellular response to a stimulus by measuring the level of only one transcription factor potentially ignores important simultaneous events that contribute to the response. Hence, parallel measurements of transcription factors are necessary to capture the breadth of valuable information about cellular responses that would not be obtained by measuring only a single transcription factor. We have sought to develop a new, scalable, flexible, and sensitive approach to analysis of transcription factor levels that complements existing parallel approaches. Here, we describe proof-of-principle analyses of purified human transcription factors and breast cancer nuclear extracts. Our assay can successfully quantify transcription factors in parallel with ~10-fold better sensitivity than current techniques. Sensitivity of the assay can be further increased by 200-fold through the use of PCR for signal amplification.
Keywords: Transcription Factors, Parallel, DNA binding activity, Magnetic Beads separation, Breast Cancer
INTRODUCTION
Transcription factors (TFs) are cell regulatory proteins that facilitate proper cell function by controlling gene expression in response to intracellular and extracellular stimuli [1]. TFs act through binding to specific sites of chromosomal DNA, thereby directing which gene(s) will be expressed. Any one TF can respond to a variety of stimuli; additionally, multiple TFs are typically activated by any one stimulus. Thus, the profile of active TFs is complex and constantly changing [2,3]. Aberrant TF activity results in improper cell function and can lead to disease (e.g., cancer) [4-8]. Therefore, monitoring of TF function is valuable for understanding biological processes and can support medical diagnoses and the development of novel therapeutics.
In studying TFs, there are two principal areas of research, i) identification of the consensus sequences and target genes of a single transcription factor and ii) measuring the levels of active TFs in response to a stimulus. Considerable work has been done in the first area using a variety of tools, including protein-binding microarrays and chromatin immunoprecipitation (ChIP) based approaches [9,10]. It is through the use of these tools that some TF regulatory networks have been constructed [11-13].
Identifying the consensus target sequence for a given TF also provides an approach to quantify the level of the TF in response to stimuli. These techniques can be performed in vitro (e.g., electrophoretic mobility shift assays (EMSAs)) or in cells (e.g., reporter gene assays) [14-16]. Each of these approaches can be applied for the analysis of single or multiple TFs, depending on the readout strategy [17-19]. Cytometry based assays have been developed for measuring TFs in parallel based on fluorescent beads tagged with the TF consensus sequences [20]. Additionally, an approach termed OATFA combined electrophoresis with an oligo microarray and showed success in analyzing multiple TFs in parallel both in purified TFs and in cell extracts [21,22].
While all of these current techniques to measure TFs in parallel have provided valuable information to improve the understanding of cellular processes [23], we are seeking to develop a complementary assay that approaches our perception of the ideal assay for parallel TF measurements. This ideal assay would meet the following characteristics: i) low detection limits (108 TF molecules or fewer), ii) small sample sizes (106 cells or fewer), iii) parallel measurements up to hundreds of TFs simultaneously, and iv) quantitative, rather than relative, measurements of TF levels. Moreover, we would want to avoid labor-intensive techniques like electrophoresis (as applied in EMSA and OATFA), manipulation of the cells prior to analysis (as in reporter gene assays), and expensive/proprietary technologies (as in cytometry-based approaches).
In this study, we have devised an approach to measure TF levels in parallel, based on streptavidin magnetic bead separation that begins to approach some of the ideal properties described above. For proof-of-concept, we have successfully analyzed purified transcription factors, p50 (NF-κB family) and c-Jun (AP-1 family), in parallel with ~10-fold improved sensitivity over existing approaches. Also, nuclear extracts of breast cancer cells untreated and treated with TNF-α and IKK inhibitor were successfully analyzed with our method. Going forward, we envision straightforward coupling of our approach with modern technologies for DNA analysis (e.g., parallel sequencing) to expand the number of TFs that can be assayed in parallel using the approach.
MATERIALS AND METHODS
Magnetic beads assay strategy (Figure 1)
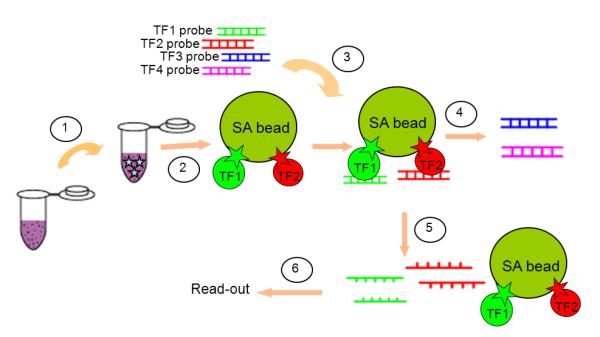
Figure 1. Schematic representation of proposed method.
1. Chemically biotinylate TFs in nuclear extracts; 2. Immobilize biotinylated TFs on streptavidin-coated magnetic beads (SA beads); Remove unbound proteins in the supernatant and wash the beads three times; 3. Mix TF-loaded beads with a library of DNA probes in binding buffer for 20 min at room temperature; 4. Apply magnet and remove unbound probes in the supernatant; Wash the beads three times to remove non-specifically bound probes; 5. Elute and denature retained DNA by incubating at 95°C for 15 min; 6. Apply magnet, recover eluted DNA in supernatant and analyze recovered DNA, using PCR amplification if necessary.
Biotinylated transcription factors were immobilized on streptavidin-coated magnetic beads (Dynal/Invitrogen, Oslo, Norway) by incubation at room temperature for 20 min in 1× PBS. A magnet was then applied, supernatant removed, and TF-bound beads recovered. Beads were washed three times with 50 μl wash buffer I (1× PBS plus 0.1%BSA). Recovered beads were mixed with a DNA probes in binding buffer (10 mM Tris-HCl, 1 mM MgCl2, 0.5 mM EDTA, 0.5 mM DTT, 50 mM NaCl, 1 mM CaCl2, 0.2 mM KCl, 10 μM ZnCl2, 4% glycerol, 20 mM acetic acid, 0.025μg/μL poly (dI-dC)) for 20 min at room temperature. Binding conditions were optimized by pH analysis (Figure S1, Electronic Supplementary Material), with pH = 6.5 selected to balance retention of specific signal with removal on non-specific signal. The magnet was applied again and the supernatant collected. The beads were then washed with wash buffer II (0.02% Tween 20 in water), with the supernatants collected after each wash step.
Scintillation Counting
The beads were resuspended with 50 μL of water and mixed with 10ml Safety Solve High Flash Point Scintillation Cocktail (Research Products International Corporation, Mount Prospect, IL). Signals for each fraction were quantified with scintillation counter and the percentage of signal in each fraction was calculated.
PCR Readout
The beads were resuspended in 25 μL of 1× TBE buffer and incubated at 95°C for 15 min to elute the retained DNA. This disrupted protein-DNA complexes without affecting biotin-streptavidin binding. With the magnet applied, eluted DNA molecules were recovered in the supernatant for PCR readouts.
PCR and parallel analysis
For parallel analyses, two different primer sets were designed resulting in different length PCR products for recovered NF-κB and Ap1 probes and primers’ sequences are listed in Table S2, Electronic Supplementary Material. Eluted DNA probes (1 μl of 25 μl) were mixed with Ap1 and NF-κB primer sets at 500 nM each and amplified for 20 cycles with Taq DNA Polymerase (New England Biolabs, Ipswich, MA) in 50μl reactions. The PCR program was: 95°C for 30 s (melting), 61°C for 30 s (annealing), and 72°C for 10 s (extension). 12 μl of PCR product was mixed with 4 μl of gel loading buffer, and 14 μl was loaded onto native 4-20% TBE gels. Gels were run at 300 V for 20 min on ice, stained with SYBR Gold (Invitrogen, Carlsbad, CA), and visualized with UV light in a ChemiDoc XRS System (Bio-Rad, Hercules, CA).
TF biotinylation
Transcription factors in nuclear extracts were biotin labeled chemically by EZ-Link-Iodoacetyl-PEG2-biotin (Pierce, Rockford, IL), according to the manufacturer’s instructions. Briefly, pure proteins/nuclear extracts were mixed with EZ-Link-Iodoacetyl-PEG2-biotin in reaction buffer (50 mM Tris-HCl, 5 mM EDTA, pH 8.0) at room temperature for 90 min. Unincorporated biotin molecules were removed with G-50 Sephadex columns (Roche Applied Science, Indianapolis, IN). Sephadex columns were washed three times with PBS prior to use.
DNA probe preparation and radiolabeling
All ssDNA probes were purchased from Integrated DNA Technology (Coralville, IA), and their sequences are listed in Table S2, Electronic Supplementary Material. Probes were hybridized by mixing the same amounts of complementary sequences in 1× STE buffer (10 mM Tris, 100 mM NaCl, and 1 mM EDTA), heating to 95°C for 5 min, followed by incubation at room temperature for 1 hour. These dsDNA probes were 5′-radiolabeled with 10 pmoles of [γ-33P] ATP using T4 polynucleotide kinase (New England Biolabs, Ipswich, MA); free radioactive ATP molecules were removed by G-25 Sephadex columns (Roche Applied Science, Indianapolis, IN).
Cell culture
The human breast cancer cell line, MDA-MB-231, was obtained from Dr. Kathleen Gallo in Michigan State University. The cells were cultured in Dulbecco’s Modified Eagle Medium (Gibco BRL, Grand Island, NY) with 10% fetal bovine serum, 2 mM glutamine, 100 μg/mL streptomycin and 100 U/mL penicillin. Cells were maintained at 37°C and 10% CO2 as described in [24]. IKK inhibitor VII (EMD Millipore, Billerica, MA) and recombinant human TNF–α (R&D system, Minneapolis, MN) were used at the concentrations of 100 nM and 30 ng/ml, respectively. The cells were treated with IKK inhibitor VII or TNF–α for 2hr.
Nuclear extraction
Nuclear extraction was performed according to a protocol described by Lee [25]. Briefly, cells were washed with PBS, then suspended and allowed to swell in buffer A (10 mM HEPES (pH=8.0), 1.5 mM MgCl2, 10 mM KCl, protease inhibitor) on ice for 15 min. The cells were then lysed with a 25-gauge, 5/8 inch needle, and the nuclear pellets were collected by centrifugation. Nuclear pellets were re-suspended and incubated in buffer B (20 mM HEPES (pH=8.0), 1.5 mM MgCl2, 25% glycerol, 420 mM NaCl, 0.2 mM EDTA (pH=8.0), protease inhibitor) on ice for 30 min. After incubation, nuclear extracts (supernatants) were obtained by centrifugation at 12,000 g for 5 minutes.
Western blotting
The protein concentration of nuclear extracts was determined by Bradford assay (Bio-Rad, Hercules, CA) as described by Zhang [26]. Immunoblot was performed according to Liu [27]. Briefly, 30 μg protein samples were loaded and separated by 10% Tris-HCl gel, and transferred to nitrocellulose membrane. Membranes were blocked with 5% BSA in 0.05% Tween 20-TBS (Tris buffered saline) (USB corporation, Fremont, CA) for 1 h. at room temperature. Primary antibodies, p50 (Cell signaling, Danvers, MA; diluted 1:500 in 5% BSA/0.05% Tween 20-TBS), c-Jun (Santa Cruz Biotechnology, Santa Cruz, CA; diluted 1:500 in 5% BSA/0.05% Tween 20-TBS), or TBP (Sigma, St. Louis, MO; diluted 1:1000 in 5% BSA/0.05% Tween 20-TBS), were incubated at 4°C overnight. Anti-mouse or anti-rabbit HRP-conjugated secondary antibody (Thermo Scientific, Asheville, NC; diluted 1:1000 times in 5% non-fat milk/0.05% Tween 20-TBS), was then added for 1 h at room temperature. After washing with Tween 20-TBS, blots were visualized by SuperSignal West Femto maximum sensitivity substrate (Thermo Scientific, Logan, UT), according to the manufacturer’s instructions.
RESULTS AND DISCUSSION
In conceiving our experimental approach, we sought a method that would be sensitive, quantitative, flexible, and scalable. In all cases, the goal was to use the presence of a TF’s consensus DNA as proxy readout for the presence of the TF, given the far greater ease of parallel readouts of nucleic acids relative to proteins. Moreover, we wanted the assay to operate in the solution phase, as solution phase approaches are more flexible in how they are expanded and provide more opportunities when considering how to perform separations, a critical part of these types of experimental tools, especially considering the wide range of sizes and pI values among TFs.
With these considerations in mind, we developed an assay that relies on bead-based immobilization of all of the proteins in the sample to be analyzed, allowing solution phase recovery of bound DNAs for subsequent analyses. In our approach, we first biotinylate all of the proteins in the sample (Figure 1) followed by immobilization on streptavidin-coated magnetic beads. Followed by washes, bound DNA is then eluted for analysis. In this way, we control the sensitivity and the rate of false positives through the stringency of our wash steps. Using the DNA as the readout also allows for PCR amplification to enhance the detection limit of the approach. The fidelity of the assay depends on efficient and uniform biotinylation of all TFs in a sample. While many approaches exist for post hoc biotinylation of proteins [28], we chose to target cysteines for the TFs we studied here, NF-κB and Ap1. In the event that cysteines are involved in DNA recognition for other TFs, in particular zinc finger TFs [29], alternative biotinylation methods could be examined.
Recombinant TF Measurements
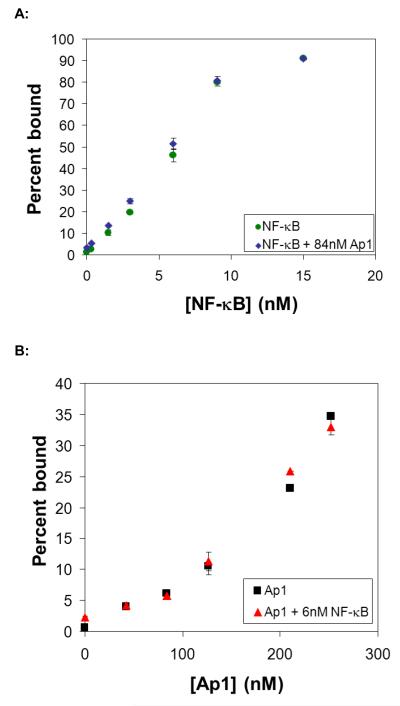
To validate the assay, we first attempted to detect pure proteins, NF-κB (p50) and Ap1 (c-Jun), in buffered solution. Biotinylation and immobilization were analyzed by western blot and Bradford assay, showing that the vast majority of proteins (~90% of total proteins based on Bradford and Western) were biotinylated and bound to the beads (Figure S2, Electronic Supplementary Material). The DNA binding properties of the biotinylated proteins were tested by EMSA and compared to unbiotinylated proteins, showing no difference between the biotinylated and native TFs (Figure S3, Electronic Supplementary Material). DNA probes (containing the consensus sequences for NF-κB, Ap1, and TFIID, as well as a scrambled negative control (NC); sequences available in Table S2, Electronic Supplementary Material) were mixed with TF coated magnetic beads. Either radiolabeled NF-κB probe was mixed with unlabeled Ap1, TFIID, and negative control probes (Figure 2A), or radiolabeled Ap1 probe was mixed with unlabeled NF-κB, TFIID and negative control probes (Figure 2B). Our results showed the expected increasing signal with increasing protein concentration for both proteins. The detection limits for NF-κB and Ap1 were 1.5 nM and 40 nM, respectively, reflecting the lower affinity of Ap1 for its consensus sequence (~300 nM) relative to NF-κB (~8 nM).
Figure 2. Detection of pure proteins alone and in the presence of a non-specific competitor.
(A) Detection of NF-κB:DNA complex with increasing amounts of NF-κB protein in the absence (green circles) or presence (blue diamonds) of Ap1. NF-κB protein was biotinylated, immobilized on the beads, and a mixture of DNA probes (radiolabeled NF-κB probe mixed with unlabeled Ap1, TFIID, and negative control probes) were mixed with TF-coated magnetic beads. The percentage of radiolabeled NF-κB probe remaining on the beads (relative to signal that did not bind or was washed from the beads) was plotted with respect to protein concentration. (B) Detection of Ap1:DNA complex with increasing amounts of Ap1 protein in the absence (black squares) or presence (red triangles) of NF-κB. Ap1 protein was biotinylated, immobilized on the beads, and a mixture of DNA probes (radiolabeled Ap1 probe mixed with unlabeled NF-κB, TFIID, and negative control probes) were mixed with TF-coated magnetic beads. The percentage of radiolabeled Ap1 probe remaining on the beads (relative to signal that did not bind or was washed from the beads) was plotted with respect to protein concentration. If not visible, error bars are within the plot symbol.
In our affinity-based detection scheme, the detection sensitivity, which is at best the concentration of DNA:TF complexes formed, depends on the concentrations of DNA probe and TF and their binding affinity (KD). For our approach, a balance must be struck between sensitivity and ease of separation. Maximal sensitivity is best achieved using DNA probe concentrations above the KD and greatly above the anticipated TF concentrations (see derivation in Electronic Supplementary Material). However, as the DNA concentrations increase, the fraction of DNA probes bound by TF decreases, resulting in a more challenging separation problem; in other words, the number of free DNA probes approaches 100% of the total DNA. For our proof-of-principle experiments, we chose to operate in the regime where the TF was in excess, minimizing false positives and simplifying the separation process, but potentially limiting sensitivity.
Nonetheless, consideration of the differences in affinity for various DNA:TF pairs is important when trying to design the approach for maximal sensitivity for all TFs in a parallel implementation. The flexibility of a solution-phase assay, as opposed to an array-based approach, would allow us to adjust the concentrations of our DNA probes to maximize the sensitivity for any TF. Specifically, we can increase, if needed, the concentration of DNA probes for TFs with lower affinity for their consensus sequences, thereby increasing the number of DNAs bound by these TFs and improving our sensitivity for them. The KD values for TF-DNA complexes can vary but are typically in the nanomolar range. We have measured the KD values of NF-κB and Ap1 to be 8 nM and 300 nM, respectively (data not shown). Additionally, we could include multiple copies of a given consensus sequence within a probe as an alternative means of increasing the effective concentration of the probe. With that said, our assay in its current form can detect NF-κB, the TF for which the majority of data exists, with sensitivity ~3-10 times greater than current approaches [20,22]. We anticipate being able to achieve similar sensitivity gains for all TFs being measured.
In addition to sensitivity, it is critical that parallel measurements can be made with high fidelity and little to no cross-reactivity, where a TF binds to a DNA or DNAs other than the probe with its unique consensus sequence. We wanted to establish the fidelity of our assay through comparison of the recovered DNA for the single TF measurements versus measurement of one TF in the presence of the other (Figure 2). The close correlation of the signals from these two studies establishes that our approach, at least for this pair of proteins, shows good fidelity for each TF. Clearly, this does not establish the fidelity for measurements examining even just tens of TFs, but it does give us confidence that the interactions we are measuring are specific and that the potential for expansion to broader parallel analyses exists.
Measuring TFs in nuclear extracts
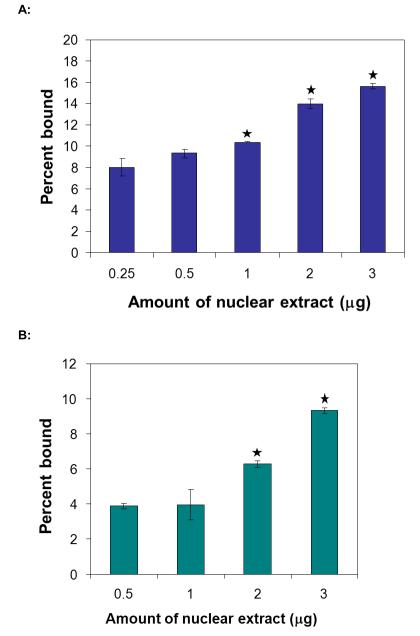
While measurements of pure proteins, whether alone or in parallel, are useful for establishing the feasibility of the approach, it is critical to test the approach in the realistic context of nuclear extracts. We chose to examine nuclear extracts predicated on the assumption that TFs present in the nucleus are active and, ultimately, tell us more about cell function than whole cell or cytoplasmic levels of TFs. We first analyzed NF-κB and Ap1 levels in nuclear extracts from breast cancer cells in culture. For both proteins, the measured protein quantity scaled with increasing quantity of nuclear extract (Figure 3). It is important to note that our assay detected NF-κB levels in only 500 ng nuclear extracts, or what would be obtained from approximately 105 cells. For comparison, commercial assays typically require 5 μg of nuclear extracts; thus, our assay is 10 fold more sensitive relative to those assays [20,21].
Figure 3. Detection of single TFs in nuclear extracts.
Detection of NF-κB:DNA complex (A) or Ap1:DNA complex (B) with increasing amounts of nuclear extracts. TFs in nuclear extract were biotinylated, immobilized on the beads, and a mixture of DNA probes (radiolabeled NF-κB (A) or radiolabeled Ap1 (B) probe mixed with unlabeled TFIID, negative control, and Ap1 (A) or NF-κB (B) probes) were mixed with TF-coated magnetic beads. The percentage of radiolabeled NF-κB (A) or radiolabeled Ap1 (B) probe remaining on the beads (relative to signal that did not bind or was washed from the beads) was plotted with respect to the initial amount of nuclear extract analyzed. Background signal obtained from experiments using 0 μg of nuclear extract has been subtracted from all points. (n = 3; * indicates p < 0.07 for NF-κB and p < 0.1 for Ap1)
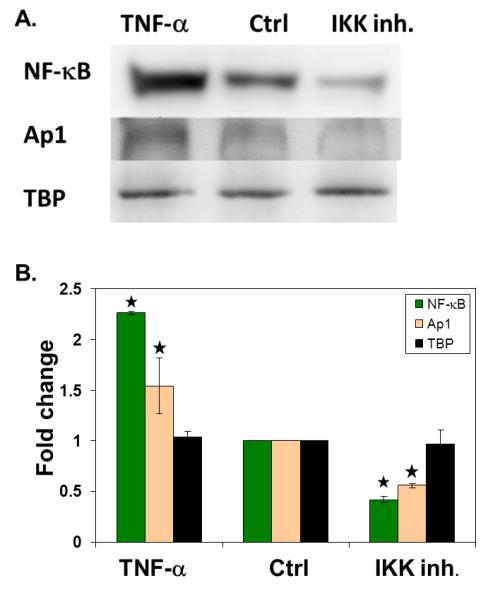
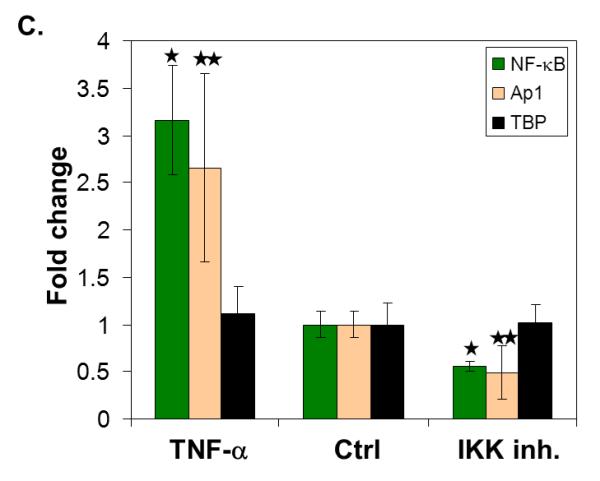
Given our success in analyzing a dose responsive signal for the proteins we measured, we wanted to test our approach against a stimulus where the impact on the TFs would be due to a biological response. For these studies, the same breast cancer cell line was treated with either TNF-α at 30 ng/ml for 2 hours or IKK inhibitor VII at 100 nM for 2 hours. We anticipated that these would increase and decrease levels of NF-κB in the nuclear extracts, respectively [30, 31]. NF-κB, Ap1, and TBP (as a control TF) levels in these treated cells and control samples were analyzed both with western blot and our assay. By both western blot and our technique, NF-κB levels were found to be roughly two fold higher in TNF-α treated extracts and two fold lower in IKK inhibited extracts, relative to control extracts (Figure 4). Ap1 levels were 1.5 times higher in TNF-α treated extracts and two fold lower in IKK inhibited extracts, relative to control extracts. As expected, TBP levels were unchanged in the extracts, again as measured by both our technique and western.
Figure 4. Quantification of TF levels in nuclear extracts after cell stimulation.
(A) Representative western blot showing detection of NF-κB, Ap1, and TBP in nuclear extracts after stimulation of the cultured cells with TNFα (TNFα), no treatment (ctrl), or inhibition of IKK (IKK inh.). The fold change in signal (ratio of sample to control) was plotted for each sample. (B) Quantification of the western blots for each protein. (n = 2) (C) TF levels measured by our technique. (n = 3) (* indicates p < 0.04 and ** indicates p < 0.15)
In addition to the successful measurement of NF-κB and Ap1 levels relative to control samples, our method allows us to estimate the absolute quantity of TF molecules in the sample. By comparison of the recovered DNA quantities of our samples relative to our standard curves, we estimate the number of NF-κB and Ap1 molecules in 2 μg nuclear extracts to be 10−13 moles and 4×10⁻¹² moles, respectively. Based on the 105 cells used in our tests, this translates to 6×10⁵ NF-κB molecules/nucleus and 2.5×10⁷ Ap1 molecules/nucleus.
Parallel TF measurements in nuclear extracts
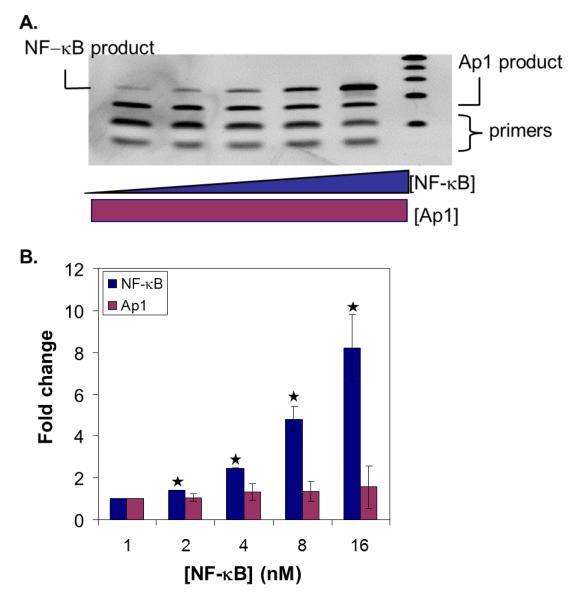
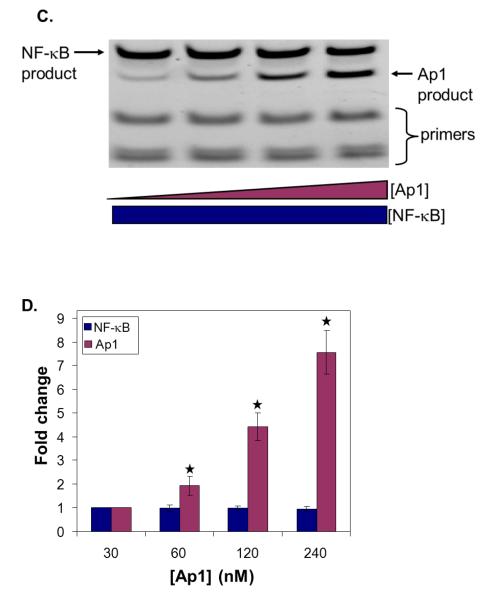
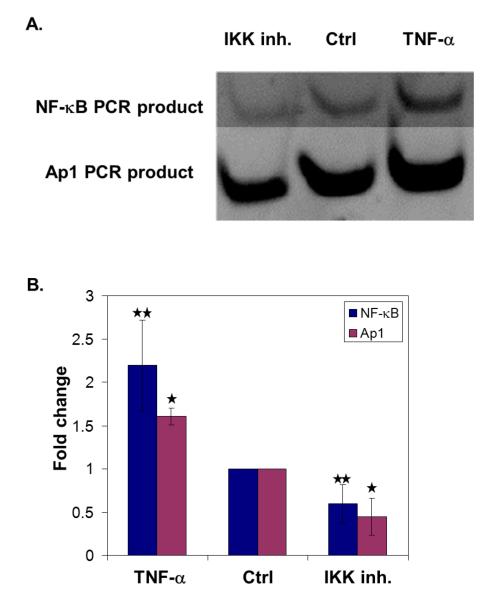
To test the feasibility of parallel TF measurements, we wanted to use a PCR-based readout that would mirror potential future applications. In this case, we designed different length primers that would yield PCR products of unique length following amplification of the recovered DNA for each TF. The PCR products were then visualized and quantified after simultaneous separation by gel electrophoresis. We limited our PCRs to 20 cycles and confirmed that the products were not saturated (data not shown). As such, quantitative comparisons of the relative amounts of PCR product could be made using gel quantification. While we recognize that this type of PCR readout cannot be used for parallel measurements of many TFs, it is sufficient for our parallel measurements of two molecules. As before, we first confirmed the viability of this readout strategy with pure proteins (Figure 5). In our two tests, one protein was held constant while the other protein concentration was varied. In each test (Figures 5A and 5C), the PCR product obtained for each protein was proportional to the initial quantity of protein. We then applied our parallel approach to the IKK inhibited, control, and TNF-α stimulated nuclear extracts. The parallel analyses agree well with our single protein measurements (Figure 6). Amplification by PCR improves our detection limit by ~200 fold over currently available techniques. With the success of these experiments, we have demonstrated proof-of-concept for our approach to TF measurements that meets our requirements for flexibility, scalability, and sensitivity.
Figure 5. Parallel TF readout by PCR readout.
NF-κB and Ap1 PCR products of 62 bp and 40 bp, respectively, were analyzed by gel electrophoresis. Representative images are shown. 25 bp marker was also loaded for reference. (A) The amount of Ap1 was kept constant (120 nM) while the amount of NF-κB was increased (1 – 16 nM). Eluted DNA from each sample was amplified with PCR and loaded into the gel. (B) Quantification of the gel images (n = 3). Band intensities were quantified with Quantity One software and the ratio of band intensity to intensity of DNA at the lowest NF-κB concentration was plotted. (C) The amount of NF-κB (8 nM) was kept constant while the amount of Ap1 was increased (30-240 nM). Eluted DNA from each sample was amplified with PCR and loaded into the gel (D) Quantification of the corresponding gel images (n = 3). Band intensities were quantified with Quantity One software and the ratio of band intensity to intensity of DNA at lowest Ap1 concentration was plotted. (* indicates p < 0.015)
Figure 6. Parallel TF analysis in nuclear extracts after cell stimulation.
After treatment of cells with an IKK inhibitor (IKK inh.) or TNFα, nuclear extracts were analyzed for NF-κB and Ap1 levels. A. PCR analysis by electrophoresis, representative gel. Contrast was adjusted for NF-κB part of the gel for better visualization. B. Quantification of the corresponding gel images (n = 3). Band intensities were quantified with Quantity One software and ratio of sample to control was plotted. (* indicates p<0.07 and ** indicates p<0.13)
Nonetheless, our approach is still in development. In the near term, we are in the process of expanding the number of TFs we can measure in parallel. In this way, we will be able to investigate new biological phenomena where we will not necessarily have a clear expectation of the effect on all the TFs being measured. As we increase the number of TFs being measured, we will have to increase the total concentration of the DNA probes added to each sample. This has the potential to increase the frequency of non-specific interactions between the proteins and DNAs as well as among the various DNA sequences. We will continue to evaluate the stringency of our wash steps to maximize the accuracy of our approach at higher parallelism.
That said, perhaps the most critical factor in determining the feasibility of our assay in a parallel format is the fidelity of the interaction between a protein and its consensus sequence. In particular, many TFs are grouped in families that have highly similar consensus sequences [32]. For these, we will interpret data for a given consensus sequence as being indicative of higher levels of protein for the family of TFs. It would then be necessary to come back with a secondary approach (e.g., an antibody-based method) to identify the TFs with greater specificity.
CONCLUSION
We have developed a scalable, flexible, and sensitive approach for the analysis of TF levels. We have successfully analyzed NF-κB and Ap1 in purified samples and nuclear extracts, alone and in parallel, with improved sensitivity over existing approaches. Going forward, we anticipate that our method when further developed will provide an additional tool to enable scientists to understand cellular processes in response to stimuli, leading to improved disease diagnoses and accelerating therapeutic development.
Supplementary Material
ACKNOWLEDGMENTS
We thank all the members of the Cellular and Biomolecular Laboratory (http://www.egr.msu.edu/cbl/) for their advice and support. Financial support for this work was provided in part by Michigan State University, the National Science Foundation (CBET 0941055), the National Institutes of Health (GM079688, RR024439, GM089866, DK081768, DK088251), the Michigan Universities Commercialization Initiative (MUCI), and the Center for Systems Biology.
REFERENCES
- 1.Orphanides G, Reinberg D. A unified theory of gene expression. Cell. 2002;108(4):439–451. doi: 10.1016/s0092-8674(02)00655-4. [DOI] [PubMed] [Google Scholar]
- 2.Babu MM. Structure, evolution and dynamics of transcriptional regulatory networks. Biochemical Society Transactions. 2010;38:1155–1178. doi: 10.1042/BST0381155. [DOI] [PubMed] [Google Scholar]
- 3.Emerson BM. Specificity of gene regulation. Cell. 2002;109(3):267–270. doi: 10.1016/s0092-8674(02)00740-7. [DOI] [PubMed] [Google Scholar]
- 4.Mees C, Nemunaitis J, Senzer N. Transcription factors: their potential as targets for an individualized therapeutic approach to cancer. Cancer Gene Therapy. 2009;16(2):103–112. doi: 10.1038/cgt.2008.73. [DOI] [PubMed] [Google Scholar]
- 5.Nebert DW. Transcription factors and cancer: an overview. Toxicology. 2002;181:131–141. doi: 10.1016/s0300-483x(02)00269-x. [DOI] [PubMed] [Google Scholar]
- 6.Latchman DS. Mechanisms of disease - Transcription-factor mutations and disease. New England Journal of Medicine. 1996;334(1):28–33. doi: 10.1056/NEJM199601043340108. [DOI] [PubMed] [Google Scholar]
- 7.McCulley DJ, Black BL. Transcription factor pathways and congenital heart disease. Current Topics in Developmental Biology. 2012;100:253–277. doi: 10.1016/B978-0-12-387786-4.00008-7. [DOI] [PMC free article] [PubMed] [Google Scholar]
- 8.Barnes PJ. Transcription factors in airway diseases. Laboratory Investigation. 2006;86(9):867–872. doi: 10.1038/labinvest.3700456. [DOI] [PubMed] [Google Scholar]
- 9.Johnson DS, Mortazavi A, Myers RM, Wold B. Genome-wide mapping of in vivo protein-DNA interactions. Science. 2007;316(5830):1497–1502. doi: 10.1126/science.1141319. [DOI] [PubMed] [Google Scholar]
- 10.Berger MF, Bulyk ML. Universal protein-binding microarrays for the comprehensive characterization of the DNA-binding specificities of transcription factors. Nature Protocols. 2009;4(3):393–411. doi: 10.1038/nprot.2008.195. [DOI] [PMC free article] [PubMed] [Google Scholar]
- 11.Nishiyama A, Xin L, Sharov AA, Thomas M, Mowrer G, Meyers E, Piao YL, Mehta S, Yee S, Nakatake Y, Stagg C, Sharova L, Correa-Cerro LS, Bassey U, Hoang H, Kim E, Tapnio R, Qian Y, Dudekula D, Zalzman M, Li MX, Falco G, Yang HT, Lee SL, Monti M, Stanghellini I, Islam MN, Nagaraja R, Goldberg I, Wang WD, Longo DL, Schlessinger D, Ko MSH. Uncovering Early Response of Gene Regulatory Networks in ESCs by Systematic Induction of Transcription Factors. Cell Stem Cell. 2009;5(4):420–433. doi: 10.1016/j.stem.2009.07.012. [DOI] [PMC free article] [PubMed] [Google Scholar]
- 12.Matys V, Fricke E, Geffers R, Gossling E, Haubrock M, Hehl R, Hornischer K, Karas D, Kel AE, Kel-Margoulis OV, Kloos DU, Land S, Lewicki-Potapov B, Michael H, Munch R, Reuter I, Rotert S, Saxel H, Scheer M, Thiele S, Wingender E. TRANSFAC (R): transcriptional regulation, from patterns to profiles. Nucleic Acids Research. 2003;31(1):374–378. doi: 10.1093/nar/gkg108. [DOI] [PMC free article] [PubMed] [Google Scholar]
- 13.Matys V, Kel-Margoulis OV, Fricke E, Liebich I, Land S, Barre-Dirrie A, Reuter I, Chekmenev D, Krull M, Hornischer K, Voss N, Stegmaier P, Lewicki-Potapov B, Saxel H, Kel AE, Wingender E. TRANSFAC (R) and its module TRANSCompel (R): transcriptional gene regulation in eukaryotes. Nucleic Acids Research. 2006;34:D108–D110. doi: 10.1093/nar/gkj143. [DOI] [PMC free article] [PubMed] [Google Scholar]
- 14.Ruscher K, Reuter M, Kupper D, Trendelenburg G, Dirnagl U, Meisel A. A fluorescence based non-radioactive electrophoretic mobility shift assay. Journal of Biotechnology. 2000;78(2):163–170. doi: 10.1016/s0168-1656(00)00207-8. [DOI] [PubMed] [Google Scholar]
- 15.Bronstein I, Fortin J, Stanley PE, Stewart G, Kricka LJ. Chemiluminescent and bioluminescent reporter gene assays. Analytical Biochemistry. 1994;219(2):169–181. doi: 10.1006/abio.1994.1254. [DOI] [PubMed] [Google Scholar]
- 16.Benotmane AM, Hoylaerts MF, Collen D, Belayew A. Nonisotopic quantitative analysis of protein-DNA interactions at equilibrium. Analytical Biochemistry. 1997;250(2):181–185. doi: 10.1006/abio.1997.2231. [DOI] [PubMed] [Google Scholar]
- 17.Shen Z, Peedikayil J, Olson GK, Siebert PD, Fang Y. Multiple transcription factor profiling by enzyme-linked immunoassay. Biotechniques. 2002;32(5):1168. doi: 10.2144/02325dd07. + [DOI] [PubMed] [Google Scholar]
- 18.Li XQ, Jiang X, Yaoi T. High throughput assays for analyzing transcription factors. Assay and Drug Development Technologies. 2006;4(3):333–341. doi: 10.1089/adt.2006.4.333. [DOI] [PubMed] [Google Scholar]
- 19.Romanov S, Medvedev A, Gambarian M, Poltoratskaya N, Moeser M, Medvedeva L, Diatchenko L, Makarov S. Homogeneous reporter system enables quantitative functional assessment of multiple transcription factors. Nature Methods. 2008;5(3):253–260. doi: 10.1038/nmeth.1186. [DOI] [PubMed] [Google Scholar]
- 20.Yaoi T, Jiang X, Li XQ. Development of a fluorescent micro sphere-based multiplexed high-throughput assay system for profiling of transcription factor activation. Assay and Drug Development Technologies. 2006;4(3):285–292. doi: 10.1089/adt.2006.4.285. [DOI] [PubMed] [Google Scholar]
- 21.Qiao JY, Shao W, Wei HJ, Sun YM, Zhao YC, Xing WL, Zhang L, Mitchelson K, Cheng J. Novel high-throughput profiling of human transcription factors and its use for systematic pathway mapping. Journal of Proteome Research. 2008;7(7):2769–2779. doi: 10.1021/pr700883t. [DOI] [PubMed] [Google Scholar]
- 22.Shao W, Wei HJ, Qiao JY, Zhao YC, Sun YM, Zhou YX, Cheng J. Parallel profiling of active transcription factors using an oligonucleotide array-based transcription factor assay (OATFA) Journal of Proteome Research. 2005;4(4):1451–1456. doi: 10.1021/pr050053l. [DOI] [PubMed] [Google Scholar]
- 23.Jiang X, Roth L, Lai CF, Li XQ. Profiling activities of transcription factors in breast cancer cell lines. Assay and Drug Development Technologies. 2006;4(3):293–305. doi: 10.1089/adt.2006.4.293. [DOI] [PubMed] [Google Scholar]
- 24.Wu M, Liu L, Chan C. Identification of novel targets for breast cancer by exploring gene switches on a genome scale. Bmc Genomics. 2011;12:19. doi: 10.1186/1471-2164-12-547. [DOI] [PMC free article] [PubMed] [Google Scholar]
- 25.Lee KAW, Bindereif A, Green MR. A small-scale procedure for preparation of nuclear extracts that support efficient transcription and pre-messenger RNA splicing. Gene Analysis Techniques. 1988;5(2):22–31. doi: 10.1016/0735-0651(88)90023-4. [DOI] [PubMed] [Google Scholar]
- 26.Zhang LX, Seitz LC, Abramczyk AM, Liu L, Chan C. cAMP initiates early phase neuron-like morphology changes and late phase neural differentiation in mesenchymal stem cells. Cellular and Molecular Life Sciences. 2011;68(5):863–876. doi: 10.1007/s00018-010-0497-1. [DOI] [PMC free article] [PubMed] [Google Scholar]
- 27.Liu L, Martin R, Chan C. Palmitate-activated astrocytes via serine palmitoyltransferase increase BACE1 in primary neurons by sphingomyelinases. Neurobiol Aging. 2012 doi: 10.1016/j.neurobiolaging.2012.05.017. Doi:10.1016/j.neurobiolaging.2012.05.017. [DOI] [PMC free article] [PubMed] [Google Scholar]
- 28.Bayer EA, Wilchek M. Protein biotinylation. Methods in Enzymology. 1990;184:138–160. doi: 10.1016/0076-6879(90)84268-l. [DOI] [PubMed] [Google Scholar]
- 29.Pavletich NP, Pabo CO. Zinc finger DNA recognition –crystal- structure of a ZIF268-DNA complex at 2.1-A. Science. 1991;252(5007):809–817. doi: 10.1126/science.2028256. [DOI] [PubMed] [Google Scholar]
- 30.Kim HJ, Hawke N, Baldwin AS. NF-kappa B and IKK as therapeutic targets in cancer. Cell Death and Differentiation. 2006;13(5):738–747. doi: 10.1038/sj.cdd.4401877. [DOI] [PubMed] [Google Scholar]
- 31.van Horssen R, ten Hagen TLM, Eggermont AMM. TNF-alpha in cancer treatment: Molecular insights, antitumor effects, and clinical utility. Oncologist. 2006;11(4):397–408. doi: 10.1634/theoncologist.11-4-397. [DOI] [PubMed] [Google Scholar]
- 32.Kielbasa SM, Gonze D, Herzel H. Measuring similarities between transcription factor binding sites. Bmc Bioinformatics. 2005;6:11. doi: 10.1186/1471-2105-6-237. [DOI] [PMC free article] [PubMed] [Google Scholar]
Associated Data
This section collects any data citations, data availability statements, or supplementary materials included in this article.


