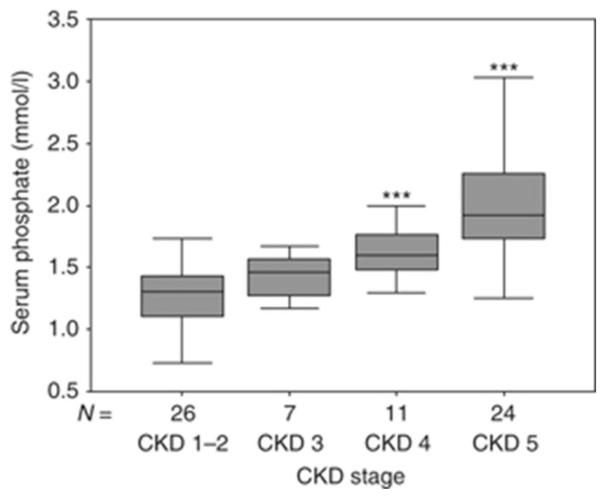
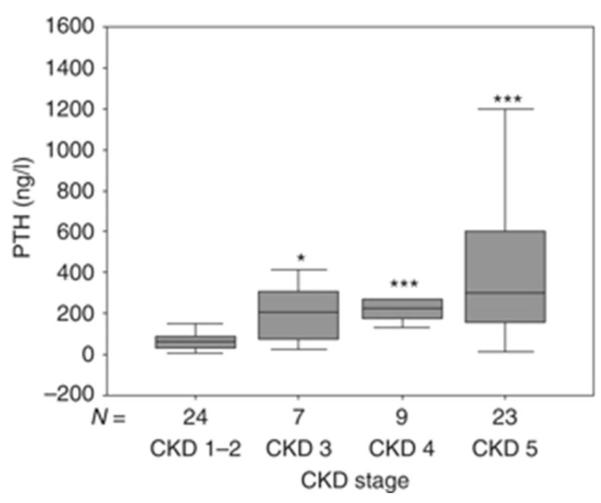
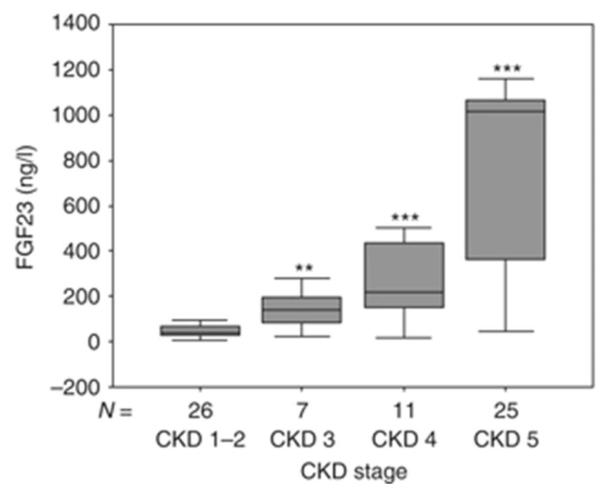
Fig. 1.
Serum values of phosphate (a), PTH (b), and FGF23 (c) in a cross-section of pediatric patients with pre-dialysis CKD. *P<0.01 CKD 1–2 vs. CKD 3, ***P<0.001 CKD 1–2 vs. CKD 4, ***P<0.001 CKD 1–2 vs. CKD 5. Boxes and bars represent the interquartile range and the median value, respectively; whiskers represent the distance to the smallest and largest unbooked sample value.


