

Abstract
A central and unresolved question in cancer is how deregulated signaling leads to acquisition of an invasive cellular phenotype. Here, we modeled the invasive transition as a theoretical switch between focal adhesions and extracellular matrix (ECM)-degrading invadopodia and built molecular interaction network models of each structure. To identify upstream regulatory hubs, we added first degree binding partners and applied graph theoretic analyses. Comparison of the results to clustered reverse phase protein array signaling data from head and neck carcinomas led us to choose phosphatidylinositol 3-kinase (PI3K) and protein kinase C alpha (PKCα) for further analysis. Consistent with a previous report, PI3K activity promoted both the formation and activity of invadopodia. Furthermore, PI3K induction of invadopodia was increased by overexpression of SH2 domain-containing inositol 5′-phosphatase 2 (SHIP2), suggesting that a major part of the mechanism is synthesis of PI(3,4,5)P3, a precursor for PI(3,4)P2, which promotes invadopodia formation. Knockdown of PKCα led to divergent effects on invadopodia formation, depending on the activation state of PI3K. Loss of PKCα inhibited invadopodia formation in cells with wild-type PI3K pathway status. Conversely, in cells with either activating PI3K mutants or lacking the endogenous opposing enzyme phosphatase and tensin homolog (PTEN), PKCα knockdown increased invadopodia formation. Investigation of the mechanism revealed that a negative feedback loop from PKCα dampened PI3K activity and invasive behavior in cells with genetic overactivation of the PI3K pathway. These studies demonstrate the potential of network modeling as a discovery tool and identify PI3K and PKCα as critical interacting regulators of invasive behavior.
Introduction
One of the hallmarks of cancer is the ability of cells to invade surrounding tissues and metastasize (1). A key component of tissue invasion is the ability to degrade extracellular matrix (ECM). At the cellular level, a switch to an ECM-degrading or invasive phenotype can be characterized as a shift in the dynamics and assembly of two cytoskeletal structures: focal contact-type adhesions and invadopodia, actin-rich cellular protrusions that serve as secretory sites for extracellular matrix (ECM)-degrading proteinases. Thus, noninvasive cancer cells tend to form more focal adhesions and do not form invadopodia, whereas invasive cancer cells form few focal adhesions and contain many invadopodia (2, 3). Invadopodia share various molecular components with focal adhesions; however, there are some major distinctions. Although both are actin-rich structures, focal adhesions link to unbranched actin-based stress fibers, require ongoing protein synthesis for their persistence, and generally are not thought to degrade ECM to a substantial extent ((4, 5)(6). By contrast, invadopodia are associated primarily with branched actin and components of the exocytic membrane trafficking machinery, do not require active protein synthesis to form, and aggressively degrade ECM (4, 5, 7). In normal cells that remodel tissue, similar structures to invadopodia called podosomes are formed (4, 5, 7).
The number of proteins that are involved in the formation of invadopodia and focal adhesions has expanded; however, little is known about the upstream signals that trigger formation of invadopodia instead of focal adhesions. Although expression of constitutively active Src can induce formation of invadopodia-like structures (often termed “invadosomes” (8)), Src is rarely mutated in human cancer; instead it is usually activated downstream of other signaling pathways (9, 10). Furthermore, active wild-type Src is typically associated with focal adhesions (11, 12), suggesting that additional molecular changes must occur to trigger assembly of invadopodia. Treatment of vascular smooth muscle cells with the conventional PKC activator and tumor promoter phorbol myristate acetate induces the formation of podosomes at sites of focal adhesion disassembly, suggesting a direct transition between the two structures that is induced by deregulated signaling (13). Nonetheless, our understanding of this invasive switch remains minimal due to the complexity of both structures and the signal inputs.
Intracellular signaling is carried out by the action of interconnected molecular networks that influence each other based on both network architecture and dynamic interactions between molecules (14, 15). Thus, the structure of a signaling network (the topology of molecules and their interactions) is an important determinant of information flow. Particular signaling networks contain certain highly connected molecules known as “hubs” (16). The activity or abundance (or both) of such hubs is potentially critical in determining whether upstream signaling will reach all or a selected set of downstream targets (17). Indeed, many oncogenes are network hubs (18). Thus, understanding the topology, composition and connectedness of molecular signaling networks that control the transition between focal adhesions and invadopodia could identify potential targets of therapeutic intervention to limit the formation of invadopodia and reduce tumor invasiveness.
In this study, we used a network modeling approach to identify key molecules and signaling states that drive the transition between focal adhesions and invadopodia. We built molecular interaction networks for focal adhesions and invadopodia based on lists of molecules derived from the literature and database-mining, and used a graph theoretic approach to identify regulatory signaling hubs of each network (16). The p85 subunit of PI3K and PKCα were identified as hubs for both focal adhesion and invadopodia networks. These two signaling molecules are deregulated in a wide variety of cancers (19, 20) and their role in the regulation of invadopodia formation is just beginning to be examined (21). Bioinformatics analysis of reverse phase protein array (RPPA) data from head and neck squamous cell carcinoma (HNSCC) tumor lysates revealed a signaling cluster associated with tumor recurrence that included both PI3K and PKCα-associated signaling pathway components. Simultaneous manipulations of PI3K activity and PKCα abundance in HNSCC cells revealed that PI3K promoted invadopodia formation and focal adhesion reorganization. However, inhibition of PKCα led to opposite effects on invadopodia formation and invasion through Transwell chambers depending on the PI3K activation status of the cancer cells, with the PI3K-high/PKCα-low signaling state leading to the most invasive phenotype. Live cell imaging studies revealed that loss of PKCα in PI3K mutant cells leads to increased formation and stability of invadopodia. Analysis of the ratio of PI(3,4,5)P3 to PI(4,5)P2 ratio in PI3K and PKCα-manipulated cells revealed a negative feedback loop from PKCα that dampens PI3K enzymatic activity in cells with overly active PI3K. Furthermore, expression of a non-phosphorylatable mutant of the p85 subunit of PI3K led to enhanced invadopodia formation, similar to the effect of PKCα-knockdown. These data identify PI3K and PKCα as major interacting regulators of the transition to an invasive phenotype, as characterized by shifts from focal adhesions to invadopodia.
Results
Network modeling of the focal adhesion–to-invadopodia switch identifies putative regulatory hubs
To understand signaling events that lead to invadopodia formation, we built two individual molecular network models that represent molecules associated with either focal adhesions or invadopodia. For the invadopodia network, we used GLAD4U software (http://bioinfo.vanderbilt.edu/glad4u) and the query term “invadopodia” to search PubMed and obtain a list of Entrez gene IDs associated with the retrieved publications. We then manually curated the list by removing any molecules that had not been localized to invadopodia by fluorescence imaging. The focal adhesion network list was obtained by manually curating a previously published list of “adhesome” molecules (22) to remove obvious podosome molecules that do not localize to conventional focal adhesions (for example, the Arp2/3 complex) (see Table S1 for both lists). Using Cytoscape (23) to mine the known protein-protein interactions in the Human Protein Reference Database (HPRD) database and protein-phosphatidylinositol lipid interactions from additional literature-derived lists (Table S2), we then derived the following molecular interaction networks: “invadopodia” (53 molecules, which are referred to as nodes in graph theory and 62 interactions), “focal adhesion” (150 nodes and 565 interactions), “focal adhesions and invadopodia” (any node in either list; 184 proteins and 663 interactions), and common nodes (only nodes present in both lists; 19 proteins and 27 interactions). Consistent with the previously identified importance of Src in invadopodia biology (7), Src is the most central hub in the invadopodia network as measured by degree centrality (number of interacting partners or degree = 15), followed by Nck1 (degree = 9), cortactin (CTTN) and neural Wiskott-Aldrich Syndrome protein (WASL) (degree = 8), and paxillin (PXN), FAK (PTK2), p130Cas (BCAR1), and integrin β1 (ITGB1) (all degree = 7) (Fig 1). This network represents the core machinery of invadopodia, because our criteria for inclusion in the network was that all molecules must be physically identifiable within invadopodia. Furthermore, both Src and cortactin are integral regulators of invadopodia: their removal leads to loss of invadopodia formation or activity (or both) (5, 7).
Fig 1. Src is the central hub of the invadopodia network.

Protein components were included in the literature-based invadopodia network if they have been detected in invadopodia puncta by immunofluorescence. Node coloration indicates degree of connectedness to other nodes with red indicating the highest degree of connectedness and blue indicating the lowest degree of connectedness.
To identify critical upstream signals that lead to invadopodia formation and potentially drive the transition from focal adhesions to invadopodia, we expanded the core invadopodia and focal adhesion networks by adding HPRD-derived direct interacting partners of the nodes in the core networks. This increased the size of the networks, as follows: invadopodia (959 nodes and 5278 interactions), focal adhesion (2127 nodes and 12767 interactions), focal adhesions and invadopodia (2288 proteins and 13512 interactions), and common nodes (667 proteins and 3671 interactions). To identify potentially critical regulators of the expanded networks, we searched for highly connected molecules (for example, hubs (24)) by performing the following centrality analyses for all the networks: degree, betweenness, stress, and sum of shortest paths (Fig. 2) (25, 26). These centrality analyses are based on graph theory and utilize slightly different criteria to rank nodes in terms of connectedness to other nodes in the defined network (25, 26). Degree is the number of direct interacting partners of a given node. Betweenness is the proportion of all shortest paths between 2 nodes going through a given node. Stress is the number of all of the shortest paths within the network going through a given node. Sum of shortest paths identifies nodes with the smallest sum of the shortest paths initiated to all other nodes in the network. Regardless of the networks analyzed, signaling nodes were overrepresented among the hubs, probably because they are generally highly connected molecules. Various signaling molecules, including SRC, EGFR, FYN, SHC1, GRB2, PIK3R1, PRKCA, and PRKCD, were in the top ten list of at least one centrality measure (Fig. 2), suggesting that they may be critical regulators of both focal adhesion and invadopodia and could mediate transition between the two structures. In addition, these centrality analyses identified proteins that could be highly central in one network, but not the other: CDC42, PTK2, and RAC1 for invadopodia and PRKACA, MAPK1, VIM, AKT1, ESR1, and YWHAG for focal adhesions. To evaluate the network-specific importance of each node to the focal adhesion or invadopodia networks, we also performed a random walk with restart analysis, which takes into consideration the global network structure by simulating a random walker’s behavior on a network (27, 28). Thus, each node in the network was ranked by comparing its overall proximity to nodes within the core focal adhesion or invadopodia networks to its proximity to randomly selected nodes in the global HPRD network (Table S3). Although both PIK3R1 and PRKCA were highly connected to focal adhesion and invadopodia networks, PIK3R1 was more highly connected to the invadopodia network (local p = 0.02 for invadopodia and 0.06 for focal adhesion) and PRKCA was more highly connected to the focal adhesion network (local p = 0.42 for invadopodia and 0.0045 for focal adhesion) when the global network was taken into account.
Fig 2. Centralities analysis of expanded networks.

Using the Centiscape plugin for Cytoscape and R, the top ten proteins were ranked according to centrality measurements: degree (the number of binding partners), betweenness (the proportion of all shortest paths between 2 nodes going through a given node), stress (the number of all of the shortest paths within the network going through a given node), and sum of shortest paths (SoSP, node with the smallest sum of the shortest paths initiated to all other nodes in the network).
PI3K and PKCα analytes form part of a molecular signature for a “poor prognosis” HNSCC subtype
To determine whether the hubs identified in our analysis were associated with aggressive behavior in human tumors, we examined the abundance of signaling phosphoproteins in 15 HPV-negative oropharynx head and neck squamous cell carcinoma (HNSCC) primary tumors using reverse phase protein lysate microarrays (RPPA; see Table S4 for the ~130 analytes examined and deidentified patient data) (29, 30). Patient samples were divided into recurrent or nonrecurrent groups and a subset of 30 analytes was selected based on highest correlation with tumor recurrence. Interestingly, among the 30 selected analytes were several focal adhesion-invadopodia network hubs, including PKCα, PI3K pathway signaling molecules (such as AKT and PTEN), and the active phosphorylated form of Src (pTyr416) (Fig 3). Tumor samples and analytes were then allowed to cluster in an unsupervised manner to identify groups of tumors that have similar signaling state relationships. In particular, there was a cluster of three patients with recurrent tumors that exhibited reduced abundance of AKT, PTEN and PKCα and increased abundance of active Src (pTyr416) and segregated distinctly away from patients without recurrent tumors (Box and asterisks, Fig 3). These results suggest that alterations in PKC, PI3K, and Src activity may be important modulators of head and neck tumor recurrence. Furthermore, because PTEN directly antagonizes the effects of PI3K, the low PTEN abundance in combination with low PKCα abundance could indicate a PI3K-high/PKCα-low signaling state. Although recurrence likely is a consequence of many biological processes, local tissue invasion has been correlated with tumor recurrence in several cancers (31, 32).
Fig 3. PI3K and PKCα analytes are included in a cluster of HPV-negative HNSCC associated with tumor recurrence.

Heatmap of analytes selected for correlation with “recurred” or “nonrecurred” status were subjected to unsupervised clustering. Red color indicates high and blue coloring indicates low abundance in comparison to the median for that analyte. A large box outlines the “recurrence cluster” and asterisks mark potential invadopodia-associated analytes.
Src is a well-known organizer of invadopodia and podosome formation (5, 7, 33, 34) and was the central hub of our invadopodia network (Fig 1). By contrast, PI3K has only recently been implicated in invasion and activity of invadopodia and podosomes (21, 35) and there is little understanding of how the switch in cytoskeletal structures is orchestrated. Likewise, PKCα signaling is thought to promote podosome formation along with focal adhesion disassembly (13, 36–38), but our RPPA data instead suggest that PKCα abundance or activity might be suppressed in aggressive cancers (which we presume would make more invadopodia). Therefore, the role of PKCα activity in invadopodia formation and associated invasive activity is unclear. In addition PI3K and PKCα appeared to be coordinately regulated in human tumors because they clustered together. We therefore set out to test whether combinations of PI3K and PKCα activities might regulate invasive activity and specifically affect focal adhesion-invadopodia transitions.
PI3K signaling promotes invadopodia formation
To test whether PI3K signaling could affect invadopodia formation and activity in HNSCC cells, we carried out experiments in which we inhibited PI3K in HNSCC cells with the drug LY294002. LY294002 treatment of SCC61 cells significantly reduced both invadopodia numbers and invadopodia-associated ECM degradation (Fig 4). LY294002 treatment of a second HNSCC cell line, SCC25, also reduced both invadopodia activity and numbers, although the effect on invadopodia numbers was not statistically significant due to the low basal number formed by this cell line (Fig S1). Inhibition of PI3K by LY294002 also affected the organization of focal adhesion structures in SCC61 cells. Analysis of focal adhesion number and size revealed a significant decrease in the number of central focal adhesions in SCC61 cells treated with increasing concentrations of LY294002 (Fig 4). Changes in peripheral focal adhesion number (Fig 4) or in focal adhesion size (Fig S2) were more variable and minor and a statistically significant increase in focal adhesion number was only observed with 12.5 μM LY294002. Although the E542K oncogenic mutant of PIK3CA (the p110α catalytic subunit of PI3K) is present in SCC61 cells, SCC25 cells do not have identifiable PI3K mutations (39). We therefore expressed the E545K and H1047R mutant PIK3CA subunits (both are common hot spot mutations seen in cancers that are activating) in SCC25 cells (Fig S3) to determine the impact of directly activating PI3K on the focal adhesion-to-invadopodia transition. Consistent with the drug inhibition studies, SCC25 cells expressing active PI3K mutant constructs showed increased invadopodia numbers and activity, compared with controls (Fig 5). Expression of active PI3K mutants also led to a significant decrease in the number of peripheral focal adhesions but not in the number of of central focal adhesions (Fig 5). The sizes of both central and peripheral focal adhesions were reduced in PI3K mutant-expressing cells (Fig S2). These results confirm that PI3K affects the organization of both invadopodia and focal adhesions and are consistent with PI3K as a driver of cellular focal adhesion-to-invadopodia transitions.
Fig 4. Inhibition of PI3K leads to a decrease in invadopodia and central focal adhesion number.
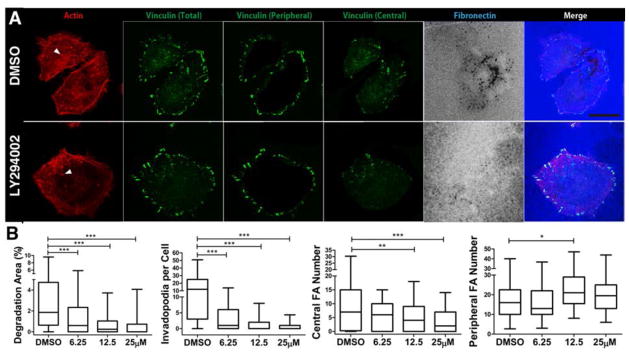
A. Images of SCC61 HNSCC cells treated with diluent control (“DMSO”) or 25 μM LY294002. Arrowheads point to example invadopodia. B. Quantitation of invadopodia-mediated ECM degradation area/cell area, number of invadopodia per cell, and numbers of central or peripheral focal adhesion per cell. n≥110 cells per cell line from 3 independent experiments. Scale bar = 20 μm. *p<0.05; **p<0.01; ***p<0.001.
Fig 5. PKCα inhibition leads to divergent invadopodia phenotypes, depending on PI3K mutant status.

A. Merged images of invadopodia (red; actin) and focal adhesions (green; vinculin) from SCC25 cells expressing empty vector (Control), or PI3K mutants (E545K, H1047R) with or without knockdown of PKCα (PKCα siRNA). Arrows point to focal adhesion belts surrounding invadopodia clusters. Matching fibronectin images are in Fig S3. B. Analyses of invadopodia and focal adhesion. n≥50 cells per cell line from 3 independent experiments. Scale bar = 20 μm. *p<0.05; **p<0.01; ***p<0.001.
SHIP2 overexpression promotes invadopodia formation in a PI3K-dependent manner
Because of the high degree of connectedness of the p85 subunit (PI3KR1), various PI3K binding partners and effectors could regulate focal adhesions to invadopodia transitions (Fig 2, Table S3). However, we hypothesized that the lipid products of PI3K themselves might promote a switch in the cytoskeletal structures based on the importance of phosphatidylinositol (PI) lipids in recruiting cytoskeletal proteins to cellular membranes (40). In particular, PI(3,4)P2 is associated with formation of podosomes and can be synthesized from the precursor lipid PI(3,4,5)P3 which is formed by class IA PI3Ks (35, 41). To test whether specific PI lipids are significantly associated with focal adhesion or invadopodia network nodes as compared to association with the entire HPRD network, we performed a Fisher’s exact statistical test on the focal adhesion or invadopodia and first neighbors networks (Fig. 6, Tables S1 and S2). Although PI(4,5)P2, PI(3,4,5)P3, and PI(3,4)P2 were each significantly associated with focal adhesion proteins (either directly or through one other molecule, such as a 2-connection depth of interaction), only the downstream PI3K products PI(3,4,5)P3 and PI(3,4)P2 were significantly associated with invadopodia proteins (Fig 6A, B). In addition, the late endosomal lipid PI(3,5)P2 was also significantly associated with the invadopodia and first neighbors network, which may reflect the role of late endocytic trafficking in proteinase delivery to invadopodia (42–44).
Fig 6. PI metabolism promotes switching between cytoskeletal structures.

A. Pie chart diagram of network analysis indicating the interaction of focal adhesion (green), or invadopodia (blue) molecules with selected phosphatidylinositol species (PIs). B. Fisher’s exact test of node enrichment in the neighborhood of PI species indicates that PI(3,4,5)P3, and PI(3,4)P2 are significantly associated with both invadopodia and focal adhesion molecules, whereas the precursor PI(4,5)P2 is associated only with focal adhesions. PI(3,5)P2 is significantly associated with invadopodia. Depth of connections = 2 for analysis shown (PI binding partners and first neighbors). C. Schematic of conversion between key PI species. Red indicates enzymes likely to promote PI(3,4)P2 formation in epithelial cells that we tested. D. Images of SCC61 cells expressing vector only (control) or SHIP2-FLAG (SHIP2), or SHIP2-FLAG cells treated with 12.5 or 25 μM LY294002 (SHIP2+LY12.5 or LY25). E. Western blot of control and SHIP2-FLAG-expressing cells probed with an anti-Flag antibody. * indicates non-specific band detected by anti-FLAG antibody. Tubulin is the loading control. F. Invadopodia and focal adhesion analyses. n≥70 cells per cell line from 3 independent experiments. Scale bar = 20 μm. *p<0.05; **p<0.01; ***p<0.001.
PI(3,4)P2 is a good candidate for recruiting invadopodia-specific proteins to the plasma membrane, such as Tks5 (45), and could thereby contribute to invadopodia formation. A possible molecular mechanism for this switch is the activity of PI-5′-phosphatases that use PI(3,4,5)P3 as their substrate, such as SYNJ2, SHIP1 or SHIP2 (41, 46, 47). Thus, sequential conversion of PI(4,5)P2 to PI(3,4)P2 through the action of PI3K and a PI-5′-phosphatase (Fig 6C), could force both focal adhesion turnover (by loss of PI(4,5)P2-binding proteins) and invadopodia formation (through the acquisition of PI(3,4)P2 binding proteins). To test whether enhanced formation of PI(3,4)P2 might indeed promote formation and activity of invadopodia, we expressed SHIP2, a ubiquitously distributed 5′ lipid phosphatase that shows increased abundance in a subset of breast cancers (48), in SCC61 cells. We found that SHIP2 overexpression increased both the number and activity of invadopodia. There was also a shift in the organization of focal adhesions, with an increase in number of central focal adhesions and a decrease in the number of peripheral focal adhesions (Fig 6D–F). Furthermore, preventing the accumulation of PI3K products (for example, PI(3,4,5)P3 and PI(3,4)P2) with LY294002 treatment abolished the effect of SHIP2 overexpression on invadopodia and central focal adhesions (Fig 6D–F). These data indicate that a shift in phosphatidylinositol metabolism to produce PI(3,4)P2 promotes a shift in focal adhesion and invadopodia organization.
PKCα has opposite effects on invadopodia, depending on the activation status of PI3K
In addition to PI3K, we identified PKCα in our network analyses as potentially important in regulating focal adhesions and invadopodia. In addition, the RPPA analysis suggested that tumors with both high PI3K and low PKCα activities might be more aggressive. Therefore, we tested the effect of PKCα inhibition on the formation of focal adhesions and invadopodia in HNSCC cells by specifically knocking down PKCα with 2 separate siRNA sequences. Consistent with previous studies on podosomes (13, 36–38), decreased PKCα abundance in either HNSCC (SCC25), breast cancer (MDA-MB-231), or melanoma (A375) cells with a wild-type PI3K genotype (49, 50) caused decreased numbers and activity of invadopodia (Fig 5 and Fig S4). However, in cells with activating PI3K mutations – such as SCC25 (Fig 5) and MDA-MB-231 (Fig S4) cells expressing E545K and H1047R PIK3CA mutations and SCC61 cells which have an E542K mutation in endogenous PIK3CA (Fig S5) - expression of PKCα siRNA led to the opposite phenotype with increased number of invadopodia per cell and invadopodia activity. In addition, we found that loss of PKCα increased the ECM-degrading ability of PTEN-null (51, 52) BT549 breast cancer cells (Fig S4). Because PTEN enzymatically antagonizes PI3K by converting PI(3,4,5)P3 to PI(4,5)P2, these data suggest that loss of PKCα enhances formation of invadopodia in cells with excess and unopposed PI3K activity. Analysis of the adhesion phenotype revealed that PKCα-siRNA induced a consistent increase in the number of central focal adhesions, regardless of the PI3K mutant status or cell type. In addition, there was either new localization of adhesion proteins directly to the invadopodia puncta of PKCα-inhibited cells (Fig S5) or increased organization of adhesion bands that encircled clusters of invadopodia (Fig 5), suggesting that adhesion signaling is inhibited at both focal adhesions and invadopodia by PKCα. We also assessed the ability of PI3K/PKCα-manipulated SCC25 cells to invade through Matrigel Transwell chambers, an assay that requires both ECM degradation and motility. Similar to the invadopodia data, loss of PKCα enhanced the invasion of SCC25 cells expressing an activating PI3K mutation but reduced Transwell invasion in control SCC25 cells (Fig S6).
To understand the phenotypic switch induced in PI3K-high/PKCα-low cells, we performed live imaging of invadopodia and focal adhesions, marked respectively by the actin marker td-Tomato-F-Tractin, which is the actin binding domain of ITPKA (53) fused to tandem Tomato fluorescent protein, and the focal adhesion scaffold protein zyxin (54) fused to Venus fluorescent protein. To induce de novo invadopodia formation and focal adhesion reorganization, SCC25 cells expressing the H1047R-PI3K-mutant with or without PKCα-knockdown were serum- and growth-factor-starved and then stimulated with invadopodia media (Fig 7A, Movies S1–S4). PKCα-knockdown cells frequently had a high basal number of focal adhesions that upon growth factor stimulation were reorganized to surround newly forming invadopodia in “adhesion belts” (Fig 7A, Movies S3 and S4). By contrast, invadopodia formation was less robust and focal adhesions were not as organized around invadopodia in control cells (Fig 7A, Movies S1 and S2). Quantitation of invadopodia formation after stimulation revealed that PKCα-knockdown in the PI3K-mutant background led to increased numbers of newly formed invadopodia, especially in the first 15 min after stimulation (Fig 7B). To quantitate invadopodia stability, we performed live cell imaging under basal conditions (cells were cultured in invadopodia medium without previous growth factor starvation) (Movies S5 and S6). In this assay, PKCα-knockdown led to a decreased number of short-lived invadopodia and an increased number of long-lived invadopodia (Fig 7C). Overall, knockdown of PKCα in the PI3K mutant background enhanced both the formation and stability of invadopodia.
Fig 7. PKCα negatively regulates both invadopodia formation and stability in PI3K mutant-expressing cells.

A,B. SCC25 cells stably expressing H1047R PI3K and m1Venus-zyxin were transfected with tdTomato-F-tractin and control or PKCα siRNA. They were replated on FN-coated gelatin plates and serum- and growth factor-starved before stimulation with invadopodia media and live imaging. Frames were captured every 90 sec for 90 min. A. Images from example movies. Scale bars = 10 μm. B. Quantitation of the number of new invadopodia formed per cell binned by time after stimulation. n≥23 cells per cell line from 5 independent experiments. ***p<0.001 compared with control. C. SCC25 cells stably expressing tdTomato-F-ractin were cultured in invadopodia media without previous starvation and live movies were obtained. Invadopodia lifetime was quantitated as the length of time an invadopodia persisted after its formation. n≥21 cells per cell line from 4 independent experiments.
Overall, our data point to a strong relationship between PI3K and PKCα in promoting invadopodia formation. We noticed that decreased PKCα protein abundance in cells with overly active PI3K often appeared to further enhance the effects of PI3K, rather than resulting in a distinct phenotype. For example, the reorganization of focal adhesions around invadopodia in PI3K mutant/PKCα-knockdown cells also occurs in PI3K mutant control cells but to a lesser extent (Figs 5,7). One possible mechanism that could explain these findings is if PKCα provides negative feedback to PI3K. Indeed, PKCα can inhibit PI3K either by direct phosphorylation of unknown sites within the p110α catalytic subunit of PI3K (55) or by activating PKCδ which then phosphorylates the SH2 domains of the p85α regulatory subunit to prevent binding to phosphotyrosine-containing binding partners (56). To determine whether PI3K activity is enhanced by PKCα-knockdown, we visualized the abundance of phosphoinositides in cells by using quantum dot-labeled PH domains of PLCδ and GRP1 to respectively label PI(4,5)P2 and PI(3,4,5)P3 (57). In control cells expressing the H1047R PI3K mutant, both PI(3,4,5)P3 and PI(4,5)P2 localized to the plasma membrane (Fig 8A). Treatment with the PI3K inhibitor LY294002 led to decreased abundance of PI(3,4,5)P3, as indicated by decreased binding of quantum dot-labeled PH-GRP1. In PKCα-knockdown cells the abundance of PI(3,4,5)P3 increased and that of PI(4,5)P2 correspondingly decreased at the plasma membrane (Fig 8A,B). PI(4,5)P2 was also present on intracellular vesicles in PKCα-knockdown cells. Quantitation of the ratio of PI(3,4,5)P3 to PI(4,5)P2 in individual cells indicated an overall whole cell median increase of 4.5- and 9-fold in cells expressing distinct siRNAs against PKCα compared to control cells (Fig 8B). Because PI(3,4,5)P3 is the direct lipid product of PI3K, these data indicate that PKCα provides negative feedback to PI3K enzymatic activity. Consistent with this model, the phosphorylation of the downstream target Akt on Ser473 was higher in PKCα-knockdown cells than in control cells (Fig 8C,D).
Fig 8. PKCα inhibits cellular PI3K activity.

A. SCC25 cells stably expressing H1047R PI3K were transfected with control or PKCα-targeting siRNA (siPKCα #1 and #2). Control + LY, control cells treated with the PI3K inhibitor LY294002. Cells were fixed and stained with probes for PI(3,4,5)P3 (red in Merge) and PI(4,5)P2 (green in Merge). Images on right (“Ratio”) have been color converted to show the ratio of PI(3,4,5)P3 to PI(4,5)P2 and have a corresponding ratiometric color scale bar. B. Quantification of (PI(3,4,5)P3/PI(4,5)P2) fluorescence intensity ratios in individual cells from images. n≥15 cells per condition from 3 independent experiments. C. Representative Western blots showing abundance of PKCα; tubulin loading control; pSer473-Akt (pAkt) and total Akt (Akt) in H1047R control and PKCα-siRNA cells. D. Quantification of Active-Akt (pAkt/Total Akt) from n=3 Western blots. Mean+/− standard error plotted. E. Western blot of control, p85 wild type-FLAG-(p85 -WT), and p85 S361/652A-FLAG (p85-SA)-expressing SCC25-H1047R cells probed with an anti-Flag antibody. Tubulin loading control. F. Invadopodia-associated ECM degradation in p85-overexpressing cells. n≥62 cells per cell line from 3 independent experiments. Scale bar = 20 μm. * p<0.05, *** p<0.001.
PKC targets two phorbol myristate acetate-sensitive serine phosphorylation sites, Ser361 and Ser652, in the SH2 domains of the p85α PI3K catalytic subunit (56). These phosphorylation events block in vitro binding to tyrosine-phosphorylated peptides (56), suggesting that they likely affect the adapter function of p85α (20) and thus prevent access of PI3K to membrane pools of PI(4,5)P2. Our centrality analyses also had identified p85α (gene name PIK3R1) rather than p110α (gene name PIK3CA) as central to both focal adhesion and invadopodia networks, likely due to interaction with binding partners (20). We therefore expressed nonphosphorylatable mutant PIK3R1 in which both serines were mutated to alanines (S361/652A) (56) in SCC25 H1047R cells and assessed invadopodia activity. Compared to untransfected controls, expression of wild-type p85α actually dampened invadopodia activity (Fig 8E,F). However, consistent with the model in which serine phosphorylation of p85α leads to negative feedback of PI3K, expression of the nonphosphorylatable S361/652A p85α mutant enhanced invadopodia-associated ECM degradation compared to both untransfected and wild-type p85-expressing controls (Fig 8F).
Discussion
To identify key signals that promote the invasive transition during cancer, we used a computational approach in which we built and mined literature-based molecular interaction networks representing focal adhesions and invadopodia. We further combined initial hub results from centralities and random walk analyses of the networks with experimental RPPA results from human HNSCC tumors to identify potential signaling patterns associated with tumor aggressiveness. By following up on a potential “PI3K high/PKCα-low” pattern associated with bad prognosis, we discovered that the combination of increased PI3K with low PKCα activity indeed promotes an “invasive state” characterized by enhanced formation and activity of invadopodia along with changes in the organization of adhesions. By contrast, in the absence of either PIK3CA activating mutations or loss of PTEN, PKCα inhibition instead diminished invadopodia formation and activity. These results point to the potential value of analyzing invasive signaling in a “network” approach and suggest that combinations of PI3K and PKCα signaling may be useful as biomarkers for cancer aggressiveness.
Molecular network models can be used for various purposes and are typically constructed from either high-throughput datasets or from the literature (16, 24). Cancer is a particularly appropriate application due to the deregulation of signaling networks and the large number of genetic and epigenetic changes (58) that lead to diverse network configurations. Although networks are typically constructed based on datasets, signaling pathways or statistical relationships, we instead used networks to represent physical cytoskeletal structures (22) and constrained the edges to represent only direct molecular binding interactions. Whereas use of literature-derived networks such as ours can bias to “rediscovery”, addition of first-neighbor binding partners and comparison of these networks to human tumor data allowed us to generate and then subsequently test hypotheses about potential signaling hub combinations that govern focal adhesion-invadopodia transitions. Indeed, the interaction between PI3K pathway mutations and PKCα activity was unexpected and affected invadopodia formation and activity. We expect that future use of these networks, in combination with various biological datasets, will lead to additional insights into activation of the invasive state. Our network approach may also be useful for modeling of other subcellular structures.
Our data indicate that the combination of PI3K activation and PKCα inhibition promotes focal adhesion-invadopodia switching behavior and invasiveness, as assessed by Transwell invasion assays. Consistent with our random walk analysis, PI3K activity was most closely associated with invadopodia induction, whereas PKCα activity led to more organized focal adhesions, including those surrounding invadopodia. Furthermore, network representations show more binding interactions to invadopodia proteins from PI3K and its lipid products than from PKCα (Fig S7). These data are consistent with our hypothesis that the invasive transition involves both adhesion reorganization and acquisition of new properties that allow formation of invadopodia, such as generation of PI(3,4)P2. These findings also suggest that there may be other combinations of focal adhesion and invadopodia hub states that either activate or shut down the invasive state.
In vascular smooth muscle and endothelial cells, the PKC-activating and tumor promoting drug phorbol myristate acetate (PMA) is a potent promoter of both focal adhesion disassembly and podosome formation (13, 36–38). Indeed, in cancer cells that did not harbor PI3K or PTEN mutations, we found that inhibition of PKCα shut down invadopodia formation, possibly due to prevention of focal adhesion turnover (13). We speculate that deregulated PI3K activity in cells expressing PI3K mutants alters this dynamic by bypassing the need for focal adhesion turnover in order to organize new invadopodia. Under that circumstance, inhibition of PKCα could then promote invadopodia formation by preventing negative feedback to PI3K (55, 56). This model is supported by our findings that knockdown of PKCα in cells expressing the constitutively active H1047R PI3K mutant leads to an increase in the cellular ratio of PI(3,4,5)P3 to PI(4,5)P2 and that expression of the nonphosphorylatable S361/652A p85α mutant enhances invadopodia-associated ECM degradation (Fig 8). Because the serine phosphorylation sites targeted by PKCs in the SH2 domains of p85α affect binding to phosphotyrosine-containing peptides (56), we speculate that at least one mechanism whereby PKCα may limit PI3K activity in cells with mutations in the PI3K pathway is by minimizing the binding time of PI3K to phosphotyrosine-containing binding partners at the plasma membrane.
Both increased and decreased abundance of PKCα have been reported in various human cancer types, including breast cancer (59–62). In HNSCC, increased abundance of PKCα correlates with decreased survival; however the relationship with PI3K was not examined (63, 64). Our finding that PKCα silencing has opposite effects depending on the activation state of PI3K indicates that the overall network state is likely to be critical in accurately predicting prognosis and treatment. We expect that appropriate biomarkers may be critical for effective use of PKC inhibitors in the clinic (62). Because we used siRNA, our findings are specific to PKCα. However, given that chemical inhibitors may potentially crossreact, some consideration should probably also be given to the role of other PKC isoforms that we have not addressed in this study, such as PKCβ, which shows increased abundance in colon cancer and lymphoma and decreased abundance in melanoma (65).
In summary, we used a combination of molecular interaction network building and analysis to discover signaling states that promote a specific invasive phenotype: focal adhesion reorganization and invadopodia formation. We found that the combination of high, deregulated PI3K activity with low PKCα activity optimally promotes invadopodia formation in combination with adhesion reorganization. Interesting questions for the future include: (i) whether additional aggressive cancer cell phenotypes such as cell survival are augmented by the PI3K high/PKCα low signaling combination; (ii) whether other tumor types coregulate PI3K and PKCα activities; and (iii) whether we can use our subcellular network approach to identify additional signaling states that are associated with a specific phenotype.
Materials and Methods
Network construction and centrality measurements
Lists of molecules that constitute each network were obtained by mining the literature, as described in the results, and represent the state of the literature in January 2010. Molecular interaction networks were assembled by downloading and importing the HPRD database (build 070609) (66) into Cytoscape and differentially highlighting the nodes from our focal adhesion and invadopodia lists, respectively. All self-loops (edges that connect the same node) were removed to avoid centrality bias. Various centrality measurements were used to quantify the network. Centiscape 1.1, a Cytoscape 2.7.0 plugin, was used to calculate degree, betweenness, and stress. To calculate the sum of shortest paths, the network was exported to R 2.11.1 (64 bit). Using the iGraph package in R, the shortest path function created a matrix displaying whether a certain node was found in the shortest path from another node. The sum of shortest paths for each node was found by summing each row within the matrix.
Random Walk Analysis
The random walk with restart analysis was performed using the NetWalker algorithm as previously described (28). Given a network and start probabilities for each node representing prior information on their relative importance, the algorithm calculates a final priority score for each node based on the steady state probabilities. In this study, we gave equal start probability to each node in the predefined subnetwork of interest. To assess the statistical significance of the final priority scores for each node, we constructed 10,000 sets of randomly selected nodes of the same size as the predefined subnetwork and generated 10,000 sets of random scores. For each node in the network, a local p value was estimated by comparing the real score to random scores from the same node, and a global p value was estimated by comparing the real score to random scores from all nodes. Genes that are highlighted in Table S3 have both local p<0.05 and global p<0.05.
RPPA analysis of primary HNSCC tumor samples
Deidentified primary oropharynx HNSCC tumor samples were obtained prospectively before treatment (Vanderbilt IRB #030062) between 2003 and 2009 and snap-frozen within 30 min after removal. Patients that were alive at the time of analysis had an average follow-up time of 45.2 months with a minimum of 13 months follow-up. Tumor lysates were subjected to RPPA analysis, as previously described (29, 30) for the signaling analytes listed in Table S4. Tumors were tested for the presence of human papillomavirus by PCR and included in the analysis if the results were negative. Including duplicate measurements, the original analyte list contained 149 measurements per sample. To identify potential signaling components associated with invasive state outcome, stroma-specific analytes and analytes with duplicate values were manually excluded, resulting in a data set of 132 measurements for each tumor. Values were median centered and scaled to the standard deviation for each analyte. Analytes with the most predictive power for recurrence were selected based on the results of supervised clustering of the patient samples into two groups (recurrent and non-recurrent (with a followup time ≥ 24 months) tumors) using a greedy forward strategy to find an optimal solution at each step and optimized combination of the Wilcoxon and Margin statistics (Wilma clustering algorithm (67)) for finding the clusters using the Supclust package (68) in R (69). To show directionality of signaling and differences between the samples and to generate the heatmap in Fig 3, unsupervised clustering was then performed using the 30 highest ranking analytes associated with outcome. The two-tailed p-value of Fisher’s exact test comparing the number of recurrent tumors in each of the two groups is 0.0123.
Lipid computational analysis
To test whether specific PI lipids are significantly associated with the focal adhesions and invadopodia networks, we built a 2×2 contingency table with the following two classifications: whether the nodes interaction with the lipid is direct and whether the nodes are in our original list. Such tables were drawn for each lipid and list combination, and they were analyzed in R using the Fisher’s exact test.
Cell lines
SCC25 cells were cultured in DMEM/F12 supplemented with 20% FBS. SCC61 cells were cultured in DMEM supplemented with 20% FBS and 0.4ug/ml hydrocortisone. A375, MDA-MB-231, and BT-549 cells were cultured in DMEM+10%FBS.
Plasmids and siRNA
tdTomato-F-tractin was a gift of Dr. Robert Fischer at NHLBI and was created by cloning the 9–52 stretch of the F-actin binding protein ITPKA (53) into pCMV-tdTomato (Clontech) and then subsequently PCR-cloned into pENTR and recombined into pLenti6/V5 (Invitrogen). SHIP2-FLAG (70) was cloned into pBABE-puro using the EcoR1 site. PIK3CA mutant genes H1047R and E545K (71) were previously described and were PCR-cloned into pENTR and recombined into pLenti6/V5. m1Venus-Zyxin-pLenti6 was previously described (72). p85-WT-FLAG and p85-S361/652A-FLAG (56) were a kind gift of Dr. Lew Cantley (Harvard University) and were cloned into pLenti6/V5 (Invitrogen). GST-6Cys-PLCδ1-PH and GST-6Cys-GRP1-PH (57) were a kind gift from Dr. Tadaomi Takenawa (Kobe University).
Control (non-targeting siRNA #1) and 2 siRNAs for PKCα (5 ′-GGAUUGUUCUUUCUUCAUA-3′), (5′-GAAGGGUUCUCGUAUGUCA-3′) were obtained from Thermo Fisher. Cells were seeded and transfected with 10 nM siRNA using Lipofectamine RNAi max, according to the manufacturer’s instructions.
Invadopodia Assay
35mm glass -bottom PDL-coated dishes (MatTek) were coated with 2.5 % bovine gelatin. The gelatin was crosslinked with a 0.5% glutaraldehyde solution, followed by quenching with 1 mg/ml sodium borohydride and incubation with DyLight633-labeled fibronectin for 1 hour. 7×10⁴ HNSCC cells were seeded to each plate containing 2 ml invadopodia medium (DMEM, 5% Nu serum, 10% FBS, 100 ng/ml of EGF). After 18 h, cells were fixed with 4% PFA, permeabilized with 0.1 % Triton-X-100, blocked with 5% BSA and probed for vinculin (Sigma, cat# V4505 mAb) and F-actin (Rhodamine phalloidin, Invitrogen).
Microscopy and Image Analysis
Cells were imaged using a Zeiss LSM 510 and LSM5 EXCITOR confocal microscope (both 63X Plan Apo objectives) and Nikon A1 confocal microscope (for live imaging, 60X Plan Apo objective). Image analysis was performed using Image J and Metamorph. Cell areas were obtained from manual traces. Invadopodia were manually counted as actin-positive puncta associated with degradation. Focal adhesion size and number quantification was performed using image J on central or peripheral regions of the cell as shown in Fig 4A, using the “analyze particles” function on objects from 5 to infinity pixels squared. Focal adhesion area was calculated by converting pixels to μm from a known calibration. Matrix degradation was quantitated from the fluorescent fibronectin images in Metamorph software using the threshold tool to obtain an inclusive threshold of the dark holes in the matrix, followed by analysis of the Threshold Area with the “Region Measurements” tool. Degradation area/cell area was plotted.
Live cell imaging analysis
For invadopodia lifetime analysis (basal condition), SCC25-H1047R cells stably expressing tdTomato-F-tractin were transfected with control or PKCα siRNA and cultured on gelatin-fibronectin coated Mat-Tek dishes. After 48 hrs, images were captured every 90sec for 90min. For stimulation analysis, SCC25-H1047R cells stably expressing m1Venus Zyxin were transfected with control or PKCα siRNA. After 24 hrs, they were replated on gelatin-fibronectin coated Mat-Tek dishes. After 4 hrs, cells were transfected with tdTomato-F-ractin and incubated for 20 hrs. The media were then replaced with serum free medium for 24 hrs, before stimulation with invadopodia medium and capturing images every 90 sec for 90min.
Statistical Analyses of Invadopodia and Focal adhesion data
SPSS PASW Statistics 18 software was used for statistical analyses. First, data were analyzed for normality using the Kolmogorov-Smirnov test. Non-parametric data (>0.05 in K-S) were analyzed using the Kruskal-Wallis one-way ANOVA, followed by a Tamhane post-hoc test. Parametric data were analyzed by the one-way ANOVA with the Bonferroni correction as a post-hoc test. Unless otherwise indicated in the legend, data were graphically represented using GraphPad Prism version 5.04 with box-and-whiskers plots where the median is represented with a line, the box represents the 25–75 percentile, and the error bars show the 5–95 percentile.
Transwell Invasion Assays
Transwell chambers with 8 μm pore size filters (Corning) were coated with Matrigel (BD Biosciences) according to the manufacturer’s instructions. Invadopodia buffer (10%FBS, 5% Nu Serum, 100ug/ml EGF) was added to the lower chamber, and 100 μl of a cell suspension (2.5 × 10⁴ cells for SCC25 -H1047R and 1 × 10⁵ cells for SCC25 control cells) was placed in the upper chamber and the plates were incubated at 37 °C in 5% CO2 for 24 h (SCC25-H1047R) or 48h (SCC25). Cells in the lower chamber were then stained with Giemsa solution and counted.
Lipid probe experiments
GST-6Cys-PH fusion proteins were purified from E. coli BL21 with glutathione sepharose (GE) followed by GST tag removal with PreScission protease (GE) and labeling with Q-dot antibody conjugation kit (Invitrogen), as described previously (57). Cells were fixed and permeabilized at 37°C for 1h with 4% PFA, 0.1% glutaraldehyde and 1.5 mg/ml saponin in cytoskeleton buffer, as described (57). Cells were stained with Qdot-6Cys-GRP1-PH and Qdot-6Cys-PLCδ1-PH domains in 1%BSA at 4 °C overnight and imaged by confocal microscopy. The ratios of whole cell fluorescent intensities for individual cells were quantitated. Visualization of ratiometric images was performed by Nice Elements Nikon software.
Supplementary Material
Fig S1. LY treatment of SCC25 cells decreases invadopodia activity. n≥80 cells per cell line from 3 independent experiments. Data shown in box-and-whiskers plots in which the median is represented with a line, the box represents the 25–75 percentile, and the error bars show the 5–95 percentile.
Fig S2. Average focal adhesion area data for Figs. 4A, 5B, 6C, and Fig S5D. Data shown in box-and-whiskers plots in which the median is represented with a line, the box represents the 25–75 percentile, and the error bars show the 5–95 percentile.
Fig S3. Western blot analyses and full image series data for Fig. 5. A. Western blot data for SCC25 cells expressing PI3K mutants ± PKCα siRNA. When the p110 mutants E545K and H1047R are expressed, there is a corresponding increase in phosphorylated Akt (p473 akt). Also PKCα is efficiently knocked down in PKCα siRNA-expressing cells, as indicated. B. Full image series for merged images in Fig 5. Scale bar = 20 μm.
Fig S4. Knockdown of PKCα in breast cancer and melanoma cells has an opposite effect on invadopodia activity depending on the PI3K status. A. Images from MDA-MB-231 cells overexpressing cells stably expressing the PI3K H1047R mutant and treated with control or PKCα-targeting siRNA (siPKCα#1 and #2), as indicated. B. Images from BT-549 breast cancer cells. C–E. Quantitation of invadopodia-associated degradation activity in MDA-MB-231 breast cancer, A375 melanoma, and BT-549 breast cancer cells, as indicated. Loss of PKCα selectively enhances degradation of ECM in cells when coupled with increased activity of the PI3K pathway, either through expression of mutant PI3K (H1047R MDA-MB-231 and A375 cells) or through loss of PTEN (BT-549 cells). n≥50 cells from at least 3 independent experiments were analyzed for each condition. Scale bars = 20 μm. Data shown in box-and-whiskers plots in which the median is represented with a line, the box represents the 25–75 percentile, and the error bars show the 5–95 percentile. * p<0.05, **p<0.01, ***p<0.001.
Fig S5. Inhibition of PKCα in SCC61 cells increases invadopodia activity. A. Images. B. Western blot. C. Quantitation of focal adhesion and invadopodia data. n≥70 cells per cell line for 3 independent experiments. Scale bar = 20 μm. Data shown in box-and-whiskers plots in which the median is represented with a line, the box represents the 25–75 percentile, and the error bars show the 5–95 percentile. *** p<0.001, n.s. = not significant.
Fig S6. PKCα knockdown leads to divergent Matrigel invasion phenotypes, depending on PI3K mutant status. Invasion of Matrigel-coated Transwell filters was analyzed using SCC25 cells expressing empty vector (Control), or activating PI3K mutant H1047R (SCC25-H1047R) with or without knockdown of PKCα (siPKCα#1 and #2). Due to the highly invasive nature of SCC25-H1047R, Matrigel invasion was allowed to proceed for 24 hours in that cell line, whereas 48 hours invasion time was required to assess invasion in control SCC25 cells. Invasion was blocked in the presence of matrix metalloproteinase inhibitors (+MMI). Data are shown as the mean + S.D from n=3 independent experiments, with triplicate determinations. **p<0.01
Fig S7. Visualizations of PRKCA and PIK3R1/PI(3,4,5)P3/PI(3,4)P2 binding interactions with focal adhesion and invadopodia proteins. Direct binding partners of PRKCA (A) or PIK3R1/PI(3,4,5)P3/PI(3,4)P2 (B) molecules that are either part of focal adhesion (Blue, FA), Invadopodia (Pink) or both (Green) networks are shown. Binding partners that are not part of either the focal adhesion or invadopodia networks are not shown. The yellow PIK3CA node that is connected to PRKCA shows a literature-based direct connection (55) that is not present in the HPRD protein interaction database.
Movies S1 and S2. SCC25 cells stably expressing H1047R PIK3CA mutant and transfected with non-targeting siRNA were stimulated with invadopodia medium after serum starvation.
Movies S3 and S4. SCC25 cells stably expressing H1047R PIK3CA mutant and transfected with siRNA targeting PKCα were stimulated with invadopodia medium after serum starvation.
SCC25 cells stably expressing H1047R PIK3CA mutant and transfected with non-targeting siRNA under basal conditions.
SCC25 cells stably expressing H1047R PIK3CA mutant and transfected with siRNA targeting PKCα under basal conditions.
Acknowledgments
Funding: Supported by U54CA113007 (VQ), R01 GM088822 (BZ), MDACC CCSG core P30 CA016672 (GBM), ICBP U54 CA112970 (GBM), P50CA097007 (GBM), an endowment to the Barry Baker Laboratory for Head and Neck Oncology and to the VICC by the Robert J. and Helen C. Kleberg Foundation, NIH and AstraZeneca research award Adenoid Cystic Research Foundation (WGY), a CREST project from JST (M.S.), a Grant-in-Aid for Scientific Research (S) from MEXT (M.S.), an ICBP summer fellowship (MG), a JSPS “Institutional Program for Young Researcher Overseas Visits” travel grant for DH, and 1R01GM075126 (AMW).
Footnotes
Author contributions: DH performed all cell line experiments, based on pilot data gathered by TM and KC. AW and TM built the network lists. JJ, WE, MG, and BZ performed computational analyses. BB, WY, YL, GM, DT gathered and analyzed RPPA data. AW, DH, VQ, MS, and WY designed experiments and analyzed data. KC performed statistical analyses. NP contributed reagents and gave intellectual input. AW wrote the manuscript, with input from all coauthors.
Competing interests: The authors declare that they have no competing interests..
References and Notes
- 1.Hanahan D, Weinberg RA. The hallmarks of cancer. Cell. 2000;100:57. doi: 10.1016/s0092-8674(00)81683-9. [DOI] [PubMed] [Google Scholar]
- 2.Monsky WL, Lin CY, Aoyama A, Kelly T, Akiyama SK, Mueller SC, Chen WT. A potential marker protease of invasiveness, seprase, is localized on invadopodia of human malignant melanoma cells. Cancer Res. 1994;54:5702. [PubMed] [Google Scholar]
- 3.Raz A, Geiger B. Altered organization of cell-substrate contacts and membrane-associated cytoskeleton in tumor cell variants exhibiting different metastatic capabilities. Cancer Res. 1982;42:5183. [PubMed] [Google Scholar]
- 4.Buccione R, Orth JD, McNiven MA. Foot and mouth: podosomes, invadopodia and circular dorsal ruffles. Nat Rev Mol Cell Biol. 2004;5:647. doi: 10.1038/nrm1436. [DOI] [PubMed] [Google Scholar]
- 5.Murphy DA, Courtneidge SA. The ‘ins’ and ‘outs’ of podosomes and invadopodia: characteristics, formation and function. Nat Rev Mol Cell Biol. 2011;12:413. doi: 10.1038/nrm3141. [DOI] [PMC free article] [PubMed] [Google Scholar]
- 6.Wang Y, McNiven MA. Invasive matrix degradation at focal adhesions occurs via protease recruitment by a FAK-p130Cas complex. J Cell Biol. 2012;196:375. doi: 10.1083/jcb.201105153. [DOI] [PMC free article] [PubMed] [Google Scholar]
- 7.Weaver AM. Invadopodia: specialized cell structures for cancer invasion. Clin Exp Metastasis. 2006;23:97. doi: 10.1007/s10585-006-9014-1. [DOI] [PubMed] [Google Scholar]
- 8.Linder S. Invadosomes at a glance. J Cell Sci. 2009;122:3009. doi: 10.1242/jcs.032631. [DOI] [PubMed] [Google Scholar]
- 9.Katsumi A, Orr AW, Tzima E, Schwartz MA. Integrins in mechanotransduction. J Biol Chem. 2004;279:12001. doi: 10.1074/jbc.R300038200. [DOI] [PubMed] [Google Scholar]
- 10.Kim LC, Song L, Haura EB. Src kinases as therapeutic targets for cancer. Nat Rev Clin Oncol. 2009;6:587. doi: 10.1038/nrclinonc.2009.129. [DOI] [PubMed] [Google Scholar]
- 11.Chan KT, Cortesio CL, Huttenlocher A. FAK alters invadopodia and focal adhesion composition and dynamics to regulate breast cancer invasion. J Cell Biol. 2009;185:357. doi: 10.1083/jcb.200809110. [DOI] [PMC free article] [PubMed] [Google Scholar]
- 12.Kaplan KB, Swedlow JR, Morgan DO, Varmus HE. c-Src enhances the spreading of src−/− fibroblasts on fibronectin by a kinase -independent mechanism. Genes Dev. 1995;9:1505. doi: 10.1101/gad.9.12.1505. [DOI] [PubMed] [Google Scholar]
- 13.Kaverina I, Stradal TE, Gimona M. Podosome formation in cultured A7r5 vascular smooth muscle cells requires Arp2/3-dependent de-novo actin polymerization at discrete microdomains. J Cell Sci. 2003;116:4915. doi: 10.1242/jcs.00818. [DOI] [PubMed] [Google Scholar]
- 14.Araujo RP, Liotta LA, Petricoin EF. Proteins, drug targets and the mechanisms they control: the simple truth about complex networks. Nat Rev Drug Discov. 2007;6:871. doi: 10.1038/nrd2381. [DOI] [PubMed] [Google Scholar]
- 15.Ma’ayan A, Jenkins SL, Neves S, Hasseldine A, Grace E, Dubin-Thaler B, Eungdamrong NJ, Weng G, Ram PT, Rice JJ, Kershenbaum A, Stolovitzky GA, Blitzer RD, Iyengar R. Formation of regulatory patterns during signal propagation in a Mammalian cellular network. Science. 2005;309:1078. doi: 10.1126/science.1108876. [DOI] [PMC free article] [PubMed] [Google Scholar]
- 16.Ma’ayan A. Insights into the organization of biochemical regulatory networks using graph theory analyses. J Biol Chem. 2009;284:5451. doi: 10.1074/jbc.R800056200. [DOI] [PMC free article] [PubMed] [Google Scholar]
- 17.Pujol A, Mosca R, Farres J, Aloy P. Unveiling the role of network and systems biology in drug discovery. Trends Pharmacol Sci. 2010;31:115. doi: 10.1016/j.tips.2009.11.006. [DOI] [PubMed] [Google Scholar]
- 18.Taylor IW, Linding R, Warde-Farley D, Liu Y, Pesquita C, Faria D, Bull S, Pawson T, Morris Q, Wrana JL. Dynamic modularity in protein interaction networks predicts breast cancer outcome. Nat Biotechnol. 2009;27:199. doi: 10.1038/nbt.1522. [DOI] [PubMed] [Google Scholar]
- 19.Blobe GC, Obeid LM, Hannun YA. Regulation of protein kinase C and role in cancer biology. Cancer Metastasis Rev. 1994;13:411. doi: 10.1007/BF00666107. [DOI] [PubMed] [Google Scholar]
- 20.Liu P, Cheng H, Roberts TM, Zhao JJ. Targeting the phosphoinositide 3-kinase pathway in cancer. Nat Rev Drug Discov. 2009;8:627. doi: 10.1038/nrd2926. [DOI] [PMC free article] [PubMed] [Google Scholar]
- 21.Yamaguchi H, Yoshida S, Muroi E, Yoshida N, Kawamura M, Kouchi Z, Nakamura Y, Sakai R, Fukami K. Phosphoinositide 3-kinase signaling pathway mediated by p110alpha regulates invadopodia formation. J Cell Biol. 2011;193:1275. doi: 10.1083/jcb.201009126. [DOI] [PMC free article] [PubMed] [Google Scholar]
- 22.Zaidel-Bar R, Itzkovitz S, Ma’ayan A, Iyengar R, Geiger B. Functional atlas of the integrin adhesome. Nat Cell Biol. 2007;9:858. doi: 10.1038/ncb0807-858. [DOI] [PMC free article] [PubMed] [Google Scholar]
- 23.Shannon P, Markiel A, Ozier O, Baliga NS, Wang JT, Ramage D, Amin N, Schwikowski B, Ideker T. Cytoscape: a software environment for integrated models of biomolecular interaction networks. Genome Res. 2003;13:2498. doi: 10.1101/gr.1239303. [DOI] [PMC free article] [PubMed] [Google Scholar]
- 24.Seebacher J, Gavin AC. SnapShot: Protein-protein interaction networks. Cell. 2011;144:1000. doi: 10.1016/j.cell.2011.02.025. [DOI] [PubMed] [Google Scholar]
- 25.Brandes U, Erlebach T. Network analysis: methodological foundations. Springer; Berlin; New York: 2005. p. xii.p. 471. Lcns. [Google Scholar]
- 26.Rajasekaran S, Reif JH. Handbook of parallel computing: models, algorithms and applications. Chapman & Hall/CRC; Boca Raton: 2008. p. 1. (Chapman & Hall/CRC computer and information science series). (various pagings) [Google Scholar]
- 27.Kohler S, Bauer S, Horn D, Robinson PN. Walking the interactome for prioritization of candidate disease genes. Am J Hum Genet. 2008;82:949. doi: 10.1016/j.ajhg.2008.02.013. [DOI] [PMC free article] [PubMed] [Google Scholar]
- 28.Zhang B, Shi Z, Duncan DT, Prodduturi N, Marnett LJ, Liebler DC. Relating protein adduction to gene expression changes: a systems approach. Mol Biosyst. 2011;7:2118. doi: 10.1039/c1mb05014a. [DOI] [PMC free article] [PubMed] [Google Scholar]
- 29.Hennessy BT, Lu Y, Gonzalez-Angulo AM, Carey MS, Myhre S, Ju Z, Davies MA, Liu W, Coombes K, Meric-Bernstam F, Bedrosian I, McGahren M, Agarwal R, Zhang F, Overgaard J, Alsner J, Neve RM, Kuo WL, Gray JW, Borresen-Dale AL, Mills GB. A Technical Assessment of the Utility of Reverse Phase Protein Arrays for the Study of the Functional Proteome in Non-microdissected Human Breast Cancers. Clin Proteomics. 2010;6:129. doi: 10.1007/s12014-010-9055-y. [DOI] [PMC free article] [PubMed] [Google Scholar]
- 30.Tibes R, Qiu Y, Lu Y, Hennessy B, Andreeff M, Mills GB, Kornblau SM. Reverse phase protein array: validation of a novel proteomic technology and utility for analysis of primary leukemia specimens and hematopoietic stem cells. Mol Cancer Ther. 2006;5:2512. doi: 10.1158/1535-7163.MCT-06-0334. [DOI] [PubMed] [Google Scholar]
- 31.Nofech-Mozes S, Ackerman I, Ghorab Z, Ismiil N, Thomas G, Covens A, Khalifa MA. Lymphovascular invasion is a significant predictor for distant recurrence in patients with early-stage endometrial endometrioid adenocarcinoma. Am J Clin Pathol. 2008;129:912. doi: 10.1309/CP3HGX7H753QQU8T. [DOI] [PubMed] [Google Scholar]
- 32.Wright CD, Wain JC, Wong DR, Donahue DM, Gaissert HA, Grillo HC, Mathisen DJ. Predictors of recurrence in thymic tumors: importance of invasion, World Health Organization histology, and size. J Thorac Cardiovasc Surg. 2005;130:1413. doi: 10.1016/j.jtcvs.2005.07.026. [DOI] [PubMed] [Google Scholar]
- 33.Chen WT, Chen JM, Parsons SJ, Parsons JT. Local degradation of fibronectin at sites of expression of the transforming gene product pp60src. Nature. 1985;316:156. doi: 10.1038/316156a0. [DOI] [PubMed] [Google Scholar]
- 34.Tarone G, Cirillo D, Giancotti FG, Comoglio PM, Marchisio PC. Rous sarcoma virus-transformed fibroblasts adhere primarily at discrete protrusions of the ventral membrane called podosomes. Exp Cell Res. 1985;159:141. doi: 10.1016/s0014-4827(85)80044-6. [DOI] [PubMed] [Google Scholar]
- 35.Oikawa T, Itoh T, Takenawa T. Sequential signals toward podosome formation in NIH-src cells. J Cell Biol. 2008;182:157. doi: 10.1083/jcb.200801042. [DOI] [PMC free article] [PubMed] [Google Scholar]
- 36.Gatesman A, Walker VG, Baisden JM, Weed SA, Flynn DC. Protein kinase Calpha activates c-Src and induces podosome formation via AFAP-110. Mol Cell Biol. 2004;24:7578. doi: 10.1128/MCB.24.17.7578-7597.2004. [DOI] [PMC free article] [PubMed] [Google Scholar]
- 37.Tatin F, Varon C, Genot E, Moreau V. A signalling cascade involving PKC, Src and Cdc42 regulates podosome assembly in cultured endothelial cells in response to phorbol ester. J Cell Sci. 2006;119:769. doi: 10.1242/jcs.02787. [DOI] [PubMed] [Google Scholar]
- 38.Xiao H, Bai XH, Kapus A, Lu WY, Mak AS, Liu M. The protein kinase C cascade regulates recruitment of matrix metalloprotease 9 to podosomes and its release and activation. Mol Cell Biol. 2010;30:5545. doi: 10.1128/MCB.00382-10. [DOI] [PMC free article] [PubMed] [Google Scholar]
- 39.Yarbrough WG, Whigham A, Brown B, Roach M, Slebos R. Phosphoinositide kinase-3 status associated with presence or absence of human papillomavirus in head and neck squamous cell carcinomas. Int J Radiat Oncol Biol Phys. 2007;69:S98. doi: 10.1016/j.ijrobp.2007.04.082. [DOI] [PubMed] [Google Scholar]
- 40.Janmey PA, Lindberg U. Cytoskeletal regulation: rich in lipids. Nat Rev Mol Cell Biol. 2004;5:658. doi: 10.1038/nrm1434. [DOI] [PubMed] [Google Scholar]
- 41.Yamaguchi H, Oikawa T. Membrane lipids in invadopodia and podosomes: Key structures for cancer invasion and metastasis. Oncotarget. 2010;1:320. doi: 10.18632/oncotarget.164. [DOI] [PMC free article] [PubMed] [Google Scholar]
- 42.Hoshino D, Koshikawa N, Suzuki T, Quaranta V, Weaver AM, Seiki M, Ichikawa K. Establishment and validation of computational model for MT1-MMP dependent ECM degradation and intervention strategies. PLoS Comput Biol. 2012;8:e1002479. doi: 10.1371/journal.pcbi.1002479. [DOI] [PMC free article] [PubMed] [Google Scholar]
- 43.Poincloux R, Lizarraga F, Chavrier P. Matrix invasion by tumour cells: a focus on MT1-MMP trafficking to invadopodia. J Cell Sci. 2009;122:3015. doi: 10.1242/jcs.034561. [DOI] [PubMed] [Google Scholar]
- 44.Steffen A, Le Dez G, Poincloux R, Recchi C, Nassoy P, Rottner K, Galli T, Chavrier P. MT1-MMP-dependent invasion is regulated by TI-VAMP/VAMP7. Curr Biol. 2008;18:926. doi: 10.1016/j.cub.2008.05.044. [DOI] [PubMed] [Google Scholar]
- 45.Seals DF, Azucena EF, Jr, Pass I, Tesfay L, Gordon R, Woodrow M, Resau JH, Courtneidge SA. The adaptor protein Tks5/Fish is required for podosome formation and function, and for the protease-driven invasion of cancer cells. Cancer Cell. 2005;7:155. doi: 10.1016/j.ccr.2005.01.006. [DOI] [PubMed] [Google Scholar]
- 46.Chuang YY, Tran NL, Rusk N, Nakada M, Berens ME, Symons M. Role of synaptojanin 2 in glioma cell migration and invasion. Cancer Res. 2004;64:8271. doi: 10.1158/0008-5472.CAN-04-2097. [DOI] [PubMed] [Google Scholar]
- 47.Ooms LM, Horan KA, Rahman P, Seaton G, Gurung R, Kethesparan DS, Mitchell CA. The role of the inositol polyphosphate 5-phosphatases in cellular function and human disease. Biochem J. 2009;419:29. doi: 10.1042/BJ20081673. [DOI] [PubMed] [Google Scholar]
- 48.Prasad NK, Tandon M, Handa A, Moore GE, Babbs CF, Snyder PW, Bose S. High expression of obesity-linked phosphatase SHIP2 in invasive breast cancer correlates with reduced disease-free survival. Tumour Biol. 2008;29:330. doi: 10.1159/000172970. [DOI] [PubMed] [Google Scholar]
- 49.Barretina J, Caponigro G, Stransky N, Venkatesan K, Margolin AA, Kim S, Wilson CJ, Lehar J, Kryukov GV, Sonkin D, Reddy A, Liu M, Murray L, Berger MF, Monahan JE, Morais P, Meltzer J, Korejwa A, Jane-Valbuena J, Mapa FA, Thibault J, Bric-Furlong E, Raman P, Shipway A, Engels IH, Cheng J, Yu GK, Yu J, Aspesi P, Jr, de Silva M, Jagtap K, Jones MD, Wang L, Hatton C, Palescandolo E, Gupta S, Mahan S, Sougnez C, Onofrio RC, Liefeld T, MacConaill L, Winckler W, Reich M, Li N, Mesirov JP, Gabriel SB, Getz G, Ardlie K, Chan V, Myer VE, Weber BL, Porter J, Warmuth M, Finan P, Harris JL, Meyerson M, Golub TR, Morrissey MP, Sellers WR, Schlegel R, Garraway LA. The Cancer Cell Line Encyclopedia enables predictive modelling of anticancer drug sensitivity. Nature. 2012;483:603. doi: 10.1038/nature11003. [DOI] [PMC free article] [PubMed] [Google Scholar]
- 50.Garnett MJ, Edelman EJ, Heidorn SJ, Greenman CD, Dastur A, Lau KW, Greninger P, Thompson IR, Luo X, Soares J, Liu Q, Iorio F, Surdez D, Chen L, Milano RJ, Bignell GR, Tam AT, Davies H, Stevenson JA, Barthorpe S, Lutz SR, Kogera F, Lawrence K, McLaren-Douglas A, Mitropoulos X, Mironenko T, Thi H, Richardson L, Zhou W, Jewitt F, Zhang T, O’Brien P, Boisvert JL, Price S, Hur W, Yang W, Deng X, Butler A, Choi HG, Chang JW, Baselga J, Stamenkovic I, Engelman JA, Sharma SV, Delattre O, Saez-Rodriguez J, Gray NS, Settleman J, Futreal PA, Haber DA, Stratton MR, Ramaswamy S, McDermott U, Benes CH. Systematic identification of genomic markers of drug sensitivity in cancer cells. Nature. 2012;483:570. doi: 10.1038/nature11005. [DOI] [PMC free article] [PubMed] [Google Scholar]
- 51.Li J, Simpson L, Takahashi M, Miliaresis C, Myers MP, Tonks N, Parsons R. The PTEN/MMAC1 tumor suppressor induces cell death that is rescued by the AKT/protein kinase B oncogene. Cancer Res. 1998;58:5667. [PubMed] [Google Scholar]
- 52.Li J, Yen C, Liaw D, Podsypanina K, Bose S, Wang SI, Puc J, Miliaresis C, Rodgers L, McCombie R, Bigner SH, Giovanella BC, Ittmann M, Tycko B, Hibshoosh H, Wigler MH, Parsons R. PTEN, a putative protein tyrosine phosphatase gene mutated in human brain, breast, and prostate cancer. Science. 1997;275:1943. doi: 10.1126/science.275.5308.1943. [DOI] [PubMed] [Google Scholar]
- 53.Johnson HW, Schell MJ. Neuronal IP3 3-kinase is an F-actin-bundling protein: role in dendritic targeting and regulation of spine morphology. Mol Biol Cell. 2009;20:5166. doi: 10.1091/mbc.E09-01-0083. [DOI] [PMC free article] [PubMed] [Google Scholar]
- 54.Beckerle MC. Zyxin: zinc fingers at sitesof cell adhesion. Bioessays. 1997;19:949. doi: 10.1002/bies.950191104. [DOI] [PubMed] [Google Scholar]
- 55.Sipeki S, Bander E, Parker PJ, Farago A. PKCalpha reduces the lipid kinase activity of the p110alpha/p85alpha PI3K through the phosphorylation of the catalytic subunit. Biochem Biophys Res Commun. 2006;339:122. doi: 10.1016/j.bbrc.2005.10.194. [DOI] [PubMed] [Google Scholar]
- 56.Lee JY, Chiu YH, Asara J, Cantley LC. Inhibition of PI3K binding to activators by serine phosphorylation of PI3K regulatory subunit p85alpha Src homology-2 domains. Proc Natl Acad Sci U S A. 2011;108:14157. doi: 10.1073/pnas.1107747108. [DOI] [PMC free article] [PubMed] [Google Scholar]
- 57.Irino Y, Tokuda E, Hasegawa J, Itoh T, Takenawa T. Quantification and visualization of phosphoinositides by quantum dot-labeled specific binding-domain probes. J Lipid Res. 2012;53:810. doi: 10.1194/jlr.D019547. [DOI] [PMC free article] [PubMed] [Google Scholar]
- 58.Heng HH, Bremer SW, Stevens JB, Ye KJ, Liu G, Ye CJ. Genetic and epigenetic heterogeneity in cancer: a genome-centric perspective. J Cell Physiol. 2009;220:538. doi: 10.1002/jcp.21799. [DOI] [PubMed] [Google Scholar]
- 59.Ainsworth PD, Winstanley JH, Pearson JM, Bishop HM, Garrod DR. Protein kinase C alpha expression in normal breast, ductal carcinoma insitu and invasive ductal carcinoma. Eur J Cancer. 2004;40:2269. doi: 10.1016/j.ejca.2004.06.027. [DOI] [PubMed] [Google Scholar]
- 60.Kerfoot C, Huang W, Rotenberg SA. Immunohistochemical analysis of advanced human breast carcinomas reveals downregulation of protein kinase C alpha. J Histochem Cytochem. 2004;52:419. doi: 10.1177/002215540405200314. [DOI] [PubMed] [Google Scholar]
- 61.Lonne GK, Cornmark L, Zahirovic IO, Landberg G, Jirstrom K, Larsson C. PKCalpha expression is a marker for breast cancer aggressiveness. Mol Cancer. 2010;9:76. doi: 10.1186/1476-4598-9-76. [DOI] [PMC free article] [PubMed] [Google Scholar]
- 62.Mackay HJ, Twelves CJ. Targeting the protein kinase C family: are we there yet? Nat Rev Cancer. 2007;7:554. doi: 10.1038/nrc2168. [DOI] [PubMed] [Google Scholar]
- 63.Chang JT, Lu YC, Chen YJ, Tseng CP, Chen YL, Fang CW, Cheng AJ. hTERT phosphorylation by PKC is essential for telomerase holoprotein integrity and enzyme activity in head neck cancer cells. Br J Cancer. 2006;94:870. doi: 10.1038/sj.bjc.6603008. [DOI] [PMC free article] [PubMed] [Google Scholar]
- 64.Cohen EE, Zhu H, Lingen MW, Martin LE, Kuo WL, Choi EA, Kocherginsky M, Parker JS, Chung CH, Rosner MR. A feed-forward loop involving protein kinase Calpha and microRNAs regulates tumor cell cycle. Cancer Res. 2009;69:65. doi: 10.1158/0008-5472.CAN-08-0377. [DOI] [PMC free article] [PubMed] [Google Scholar]
- 65.Martiny-Baron G, Fabbro D. Classical PKC isoforms in cancer. Pharmacol Res. 2007;55:477. doi: 10.1016/j.phrs.2007.04.001. [DOI] [PubMed] [Google Scholar]
- 66.Keshava Prasad TS, Goel R, Kandasamy K, Keerthikumar S, Kumar S, Mathivanan S, Telikicherla D, Raju R, Shafreen B, Venugopal A, Balakrishnan L, Marimuthu A, Banerjee S, Somanathan DS, Sebastian A, Rani S, Ray S, Harrys Kishore CJ, Kanth S, Ahmed M, Kashyap MK, Mohmood R, Ramachandra YL, Krishna V, Rahiman BA, Mohan S, Ranganathan P, Ramabadran S, Chaerkady R, Pandey A. Human Protein Reference Database--2009 update. Nucleic Acids Res. 2009;37:D767. doi: 10.1093/nar/gkn892. [DOI] [PMC free article] [PubMed] [Google Scholar]
- 67.Dettling M, Buhlmann P. Supervised clustering of genes. Genome Biol. 2002;3:RESEARCH0069. doi: 10.1186/gb-2002-3-12-research0069. [DOI] [PMC free article] [PubMed] [Google Scholar]
- 68.Dettling M. Supclust R package. 2003 http://www.stat.math.ethz.ch/~dettling/
- 69.R Development Core Team. R Foundation for Statistical Computing. Vienna, Austria: 2011. URL http://www.R-project.org/ [Google Scholar]
- 70.Prasad N, Topping RS, Decker SJ. SH2-containing inositol 5′-phosphatase SHIP2 associates with the p130(Cas) adapter protein and regulates cellular adhesion and spreading. Mol Cell Biol. 2001;21:1416. doi: 10.1128/MCB.21.4.1416-1428.2001. [DOI] [PMC free article] [PubMed] [Google Scholar]
- 71.Isakoff SJ, Engelman JA, Irie HY, Luo J, Brachmann SM, Pearline RV, Cantley LC, Brugge JS. Breast cancer-associated PIK3CA mutations are oncogenic in mammary epithelial cells. Cancer Res. 2005;65:10992. doi: 10.1158/0008-5472.CAN-05-2612. [DOI] [PubMed] [Google Scholar]
- 72.Nagano M, Hoshino D, Sakamoto T, Kawasaki N, Koshikawa N, Seiki M. ZF21 protein regulates cell adhesion and motility. J Biol Chem. 2010;285:21013. doi: 10.1074/jbc.M110.106443. [DOI] [PMC free article] [PubMed] [Google Scholar]
Associated Data
This section collects any data citations, data availability statements, or supplementary materials included in this article.
Supplementary Materials
Fig S1. LY treatment of SCC25 cells decreases invadopodia activity. n≥80 cells per cell line from 3 independent experiments. Data shown in box-and-whiskers plots in which the median is represented with a line, the box represents the 25–75 percentile, and the error bars show the 5–95 percentile.
Fig S2. Average focal adhesion area data for Figs. 4A, 5B, 6C, and Fig S5D. Data shown in box-and-whiskers plots in which the median is represented with a line, the box represents the 25–75 percentile, and the error bars show the 5–95 percentile.
Fig S3. Western blot analyses and full image series data for Fig. 5. A. Western blot data for SCC25 cells expressing PI3K mutants ± PKCα siRNA. When the p110 mutants E545K and H1047R are expressed, there is a corresponding increase in phosphorylated Akt (p473 akt). Also PKCα is efficiently knocked down in PKCα siRNA-expressing cells, as indicated. B. Full image series for merged images in Fig 5. Scale bar = 20 μm.
Fig S4. Knockdown of PKCα in breast cancer and melanoma cells has an opposite effect on invadopodia activity depending on the PI3K status. A. Images from MDA-MB-231 cells overexpressing cells stably expressing the PI3K H1047R mutant and treated with control or PKCα-targeting siRNA (siPKCα#1 and #2), as indicated. B. Images from BT-549 breast cancer cells. C–E. Quantitation of invadopodia-associated degradation activity in MDA-MB-231 breast cancer, A375 melanoma, and BT-549 breast cancer cells, as indicated. Loss of PKCα selectively enhances degradation of ECM in cells when coupled with increased activity of the PI3K pathway, either through expression of mutant PI3K (H1047R MDA-MB-231 and A375 cells) or through loss of PTEN (BT-549 cells). n≥50 cells from at least 3 independent experiments were analyzed for each condition. Scale bars = 20 μm. Data shown in box-and-whiskers plots in which the median is represented with a line, the box represents the 25–75 percentile, and the error bars show the 5–95 percentile. * p<0.05, **p<0.01, ***p<0.001.
Fig S5. Inhibition of PKCα in SCC61 cells increases invadopodia activity. A. Images. B. Western blot. C. Quantitation of focal adhesion and invadopodia data. n≥70 cells per cell line for 3 independent experiments. Scale bar = 20 μm. Data shown in box-and-whiskers plots in which the median is represented with a line, the box represents the 25–75 percentile, and the error bars show the 5–95 percentile. *** p<0.001, n.s. = not significant.
Fig S6. PKCα knockdown leads to divergent Matrigel invasion phenotypes, depending on PI3K mutant status. Invasion of Matrigel-coated Transwell filters was analyzed using SCC25 cells expressing empty vector (Control), or activating PI3K mutant H1047R (SCC25-H1047R) with or without knockdown of PKCα (siPKCα#1 and #2). Due to the highly invasive nature of SCC25-H1047R, Matrigel invasion was allowed to proceed for 24 hours in that cell line, whereas 48 hours invasion time was required to assess invasion in control SCC25 cells. Invasion was blocked in the presence of matrix metalloproteinase inhibitors (+MMI). Data are shown as the mean + S.D from n=3 independent experiments, with triplicate determinations. **p<0.01
Fig S7. Visualizations of PRKCA and PIK3R1/PI(3,4,5)P3/PI(3,4)P2 binding interactions with focal adhesion and invadopodia proteins. Direct binding partners of PRKCA (A) or PIK3R1/PI(3,4,5)P3/PI(3,4)P2 (B) molecules that are either part of focal adhesion (Blue, FA), Invadopodia (Pink) or both (Green) networks are shown. Binding partners that are not part of either the focal adhesion or invadopodia networks are not shown. The yellow PIK3CA node that is connected to PRKCA shows a literature-based direct connection (55) that is not present in the HPRD protein interaction database.
Movies S1 and S2. SCC25 cells stably expressing H1047R PIK3CA mutant and transfected with non-targeting siRNA were stimulated with invadopodia medium after serum starvation.
Movies S3 and S4. SCC25 cells stably expressing H1047R PIK3CA mutant and transfected with siRNA targeting PKCα were stimulated with invadopodia medium after serum starvation.
SCC25 cells stably expressing H1047R PIK3CA mutant and transfected with non-targeting siRNA under basal conditions.
SCC25 cells stably expressing H1047R PIK3CA mutant and transfected with siRNA targeting PKCα under basal conditions.