Abstract
Background
Phosphorylation-dephosphorylation cycles (PDCs) mediated by kinases and phosphatases are common in cellular signalling. Kinetic modelling of PDCs has shown that these systems can exhibit a variety of input-output (dose-response) behaviors including graded response, ultrasensitivity and bistability. In addition to proteins, there are a class of lipids known as phosphoinositides (PIs) that can be phosphorylated. Experimental studies have revealed the formation of an antagonistic kinase-phosphatase complex in regulation of phosphorylation of PIs. However, the functional significance of this type of complex formation is not clear.
Results
We first revisit the basic PDC and show that partial asymptotic phosphorylation of substrate limits ultrasensitivity. Also, substrate levels are changed one can obtain non-monotonic bell-shaped dose-response curves over a narrow range of parameters. Then we extend the PDC to include kinase-phosphatase complex formation. We report the possibility of robust bell-shaped dose-response for a specific class of the model with complex formation. Also, we show that complex formation can produce ultrasensitivity outside the Goldbeter-Koshland zero-order ultrasensitivity regime through a mechanism similar to competitive inhibition between an enzyme and its inhibitor.
Conclusions
We conclude that the novel PDC module studied here exhibits new dose-response behaviour. In particular, we show that the bell-shaped response could result in transient phosphorylation of substrate. We discuss the relevance of this result in the context of experimental observations on PI regulation in endosomal trafficking.
Keywords: Cellular signalling, Zero-order ultrasensitivity, Phosphoinositide regulation, Endosomal trafficking
Background
Biochemical networks have a modular structure [1]. The functional modules have different dynamical and input-output properties [2,3]. For example positive feedback loops can produce bistability while negative feedback loops filter noise. An important biochemical module in cellular signalling is a phosphorylation-dephosphorylation cycle (PDC). Phosphorylation is a common post-translational covalent modification of proteins and lipids, that is mediated by kinases and needs ATP to proceed. However, dephosphorylation is mediated by phosphatases and does not need ATP to proceed. Phosphorylation can affect binding properties, localization and activity of proteins and receptors [4].
Systems with phosphorylation-dephosphorylation cycles can exhibit a variety of input-output or dose-response behaviors [5]. The level of phosphorylated substrate at steady-state is controlled by the kinase-phosphatase balance (KPB), i.e., the ratio of total active kinase to active phosphatase concentration. If the enzymes are far from saturation, the phosphorylated level of substrate is a graded function of the KPB. However, if the enzymes are saturated and are operate in zero-order regime, an ultrasensitive switch-like response is achieved where a small change in the KPB can produce a large change in the level of phosphorylated substrate [6]. Small modifications to the structure of these biochemical modules, such as the introduction of cooperativity or product inhibition can significantly affect their dynamical properties [7,8]. Cascades of phosphorylation-dephosphorylation cycles such as MAP kinase cascades also produce ultrasensitivity and amplification [5]. Multisite protein phosphorylation with distributive mechanism can produce robust ultrasensitivity [9]- [11]. Systems with multiple phosphorylation sites can exhibit additional dynamical properties including multistability [12,13]. Multisite phosphorylation can also result in robust ultrasensitivity outside zero-order regime through local saturation [14,15]. In addition, the order and the distributivity of phosphorylation affects the response properties of the system [4].
During endosome trafficking tagging molecules that specify the identity and the fate of different vesicles need to be tightly regulated in time. Two classes of molecules that have a fundamental role as molecular tags in membrane traffic are small GTPases and phosphopinositides (PIs) [16]. PIs are a type of cellular phospholipids that can undergo phosphorylation-dephosphorylation cycles. Although PIs are present at relatively low abundance, they have important roles in cellular regulation and membrane trafficking [17,18]. In particular, PIs can get phosphorylated at positions 3, 4 and 5 of their inositol headgroup, through organelle specific kinases and phosphatases [17,18]. Interestingly, several antagonistic kinase and phosphatase pairs regulating phosphorylation in PIs form complexes (Figure 1). Since these kinsase-phosphatase complex pairs have opposing effects, the formation of this kind of complexes between them is puzzling and their functional significance is not clear. For example, the Vps34 kinase generates PI(3)P on endosomes by phosphorylating the third position of the PI inositol headgroup and is regulated by Vps15 protein kinase [19]. Cao et al. [20,21] demonstrated that Vps34-Vps15 subcomplex could also interact in vivo and in vitro with the direct antagonist MTM1 and MTMR2 phosphatases, where Vps15 mediates the interaction between the Vps34 and the myotubularin isoforms.
Figure 1.

Kinase-phosphatase complexes. Identified or hypothesized kinase-phosphatase complexes in the PI regulation system. Full line represents in vivo and dashed line in vitro evidence. The data is based on the reference [22].
Another example of an antagonistic kinase-phosphatase pair in yeast and mammals is the Fab1 PI(5)P 5-kinase (also called PIP5K3 or ’PIKfyve’) and the Fig4 PI(3,5)P25-phosphatase (also called Sac3) [23]- [25]. Moreover, the existence of two new kinase-phosphatase complexes which play a role in the regulation of PI(5)P has also been hypothesized [22]. In particular, it has been proposed that a PIK3C (class-I PI 3-kinase) and myotubularin complex regulates the interconversion between PI(3,5)P2 and PI(5)P [22]. Less is known about the PIP5K2 4-kinases and PI(4,5)P2 4-phosphatases which regulate the interconversion between PI(4,5)P2 and PI(5)P, however, the existence of a corresponding kinase-phosphatase complex has also been speculated [22]. The identified and hypothesized kinase-phosphatase pairs are summarized in Figure 1. In summary, there is a growing evidence that a number of kinases and phosphatases can form a complex, but the exact role of such a kinase-phosphatase duo remains to be investigated [26]. Moreover, there is some evidence that this kind of complex formation is evolutionarily conserved which suggests functional significance [22]. Appropriate mathematical modelling may shed light on the functional roles of these complexes.
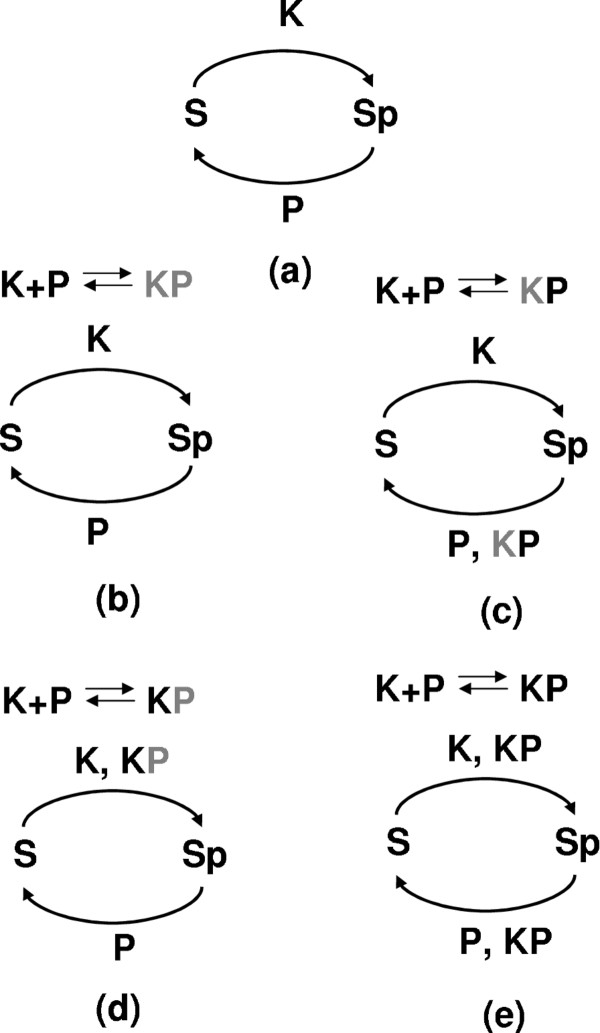
In this paper, we use mathematical modelling to investigate the dose-response in an extended phosphorylation-dephosphorylation cycle that includes complex formation between the kinase and phosphatase. In particular, we ask under what conditions the PDCs can exhibit a non-monotonic dose-response. To this end, we first revisit the basic PDC (Figure 2a) and show that depending on the parameters of the system it is possible to only achieve partial phosphorylation of the substrate even for large KPB. We then use this results to refine estimates of zero-order ultrasensitivity. We further show that at a fix kinase-phosphatase balance, if we change the substrate levels, it is possible to obtain non-monotonic bell-shaped dose-response. However, this behavior is only obtained over a narrow range of parameters.
Figure 2.
Reactions diagrams. (a) Reaction diagram for the basic model of phosphorylation-dephosphorylation cycle. (b-e) Reaction diagrams for the extended model with kinase-phosphatase complex formation. The complex can have kinase and/or phosphatase activity. The grey letters in the enzymatic complex name correspond to the inactive enzymes. There are four variants of the extended model with enzymatic complex having both inactive K and P (b), active P and inactive K (c), active K and inactive P (d) and both active K and P (e).
To investigate the properties of PDC with complex formation, we need to assume enzymatic activity of the kinase-phosphatase complex. Thus, we study four different variants of the extended PDC module, where the complex exhibits kinase and/or phosphatase activity (Figure 2b-e). We observe that the module can produce an ultrasensitive response outside the zero-order regime. In addition, we observe robust bell-shaped non-monotonic dose-responses in a variant of the module where the complex has phosphatase activity. Finally, we discuss our results in the context of PI regulation and endosome trafficking.
Results and discussion
Basic model of phosphorylation-dephosphorylation cycle
We shall consider a system in which a substrate can exist in the unphosphorylated form S and phosphorylated form Sp. The substrate could represent a protein or a PI. A kinase K and a phosphatase P mediates phosphorylation and dephosphorylation (Figure 2a). S and Sp are controlled by the following enzymatic reactions:
| (1) |
| (2) |
where, the rate constants are denoted λ1,λ2 for binding an enzyme and substrate, λ−1,λ−2 for dissociation of the complex and k1,k2 for the catalytic reaction. The association rates (λi) have units μM−1s−1, whereas dissociation (λ−i) and catalytic (ki) rates have units s−1. The kinetic equations governing the time evolution are
| (3) |
| (4) |
| (5) |
| (6) |
This system is complemented by conservation equations
| (7) |
| (8) |
where the total enzyme Kt,Pt and substrate St concentrations are in μM and are often assumed to be constants. At equilibrium,
| (9) |
where the Michaelis constants (i = 1,2) are in μM.
The system (3)-(8) has been extensively studied over the past 30 years since the key study of zero-order ultra-sensitivity by Goldbeter and Koshland [6]. Most studies look at the steady-state dose-response of the average phosphorylated substrate versus the kinase-phosphatase balance (Kt/Pt). As a measure of phosphorylated substrate one can either look at the fraction of total phosphorylated substrate (R = ([Sp] + [SpP])/St) or at the fraction of free phosphorylated substrate (R′ = [Sp]/St). The relevant functional form could be either free or total phosphorylated substrate depending on the specificity of substrate binding sites for phosphatases and recognized targets. In this study, we follow other works that use the fraction of total phosphorylated substrate (R) to study the dose response in the PDCs [7,27]. An important approximation used to analyse these systems is the quasi steady-state assumption (QSSA) [28] which assumes that the enzyme-substrate complex concentration remains approximately constant over time (apart from a fast initial transient). Under QSSA, total (R) and free (R′) follow the same trends.
Most studies assume that the kinase-phosphatase balance is changed by varying the level of kinase (Kt), while keeping the phosphatase levels (Pt) constant. This is probably the most relevant regulation that happens in cellular systems. For example, in a MAPK cascade the activity of upstream kinase is increased while effectively the level of phosphatase remains constant. However, this way of varying KPB is asymmetric with respect to R. This is why our analysis shows that for low KPB the fraction R is always close to zero (no phosphorylation of substrate), however for large KPB the fraction R can take any value smaller than one (partial asymptotic phosphorylation of substrate). There are two other ways that KPB can be changed. Another asymmetric method is to keep kinase levels constant and change the level of phosphatase. An example of this kind of regulation has been recently reported in the regulation of yeast mating pathway [14]. A symmetric way of changing KPB is to keep the total level of kinase and phosphatase constant and change the ratio only. This is probably less relevant to cellular systems. However, this way of changing KPB will always result in full asymptotic phosphorylation of substrate at large KPB. Finally, it should be noted that while over some signalling time scales KPB might increase monotonically, over longer time scales there are typically negative feedbacks in place that would decrease KPB, e.g., by increasing the levels of phosphatases [29,30]. In this study, we focus on short-term monotonic changes of KPB ignoring the slow negative-feedback processes.
Partial asymptotic phosphorylation of substrate and Hill numbers in the basic model
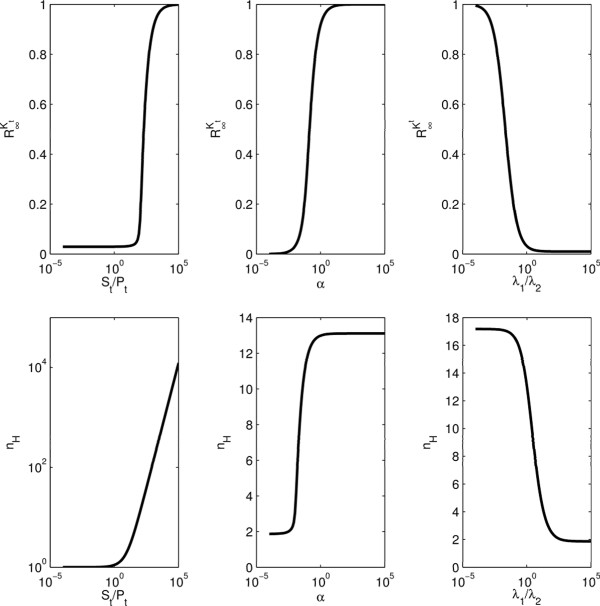
Under QSSA, the asymptotic limit of R for large kinase-phosphatase balance (e.g., as Kt → ∞), denoted by is always one, meaning that the substrate gets fully phosphorylated. However, this is not the case in general when QSSA is not valid, as shown using the exact steady-state solution of (3)-(8) (see Methods). In fact, the asymptotic phosphorylation can be very small for some parameter values as seen using the analytically calculated dependence on the relevant parameter ratios St/Pt,α,λ1/λ2 in Figure 3(a). Intuitively, the substrate is only partially asymptotically phosphorylated when the phosphatase can sequester a significant fraction of substrate by either saturating the substrate (small ), having higher catalytic rate (small ), or having a higher affinity for substrate than kinase (large ) (Figure 3(a)) [31]. Similar results have been previously obtained for other protein modification cycles [32]. The observed limits in Figure 3(a) are for St/Pt → ∞ and for λ1/λ2→∞; these results are obtained in the Methods section.
Figure 3.
and nH for the basic model. (a) is computed analytically as St/Pt, αand λ1/λ2 is varied. Baseline parameter values used for the basic model, are: λ−1 = 1 s−1,λ1 = 1 M−1s−1,k1 = 1 s−1,λ−2 = 1 s−1,λ2 = 1μM−1s−1,k2 = 0.01 s−1,Pt = 1μM,St = 10μM.(b) nH is computed analytically as St/Pt, αand λ1/λ2is varied. Baseline parameter values used for the basic model are: λ−1 = 1 s−1,λ1 = 1μM−1s−1,k1 = 1 s−1,λ−2 = 1 s−1,λ2 = 1μM−1s−1,k2 = 1 s−1,Pt = 1μM,St = 100μM.
Goldbeter and Koshland have introduced analytical formulas for the response coefficient (which is defined as the ratio of the kinase concentration required to give 90% response relative to the concentration required to give 10% response; assuming constant phosphatase concentration), both using QSSA and the exact steady-state solution. These results, however, do not take into account the limit of R which in general can be smaller than one and based on which the 10% and 90% value should be calculated. Here, we have used results for R obtained analytically to introduce a new response coefficient formula and hence, to find the Hill-number (see methods). To illustrate our analysis, we have looked at the dependence of the analytically calculated nHwith respect to relevant parameter ratios St/Pt,α,λ1/λ2 (Figure 3(b)). Comparison with numerically obtained values of and nH(obtained by fitting a Hill function; not shown) confirms our analytical results. As expected, nHis very large at high substrate to phosphatase concentration ratio (zero-order regime; Figure 3(b)). Interestingly, large changes in nHare also obtained when α and λ1/λ2 are varied. Comparing results in Figure 3(a) and Figure 3(b) suggests that high Hill numbers are only achieved when is close to zero. However, modest ultrasensitivity is present even at very low asymptotic phosphorylation levels of substrate. These results are also consistent with another work which suggests that substrate sequestration can significantly reduce ultrasensitivity [31].
Bell-shaped dose-response in the basic model
Most biochemical signalling that involves phosphorylation is mediated by changes of KPB by either regulating the level of active kinase or active phosphatase as explained above. However, one can imagine cases where the substrate level can change, while the KPB is relatively constant. Therefore, it is interesting to ask what kind of dose-response one can expect when the substrate levels are changed.
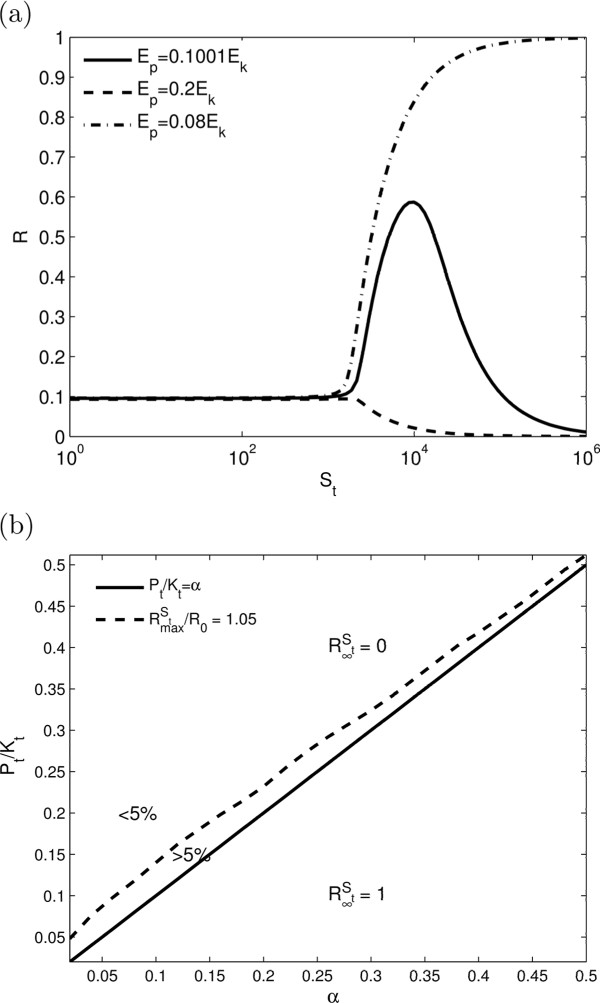
To address this question we introduce asymptotic phosphorylation of substrate for large substrate levels (as Kt → ∞) denoted by . As shown in the Methods, when the maximum speed of kinase activity is greater than the maximum speed of phosphatase activity ( ), the asymptotic phosphorylation is , since kinase activity wins at large St. For this case we observe a monotonic increasing dose-response with mild ultrasensitivity with Hill coefficients about 2 (Figure 4(a)). More interesting behaviour is achieved for the case when the maximum speed of kinase activity is less than the maximum speed of phosphatase activity ( ) and the asymptotic phosphorylation is . In this case, there are specific parameters, where a bell-shaped non-monotonic dose-response can be observed (Figure 4(a)). As St is increased from zero, R is initially a constant that is set by the KPB. For large St, it eventually approaches its asymptote of zero. For most parameters, the transition from constant R to zero is monotonic (Figure 4(a)). However, as shown in Figure 4(b), over a narrow region of parameters above the line Pt/Kt = α, it can exhibit a significant non-monotonic bell-shaped response. The bell-shaped response is produced as the transition from to is approached at Pt/Kt = α (See Eq. 26 in the Methods). Since, this behaviour is only achieved with fine tuning of the parameters and therefore is not expected to be of biological relevance.
Figure 4.
Bell-shaped dose-response for the basic model. (a) Bell-shaped dose response for the basic model when St is varied. Parameters used are: λ−1 = λ1 = λ2 = λ−2 = 0.1s−1,k1 = 1 s−1,k2 = 0.1s−1,Kt = 2000μM,Ep = 0.1001Ek(−),Ep = 0.2Ek(−−),Ep = 0.08Ek(−.) (b) 2D parameter plot when αand Pt/Kt are varied. Parameters used are λ−1 = λ1 = λ2 = λ−2 = 0.1 s−1,α = 0.1,Kt = 2000μM. denotes the maximum of Rwith respect to St and . Within a narrow region above the line Pt/Kt = α the ratio , i.e., there is at least a 5% increase in compared to R0.
Model with kinase-phosphatase complex formation
In this section we consider an extension to the basic model of phosphorylation-dephosphorylation cycle (Figure 2). We assume that the phosphatase and kinase can form a single protein complex PK given through a reversible reaction (10):
| (10) |
Depending on which enzyme is ’on’ or ’off’ within the kinase-phosphatase complex, the substrates S/Spcould be further phosphorylated/dephosphorylated by PK as shown in (11) and (12):
| (11) |
| (12) |
In (10)-(12), the parameters κ1,λ3,λ4 and κ−1,λ−3,λ−4 correspond to the association/dissociation rates, respectively, and k3,k4 represent the catalytic reactions. Here we define a parameter ω = κ−1/κ1, similar to the concept of a ’dissociation constant’, which expresses the affinity of binding between the phosphatase P and kinase K.
There are four possibilities as shown in Figure 2; both enzymes in the complex could be enzymatically inactive (Figure 2(b)), only phosphatase active (Figure 2(c)), only kinase active (Figure 2(d)) or both kinase and phosphatase active (Figure 2(e)). This system is described by the following kinetic equations
| (13) |
| (14) |
| (15) |
| (16) |
| (17) |
| (18) |
| (19) |
coupled with conservation equations
| (20) |
| (21) |
We note that the the extended model (13)-(21) is too complicated to find the corresponding steady-states analytically. In the following we have used numerical integration of the kinetic equations above and variants of the QSSA to study the dose-response in this system. The ration of phosphorylated substrate in the extended model is now defined as R=([Sp] + [SpP] + [SpPK])/St. Our goal is to determine the dose-response for R as a function of KPB in the extended model. We have mainly focused on the kinase active case and the phosphatase active case which are the two extreme scenarios (Figure 2(c)-(d)).
Ultrasensitivity
We observe ultrasensitivity for both the kinase active-phosphatase inactive and the phosphatase active-kinase inactive cases outside the zero-order regime, where St <Pt (Figure 5). For the phosphatase active case, the mechanism is similar to the previously described reversible competitive inhibition, where the substrate and the inhibitor cannot bind the enzyme at the same time [5]. In this case, when the level of K is increased, initially it binds to P and forms KP that acts as a phosphatase and R remains close to zero. However, at some level of K, most of the free P will be in complex with K. Above this level a small increase in K changes the phosphorylation level of substrate (R) nonlinearly, producing ultrasensitivity.
Figure 5.
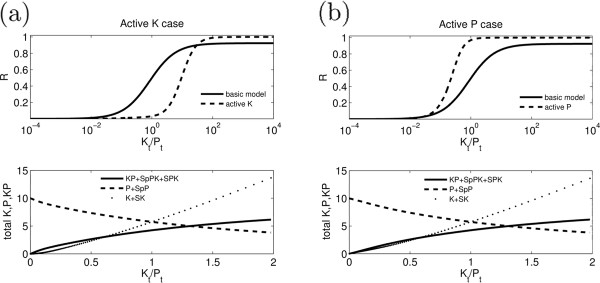
Ultrasensitivity. (a) R, total K, P and KP are numerically calculated as KPB is changed in the extended model with only kinase active (Figure 2d). Parameters used are: λ−1 = 10 s−1,λ1 = 1μM−1s−1,k1 = 100 s−1,λ−2 = 10 s−1,λ2 = 1μM−1s−1,k2 = 100 s−1,λ−4 = 10 s−1,λ4 = 100μM−1s−1,k4 = 0.01 s−1,κ−1 = 10 s−1,κ1 = 1μM−1s−1,Pt = 10μM,St = 1μM.Hill coefficient for basic model and active K is nH = 1 and nH = 1.8, respectively. (b) R, total K, P and KP are numerically calculated as KPB is changed in the extended model with only phosphatase active (Figure 2c). Parameters used are: λ−1 = 10 s−1,λ1 = 1μM−1s−1,k1 = 100 s−1,λ−2 = 10 s−1,λ2 = 1μM−1s−1,k2 = 100 s−1,λ−3 = 10 s−1,λ3 = 100μM−1s−1,k3 = 0.01 s−1,κ−1 = 10 s−1,κ1 = 1μM−1s−1,Pt = 10μM,St = 1μM. Hill coefficient for basic model and active K is nH = 1 and nH = 1.95, respectively. In both case the bottom panels show that the level of enzymes remains above the substrate, so we are far from the zero-order regime.
The mechanism of ultrasensitivity for the kinase active case is novel. In this case, when the level of K is increased, it binds to P and forms KP that acts as a kinase. Therefore, increasing levels of K has the compound effect of increasing the kinase activity and at the same time reducing the phosphatase activity, resulting in a nonlinear increase in R and an ultrasensitive response. As shown in the Figure 5, both ultrasensitivity mechanisms are independent of the enzyme saturation and can produce sharp responses in the parameter regime where the basic model cannot.
Bell-shaped dose-response curves
The active phosphatase case, when the kinase is ’off’ and the phosphatase is ’on’ in the protein complex is interesting since it can exhibit a non-monotonic response. Suppose that the affinity between P and K is low and the PK complex is a stronger phosphatase than P alone (with a lower ). In this case, when the level of K is increased initially, the KP production is small. However, the kinase activity soon takes over the phosphatase activity and R is increased close to . As K is increased, the KP production becomes more dominant, and, since KP is a stronger phosphatase, the is dropped to a lower level, hence, producing a bell-shaped response. As Kt → ∞, the limit of the response curve has been derived earlier for the basic model. This measure can give an estimate of the peak level of R. However, this -formula could be used for the active P case as well. Indeed, at high Kt concentrations the free phosphatase is close to zero and we effectively reduce to the basic model with only K and PK around. Hence, replacing the parameters λ1,λ−1,k1 by λ3,λ−3,k3 in (27) gives the desired result for the asymptotic level of R.
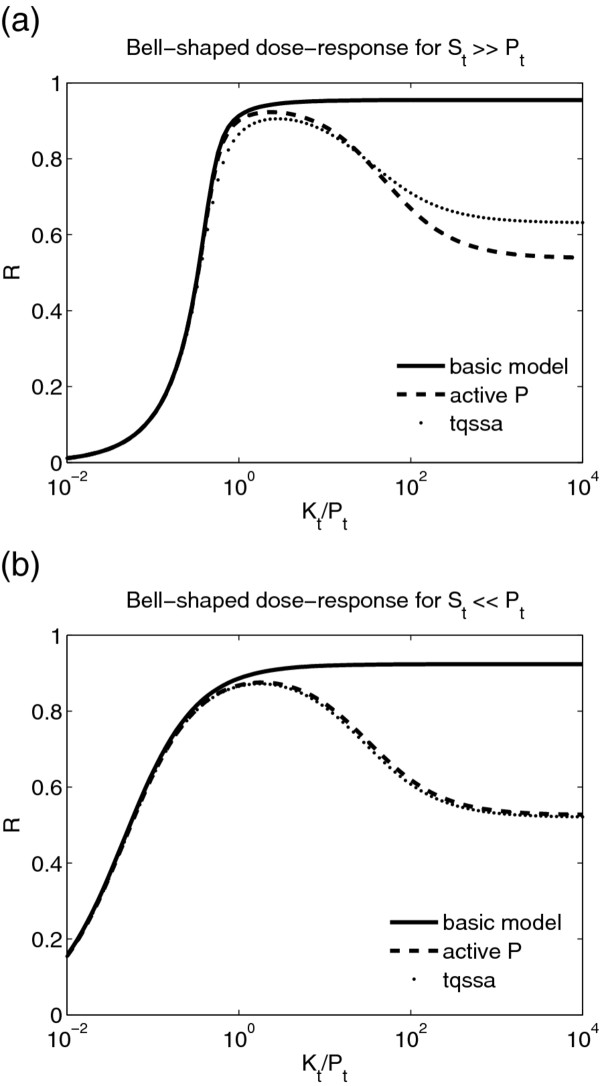
Bell-shaped responses could be obtained both at high enzyme saturation (St ≫ Pt), and at low enzyme saturation (St ≪ Pt). Figures 6(a)-(b) compare the response curve for the active P with the response curve for the corresponding basic model for both scenarios. The only difference is that for the low enzyme saturation we have an ultrasensitive rise to the peak of the bell-shaped response, whereas for the high enzyme saturation there is a linear rise to the peak.
Figure 6.
Bell-shaped dose-response in the active phosphatase case (Figure2c). (a) Bell-shaped response in the zero-order regime when St ≫ Pt. Parameters used are: λ−1 = 10 s−1,λ1 = 1μM−1s−1, k1 = 1 s−1,λ−2 = 10 s−1,λ2 = 20μM−1s−1,k2 =1 s−1,λ−3 = 10 s−1,λ3 = 1μM−1s−1,k3 = 100cs−1,κ−1 = 50 s−1,κ1 = 1μM−1s−1,Pt = 1μM,St = 10μM. The Hill coefficient for the basic model is nH = 2.15. (b) Bell-shaped response outside the zero-order regime when St ≪ Pt: λ−1 =10 s−1,λ1 = 1μM−1s−1,k1 = 1 s−1,λ− 2= 10 s−1,λ2 = 20μM−1s−1,k2 = 1 s−1,λ−3 = 10 s−1,λ3 = 1μM−1s−1,k3 = 100 s−1,κ−1 = 50 s−1,κ1 = 1μM−1s−1,Pt = 1μM,St = 0.1μM. The Hill coefficient for the basic model is nH = 1. In (a)-(b), the full line corresponds to the basic model, the dashed line is numerical results for the extended model and the dotted line shows the tQSSA approximation.
The steady-state solutions of the extended model can only be defined implicitly. Hence, we can use the total quasi-steady-state-approximation (tQSSA), which is more generally valid than the QSSA [33,34]. The tQSSA method has been successfully applied to a model with a pair of enzymes and substrates (analogous to the basic PDC) [27] and to coupled PDCs [35]. The details of the tQSSA method are explained in the Methods section. The results of tQSSA calculation is consistent with the numerical results in Figures 6(a)-(b). The fact that tQSSA but not QSSA can explain the bell-shaped response suggests that the dynamic of enzyme-substrate complex contributes to the presence of the non-monotonic response.
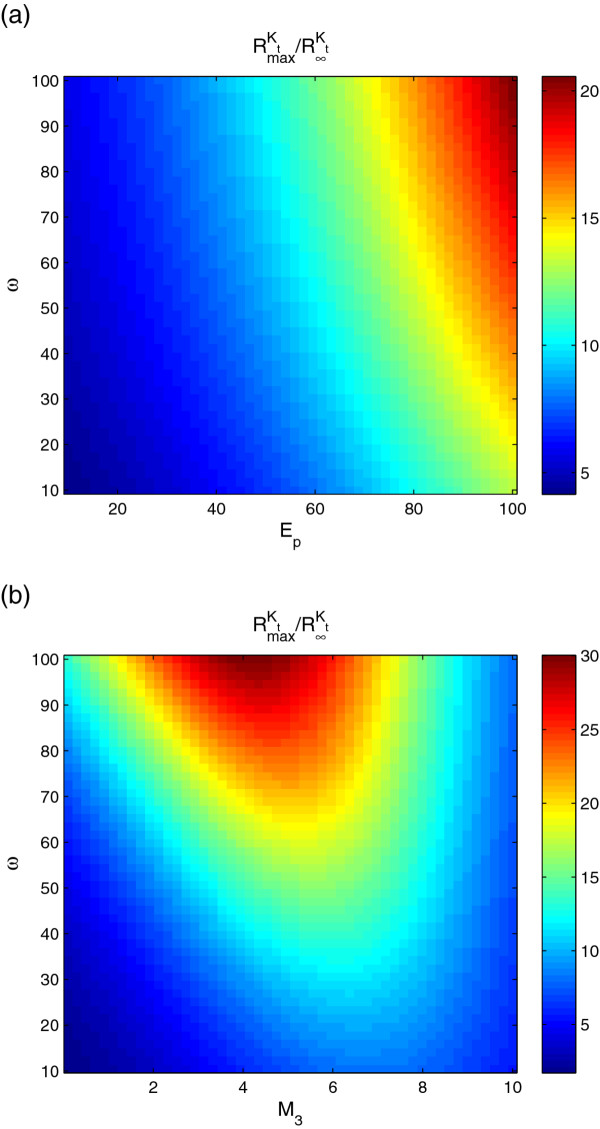
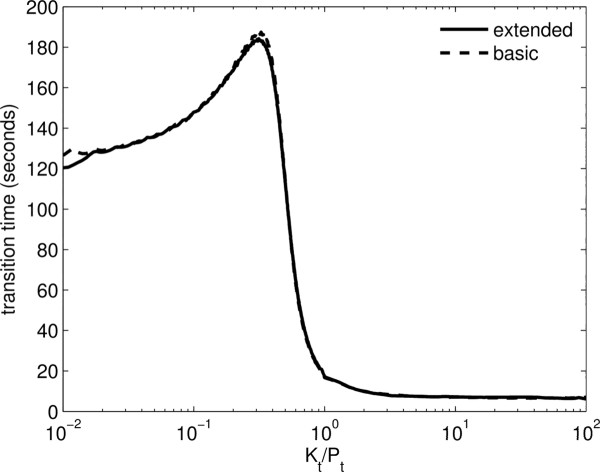
We have investigated the robustness of the bell-shaped response by varying some of the key parameters. We have characterised the bell-shape response by looking at the ratio of the maximum response to asymptotic phosphorylation as a function of dissociation constant of the phosphatase-kinase complex , the Michaelis-Menten constant of the complex and the total phosphatase level Pt(Figure 7). It is possible to obtain significant bell-shaped responses over a large range of parameters. The response has the highest relative peak for large values of ω and Pt(Figure 7(a)), however for each parameter set there is an optimal value of M3(Figure 7(b)). Also, we have compared the transient time needed to approach steady-state in the extended model with active P (Figure 8). We observe that the transient time for the extended model follows closely the transient time for the basic model and it goes through a maximum at the threshold of ultrasensitivity. This is because the enzymatic complex formation is fast compared to phosphorylation and dephosphorylation.
Figure 7.
Robustness of the bell-shaped response. To illustrate the robustness of the bell-shaped response, the ratio of , the maximum of R with respect to Kt, to is calculated as multiple parameters are varied. The red regions correspond to parameter values with the largest bell-shaped response. (a) ω and Pt are varied (κ−1as a variable in ω). (b) ω and M3 are varied (κ−1 as a variable in ωand λ3 as a variable in M3). Parameter values used in the extended model with only phosphatase active in (a) and (b): λ−1 = 10 s−1,λ1 = 1μM−1s−1,k1 = 1 s−1,λ−2 = 10 s−1,λ2 = 20μM−1s−1,k2 = 1 s−1,λ−3 = 10 s−1,λ3 = 1μM−1s−1,k3 = 100 s−1,κ−1 = 10 s−1,κ1 = 1μM−1s−1,Pt = 1μM,St = 10μM.
Figure 8.
Transient times to approach steady-state for the basic and extended model. Parameter values for the basic model: λ−1 = 10 s−1,λ1 = 1μM−1s−1,k1 = 1 s−1,λ−2 = 10 s−1,λ2 = 20μM−1s−1,k2 = 1 s−1,Pt = 1μM,St = 10μM.Parameter values for the extended model: λ−1 = 10 s−1,λ1 = 1μM−1s−1,k1 = 1 s−1,λ−2 = 10 s−1,λ2 = 20μM−1s−1,k2 = 1 s−1,κ−1 = 50 s−1,κ1 = 1μM−1s−1,λ−3 = 10 s−1,λ3 = 1μM−1s−1,k3 = 100 s−1,Pt = 1μM,St = 10μM.The transient times for R = ([Sp] + [SpP] + [SpPK])/St were estimated such that the absolute difference between the positive steady-state and the time solution at the transient time is within a small tolerance and that the transient times do not change too much if the tolerance is varied. Hence, we chose the tolerance to be 10−4.
Possible role for complex formation in phosphoinositides regulation
We propose that complex formation can contribute to the transient regulation of PIs observed experimentally in endosome trafficking [36]. Suppose the kinase is being recruited to the vesicle with a constant rate (slower than the time scale for the transient behaviour in Figure 8) and there is a fixed level of phosphatase on the vesicle. This produces a gradual change in KPB. If there is complex formation and the complex has phosphatase activity, in the parameter regime where we have bell-shaped dose-response as discussed above, the level of phosphorylated PI goes through a maximum as KPB is changed over time. This can produce a fast and accurate transient change in the phosphorylation of PI.
Botelho [37] has speculated on the possible role of enzymatic complex formation in transient regulation of PIs but he has proposed an alternative mechanism to achieve a transient behaviour. This alternative explanation assumes that there is a signaling trigger that activates the phosphatase relative to the kinase in the enzymatic complex leading to the down-regulation of phosphorylated PI on the membrane. Therefore enzymatic activity of the complex switches from kinase to phosphatase upon signalling. The signalling trigger might be the recruitment of other vesicles or GTP hydrolysis by GTPases [37]. The Fab1-Figure 4 and Vps34-MTM complexes in PI regulation could follow this concept (Figure 1).
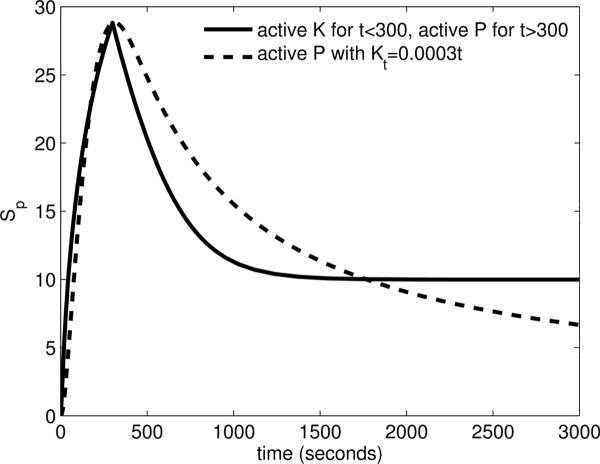
In Figure 9 we have compared the time evolution of phosphorylated substrate (PI) following the two alternative mechanisms mentioned above. In the first scenario, we assume a hypothetical recruitment of kinases over time to the membrane, fixed levels of phosphatase on the membrane and the active phosphatase activity in the PK complex. In the second scenario following Botelho [37], we assume a fixed level of kinase and phosphatase and we assume a switch in the enzymatic activity of the PK complex from kinase to phosphatase at t = 300 s. Both scenarios can result in fast transient phosphorylated substrate which peaks at 300 seconds, while our proposed mechanism results in faster decay as Kt increases over time. While both phosphorylation profiles in Figure 9 are in qualitative agreement with the observed profiles in the process of endocytosis [36], however, the dynamic of available kinase is quite different in the two models and can be used to experimentally test our proposed hypothesis. Note that in our proposed mechanism, the asymptotic phosphorylation level of the substrate does not get to zero, however, by increasing the phosphatase activity of the complex, one can make this asymptotic phosphorylation arbitrarily small. Also, a counter intuitive aspect of our proposed model is that if the kinase levels are down-regulated, then the phosphorylation of the substrate could even increase again. So, one requires no down-regulation of the upstream kinase over the relevant time-scales of the transient PI profiles. Ultimately, the response of the PDC module should be considered in the context of the larger PI regulation network (Figure 1) to be able to obtain a full understanding of the role of enzymatic complex formation in the endosome trafficking.
Figure 9.
Transient phosphorylation of phosphoinositides due to enzymatic complex formation. Comparison of the two scenarios; solid line represent the case when a signalling trigger is simulated. Parameters used are the following: λ−1 = 10 s−1,λ1 = 1μM−1s−1,k1 = 1 s−1,λ−2 = 10 s−1,λ2 = 1μM−1s−1,k2 = 1 s−1,κ−1=50s−1,κ1 = 1μM−1s−1,Kt = 0.1μM,Pt = 0.2μM,St = 300μM.The other parameters are λ−4 = 1 s−1,λ4 = 75μM−1s−1,k4 = 100 s−1for t≤300 s and λ−3 = 10 s−1,λ3 = 10μM−1s−1,k3 = 500 s−1, for t>300s. Dashed line represent the case when kinases are recruited linearly in time as Kt = 0.0003t. Other parameters used are the following: λ−1 = 10 s−1,λ1 = 1μM−1s−1,k1 = 1 s−1,λ−2 = 10 s−1,λ2 = 1μM−1s−1,k2 = 1 s−1,κ−1 = 50 s−1,κ1 = 1μM−1s−1,λ−3 = 10 s−1,λ3 = 10μM−1s−1,k3 = 500 s−1,Pt = 0.2μM,St = 300μM.
Conclusions
In this paper, we have studied the steady-state dose-response in basic PDC motif and a modified PDC motif using analytical and numerical methods. We first showed that there are parameter regimes where even at large KPB the phosphorylated ratio of substrate remains small. This is not expected from the QSSA analysis of the basic PDC, and it is a consequence of efficient phosphatase binding to a substrate. This results in modified estimates of the Hill number in zero order ultrasensitivity. In addition, we observe that partial asymptotic phosphorylation of substrate limits the ultrasensitive behavior. Over a narrow parameter regime, one can obtain a bell-shaped dose-response when the substrate level is changed for a fix KPB level. We then studied a modified PDC motif where the antagonistic kinase and phosphatase can form a complex. Depending on the activity of the kinase and phosphatase within the complex, the modified system has four different cases. We investigated the possible dose-response curves in all scenarios. We observed a novel form of ultrasensitivity arising from complex-formation that can function outside the zero-order regime. Also, we report a non-monotonic bell shaped dose-response for the phosphatase active-kinase inactive case that can function over a wide-range of parameters.
Complex formation between antagonistic enzymes have been reported in the PI regulatory network (Figure 1). Motivated by the observed bell shaped dose-response, we propose the complex formation between the kinase and phosphatase may contribute to the observed transient regulation of PIs during endosome maturation [36]. It has been recently proposed that the complex formation observed in several kinase-phosphatase pairs in the PI regulation may enhance the temporal regulation of the PIs [37]. Here we have shown that if the complex has enhanced phosphatase activity and negligible kinase activity, then the dose-response will be bell-shaped. This mechanism produces a transient increase in the phosphorylation level of the PIs as enzymes are recruited to the endosomes and PKB is changed over time. There is no need for additional regulators or triggering mechanisms, but only monotonic change of the PKB on the endosome by enzymatic recruitment. Experimental measurement of enzymatic activity within the complexes are still missing. Our model predicts that an enhanced phosphatase activity within the complex gives rise to bell-shaped dose-response. Also, we predict that alteration of the total level of enzymes or the affinity of enzymes in the complex will have a significant effect on the height of the bell-shaped response.
Our study illustrates that simple alterations of the regulatory motifs in biochemical networks can have a significant consequence on the response and functionality of these systems. Signalling systems are typically composed of several interlinked regulatory motifs. To ultimately understand the function of the whole system one needs to put the motifs together and investigates the coordinated dynamic behaviour of all the components as they interact with one another. In the context of the PI regulation, as shown in Figure 1, there are several PDC motifs with enzymatic complex formation. As shown here, these motifs can produce ultrasensitive or non-monotonic dose-response depending on their biochemical parameters. The challenge that remains is to quantify these parameters and explain the overall function by investigating the interplay between the dynamic of individual motifs.
Methods
Limit of the average fraction of phosphorylated substrate for Kt → ∞ and St → ∞
We derive limiting values for the average fraction of phosphorylated substrate R = ([Sp] + [SpP])/Stat steady-state as Kt → ∞ and St → ∞, respectively. First, we will implicitly define the steady-state [SK] as a solution of the cubic equation
| (22) |
The coefficients Qi(i = 1,2,3) are of the form Q1 = −Kt+ v1, Q2 =u1Kt+ v2, Q3 =u2Kt with
where . It follows from (3) and (9) that αsatisfies
| (23) |
and hence,
| (24) |
for Pt > 0. The asymptotic expansion of [SK] with respect to powers of in (22) implies that the asymptotic limit of [SK], i.e., satisfies the quadratic equation
By condition (24) we obtain that
| (25) |
Note that and do not depend on M2 and hence, does not change when λ2 or λ−2 is varied. Intuitively, this is because for high kinase levels the substrate will be saturated and the will not be influenced by the dissociation constant of kinase-substrate binding. By (9) and (23) the phosphorylated substrate fraction R could be re-written as
| (26) |
For Kt → ∞, the limiting value of R denoted by becomes
| (27) |
where is given by (25). It is shown in the Methods section (Corollary 1) that R ≤ 1 as expected.
For St → ∞, we also include a statement about the limiting value of R denoted by , which will be useful later on (for proof see Corollary 2 in the Methods section). If , then and R → 1 as St → ∞, otherwise, [SK] → Ktand R → 0 as St → ∞. That is,
Corollary 1–3
Corollary 1. The ratio R satisfies
Proof. It is sufficient to show that since and hence, R is monotone increasing with respect to Kt and is its maximum. is equivalent to the condition
| (28) |
To show that (28) holds we use that and that (this follows from (24)). Multiply (28) by to get
| (29) |
Note that the left-hand side of (29) is equivalent to
and this concludes the proof. □
Corollary 2. If , then and R → 1 as St → ∞. If , then [SK] → Ktand R → 0 as St → ∞.
Proof. Denote . It follows from (22) that satisfies the quadratic equation
and then
Thus, if and otherwise. Obviously, if , then . To see that if , then , we show that [Sp]→Stas St→∞. Indeed, note that as St→∞. Hence, [Sp]=St−[SK]−[SpP]−[S]→Stas St→∞ and so when . □
The following Corollary is introduced without its proof, although, the arguments would be similar to Corollary 2.
Corollary 3. It holds that:
i) as St → ∞ and as St → ∞
ii) as α → ∞ and as α → ∞
iii) If , then as λ1 → ∞ and as λ1 → ∞. If , then as λ1 → ∞ and as λ1 → ∞.
Hill numbers
The Hill number is defined as
where is the response coefficient [6]. Solving for SK from (26) and by condition (24) we obtain
| (30) |
We also find Kt from (22) to be
| (31) |
Given , we have and . Then we can obtain SK90 and SK10 from (30) and finally, and from (31). This gives the Hill number nH.
Steady-state approximation using tQSSA
The tQSSA replaces the free substrate Sp as the slow variable by the total intact substrate concentration Sp+ SpP, while retaining the quasi-steady-state assumption for the intermediate complexes. Since the extended model has 3 products (Sp,S and PK), we introduce 2 slow variables (total Sp and total PK concentrations).
Denote C1 = [SpP],C2 = [SpPK],C3 = [SK],C4 = [PK] and let X = C2 + C4 to be the total PK concentration and A = [Sp] + C1 to be the total Sp concentration, respectively. Then it holds that
The variables A and X satisfy the following equations
| (32) |
| (33) |
We hypothesize that the intermediate complexes C1,C2,C3 have faster dynamics then the active protein A. At steady-state, the intermediate complexes satisfy
| (34) |
| (35) |
| (36) |
The simulations of the tQSSA approach are shown in Figure 5.
Competing interests
The authors declare that they have no competing interests.
Authors' contributions
VS conceived the study and BSz performed the research. BSz and VS analyzed results and wrote the paper. Both authors read and approved the final manuscript.
Contributor Information
Barbara Szomolay, Email: b.szomolay@warwick.ac.uk.
Vahid Shahrezaei, Email: v.shahrezaei@imperial.ac.uk.
Acknowledgements
The research leading to these results has received funding from the European Community’s Seventh Framework Programme FP7/2007-2013 under grant agreement no. HEALTH-F4-2008-223451. The authors would like to thank Dr. Brian Robertson for coordinating this project. The authors also would like to thank Dr. Omer Dushek for his helpful comments on this work.
References
- Hartwell LH, Hopfield JJ, Leibler S, Murray AW. From molecular to modular cell biology. Nature. 1999;402:C47–C52. doi: 10.1038/35011540. [DOI] [PubMed] [Google Scholar]
- Tyson JJ, Chen KC, Novak B. Sniffers, buzzers, toggles and blinkers: dynamics of regulatory and signaling pathways in the cell. Curr Opin Cell Biol. 2003;15:221–231. doi: 10.1016/S0955-0674(03)00017-6. [DOI] [PubMed] [Google Scholar]
- Alon U. An Introduction to Systems Biology: Design Principles of Biological Circuits. London: CRC Press; 2006. [Google Scholar]
- Salazar C, Hofer T. Multisite protein phosphorylation–from molecular mechanisms to kinetic models. FEBS J. 2009;276:3177–3198. doi: 10.1111/j.1742-4658.2009.07027.x. [DOI] [PubMed] [Google Scholar]
- Ferrel JE. Tipping the switch fantastic: how a protein kinase cascade can covert graded inputs into switch-like outputs. Trends in Bioch Sci. 1996;21:460–466. doi: 10.1016/S0968-0004(96)20026-X. [DOI] [PubMed] [Google Scholar]
- Goldbeter A, Koshland DE. An amplified sensitivity arising from covanlent modification in biological systems. PNAS. 1981;78:6840–6844. doi: 10.1073/pnas.78.11.6840. [DOI] [PMC free article] [PubMed] [Google Scholar]
- Salazar C, Hofer T. Kinetic models of phosphorylation cycles: a systematic approach using the rapid-equilibrium approximation for protein-protein interactions. Biosystems. 2006;83:195–206. doi: 10.1016/j.biosystems.2005.05.015. [DOI] [PubMed] [Google Scholar]
- Xing J, Chen J. The Goldbeter-Koshland switch in the first-order region and its response to dynamic disorder. PLoS ONE. 2008;3:e2140. doi: 10.1371/journal.pone.0002140. [DOI] [PMC free article] [PubMed] [Google Scholar]
- Ferrell JEJr, Bhatt RR. Mechanistic studies of the dual phosphorylation of mitogen-activated protein kinase. J Biol Chem. 1997;272:19008–19016. doi: 10.1074/jbc.272.30.19008. [DOI] [PubMed] [Google Scholar]
- Deshaies RJ, Ferrell Jr JE. Multisite phosphorylation and the countdown to S phase. Cell. 2001;107:819–822. doi: 10.1016/S0092-8674(01)00620-1. [DOI] [PubMed] [Google Scholar]
- Bluthgen N, Herzel H. How robust are switches in intracellular signaling cascades? J Theor Biol. 2003;225:293–300. doi: 10.1016/S0022-5193(03)00247-9. [DOI] [PubMed] [Google Scholar]
- Markevich NI, Hoek JB, Kholodenko BN. Signaling switches and bistability arising from multisite phosphorylation in protein kinase cascades. J Cell Biol. 2004;164:353–359. doi: 10.1083/jcb.200308060. [DOI] [PMC free article] [PubMed] [Google Scholar]
- Thomson M, Gunawardena J. Unlimited multistability in multisite phosphorylation systems. Nature. 2009;460:274–277. doi: 10.1038/nature08102. [DOI] [PMC free article] [PubMed] [Google Scholar]
- Malleshaiah MK, Shahrezaei V, Swain PS, Michnick SW. The scaffold protein Ste5 directly controls a switch-like mating decision in yeast. Nature. 2010;465:101–105. doi: 10.1038/nature08946. [DOI] [PubMed] [Google Scholar]
- Dushek O, van der Merwe PA, Shahrezaei V. Ultrasensitivity in multisite phosphorylation of membrane-anchored proteins. Biophys J. 2011;100:1189–1197. doi: 10.1016/j.bpj.2011.01.060. [DOI] [PMC free article] [PubMed] [Google Scholar]
- Behnia R, Munro S. Organelle identity and the signposts for membrane traffic. Nature. 2005;438:597–604. doi: 10.1038/nature04397. [DOI] [PubMed] [Google Scholar]
- Matteis MAD, Godi A. PI-loting membrane traffic. Nat Cell Biol. 2004;6:487–492. doi: 10.1038/ncb0604-487. [DOI] [PubMed] [Google Scholar]
- Robinson FL, Dixon JL. Myotubularin phosphatases: policing 3-phosphoinositides. TRENDS Cell Biol. 2006;16:403–412. doi: 10.1016/j.tcb.2006.06.001. [DOI] [PubMed] [Google Scholar]
- Backer JM. The regulation and function of class III PI3Ks: novel roles for Vps34. Biochem J. 2008;410:1–17. doi: 10.1042/BJ20071427. [DOI] [PubMed] [Google Scholar]
- Cao C, Baker JM, Wandinger-Ness A, Stein MP. Myotubularin lipid phosphatase binds the hVPS15/ hVPS34 lipid kinase complex on endosomes. Traffic. 2007;8:1052–1067. doi: 10.1111/j.1600-0854.2007.00586.x. [DOI] [PubMed] [Google Scholar]
- Cao C, Baker JM, Laporte J, Bedrick EJ, Wandinger-Ness A. Sequential actions of myotubularin lipid phosphatases regulate endosomal PI(3) P and growth factor receptor trafficking. Mol Biol Cell. 2008;19:3334–3346. doi: 10.1091/mbc.E08-04-0367. [DOI] [PMC free article] [PubMed] [Google Scholar]
- Lecompte O, Poch O, Laporte J. PtdIns5P regulation through evolution: roles in membrane trafficking. Trends in Bioch Sciences. 2008;33:453–480. doi: 10.1016/j.tibs.2008.07.002. [DOI] [PubMed] [Google Scholar]
- Sbrissa D, Ikonomov O, Fu Z, Ijuin T, Gruenberg J, Takenawa T, Shisheva A. Core protein machinery for mammalian phosphatidylinositol 3,5-bisphosphate synthesis and turnover that regulates the progression of endosomal transport complex. J Biol Chem. 2008;282:23878–23891. doi: 10.1074/jbc.M611678200. [DOI] [PubMed] [Google Scholar]
- Botelho RJ, J A Efe DT. Assembly of a Fab1 phosphoinositide kinase signaling complex requires the Fig4 phosphoinositide phosphatase. Mol Biol Cell. 2008;19:4273–4286. doi: 10.1091/mbc.E08-04-0405. [DOI] [PMC free article] [PubMed] [Google Scholar]
- Ho CY, Alghamdi TA, Botelho RJ. Phosphatidylinositol-3,5-Bisphosphate: No longer the poor PIP2. Traffic. 2012;13:1–8. doi: 10.1111/j.1600-0854.2011.01246.x. [DOI] [PubMed] [Google Scholar]
- Mruk DD, Cheng CY. The myotubularin family of lipid phosphatases in disease and in spermatogenesis. Biochem J. 2011;433:253–262. doi: 10.1042/BJ20101267. [DOI] [PMC free article] [PubMed] [Google Scholar]
- Gomez-Uribe C, Verghese GC, Mirny LA. Operating regimes of signaling cycles: statics, dynamics, and noise filtering. PLoS Comput Biol. 2007;3:2487–2497. doi: 10.1371/journal.pcbi.0030246. [DOI] [PMC free article] [PubMed] [Google Scholar]
- Segel LA, Slemrod M. The quasi-steady-state assumption: a case study in perturbation. SIAM Review. 1989;31:446–477. doi: 10.1137/1031091. [DOI] [Google Scholar]
- Amit I, Citri A, Shay T, Lu Y, Katz M, Zhang F, Tarcic G, Siwak D, Lahad J, amd N Amariglio JJH, Vaisman N, Segal E, Rechavi G, Alon U, Mills GB, Domany E, Yarden Y. A module of negative feedback regulators defines growth factor signaling. Nat Genet. 2007;39:503–512. doi: 10.1038/ng1987. [DOI] [PubMed] [Google Scholar]
- Legewie S, Herzel H, Westerhoff HV, Bluthgen N. Recurrent design patterns in the feedback regulation of the mammalian signalling network. Mol Syst Biol. 2008;4:190. doi: 10.1038/msb.2008.29. [DOI] [PMC free article] [PubMed] [Google Scholar]
- Bluthgen N, Bruggeman FJ, Legewie S, Herzel H, Westerhoff HV, Kholodenko BN. Effects of sequestration on signal transduction cascades. FEBS J. 2006;273:895–906. doi: 10.1111/j.1742-4658.2006.05105.x. [DOI] [PubMed] [Google Scholar]
- Legewie S, Sers C, Herzel H. Kinetic mechanisms for overexpression insensitivity and oncogene cooperation. FEBS Lett. 2006;273:895–906. doi: 10.1016/j.febslet.2008.11.027. [DOI] [PubMed] [Google Scholar]
- Tzafiri AR, Edelman E. Quasi-steady-state at enzyme and substrate concentrations in the excess of the Michaelis-Menten constant. J Theor Biol. 2007;245:737–748. doi: 10.1016/j.jtbi.2006.12.005. [DOI] [PubMed] [Google Scholar]
- Tzafiri AR. Michaelis-Menten kinetics at high enzyme concentrations. Bull of Math Biol. 2003;65:1111–1129. doi: 10.1016/S0092-8240(03)00059-4. [DOI] [PubMed] [Google Scholar]
- A Ciliberto Capuani, Tyson JJ. Modeling networks of coupled enzymatic reactions using the total Quasi-Steady state approximation. PLOS Comput Biol. 2007;3:e45. doi: 10.1371/journal.pcbi.0030045. [DOI] [PMC free article] [PubMed] [Google Scholar]
- Yeung T, Grinstein S. Lipid signaling and the modulation of surface charge during phagocytosis. Immun Rev. 2007;219:17–36. doi: 10.1111/j.1600-065X.2007.00546.x. [DOI] [PubMed] [Google Scholar]
- Botelho RJ. Changing phosphoinositides “on the fly”: how trafficking vesicles avoid an identify crisis? BioEsseays. 2009;31:1127–1136. doi: 10.1002/bies.200900060. [DOI] [PubMed] [Google Scholar]


