

Abstract
Background. Diabetic foot infections are a leading cause of lower extremity amputations. Our study examines the microbiota of diabetic skin prior to ulcer development or infection.
Methods. In a case-control study, outpatient males were recruited at a veterans hospital. Subjects were swabbed at 4 cutaneous sites, 1 on the forearm and 3 on the foot. Quantitative polymerase chain reaction (qPCR) with primers and probes specific for bacteria, Staphylococcus species, Staphylococcus aureus, and fungi were performed on all samples. High-throughput 16S ribosomal RNA (rRNA) sequencing was performed on samples from the forearm and the plantar aspect of the foot.
Results. qPCR analysis of swab specimens from 30 diabetic subjects and 30 control subjects showed no differences in total numbers of bacteria or fungi at any sampled site. Increased log10 concentrations of Staphylococcus aureus, quantified by the number of nuc gene copies, were present in diabetic men on the plantar aspect of the foot. High-throughput 16S rRNA sequencing found that, on the foot, the microbiota in controls (n = 24) was dominated by Staphylococcus species, whereas the microbiota in diabetics (n = 23) was more diverse at the genus level. The forearm microbiota had similar diversity in diabetic and control groups.
Conclusions. The feet of diabetic men had decreased populations of Staphylococcus species, increased populations of S. aureus, and increased bacterial diversity, compared with the feet of controls. These ecologic changes may affect the risk for wound infections.
Keywords: microbiota, microbiome, diabetic foot, cutaneous, Staphylococcus, Staphylococcus aureus
Diabetic foot ulcers are an important clinical problem, leading to infection and loss of limb [1]. Diabetic foot ulcers occur in 15% of patients with diabetes mellitus, with a yearly incidence of 1%–2% [2]. Diabetic patients have higher rates of hospitalization for skin and soft-tissue infections than patients without diabetes [3]. Most studies based on culture have shown that the infections are polymicrobial, with Pseudomonas aeruginosa, Escherichia coli, and Staphylococcus species (especially Staphylococcus aureus) being the most prevalent isolates [4, 5]. Traditionally, the pathogenesis of these wounds has been attributed to factors such as neuropathy (a functional disturbance in peripheral nerves), repeated trauma, and peripheral vascular disease [6]. More recently, the roles of wound bioburden and functionally equivalent pathogroups in diabetic wound infections have been studied [7, 8]. Data on the composition of the cutaneous microbiota of diabetic patients is lacking. One of the few studies to address this question was performed in 1975, in the era prior to high-throughput 16S rRNA sequencing (HTS) technology [9]. No differences in culturable organisms between control and diabetic skin were found, but the study also did not examine the feet.
Staphylococcus species account for 70% of the normal skin microbiome on the plantar aspect of the foot [10, 11]; most are coagulase-negative Staphylococcus species that are of low virulence and may compete with the more virulent S. aureus [12]. In contrast, on intact skin on the contralateral (opposite) limb of patients with unilateral diabetic ulcers, only 7% of the microbiota was represented by Staphylococcus species [13], suggesting a loss of these protective organisms or their replacement by other species. HTS identification based on deep sequencing is currently being used to better characterize the human microbiome [14, 15]. We sought to use HTS along with quantitative polymerase chain reaction (qPCR) to better characterize the microbiota of the diabetic foot. The aim of this study was to determine whether there are differences in surface microbiota of the arm and foot between nondiabetic men and diabetic men without a history of diabetic foot ulcer.
METHODS
Study Participants
This was a single-center, case-control, observational study conducted from 2011 through 2012. Seventy men aged 18–70 years, with or without diabetes, were enrolled. All participants gave informed consent, and the institutional review boards of the VA NY Harbor Healthcare System (VANYHHS) and New York University approved the study. The subjects were recruited from the outpatient clinic of the VANYHHS (Manhattan campus). Exclusion criteria included any history of a diabetic foot ulcer, a body mass index (BMI; defined as the weight in kilograms divided by the height in square meters) of > 40, active dermatologic conditions at sampled anatomical sites, corticosteroid or antibiotic use within the prior month, known active infection at any site, and inability to take daily showers. Enrollment was stopped when we obtained 30 evaluable subjects in the diabetic group and 30 in the nondiabetic (ie, control) group. A survey was administered that included questions about medical history, recent antibiotic use, and bathing habits. A chart review based on the VA electronic medical record was performed to obtain clinical data and to quantify the subjects’ glycemic control.
Skin Sampling
To study the skin microbiota, samples were collected with cotton swabs (Fisher Scientific) soaked in 0.15 M NaCl and 0.1% Tween 20 (Fisher Scientific), as described elsewhere [16]. The following sites were swabbed: the right forearm (midway between the wrist and the antecubital fossa, the triangular area anterior to the elbow) and the dorsum (upper portion), plantar arch, and first interdigital space of the right foot. Each site was swabbed back and forth 30 times, and the procedure was repeated with a second swab.
Specimen Processing
Specimens were obtained under sterile conditions, placed in 1.5-mL Eppendorf tubes, and stored at −80°C. The samples were thawed for extraction, performed with the MoBio PowerLyzer Power Soil DNA Isolation Kit (MoBio Laboratories), according to the manufacturer's protocol. Samples were divided into aliquots for qPCR and 454 pyrosequencing.
Preparation of qPCR DNA Standards
qPCR standards specific to fungi were created using the transcribed spacer (ITS) sequence. Standards for Staphylococcus species and S. aureus were prepared from the 16S rRNA gene and the nuc gene, respectively, which were amplified from S. aureus USA 300 strain SA11–41 by specific primers for these 2 genes (Supplementary Table 1). PCR products were cloned into the pGEMT easy vector (Promega) and confirmed by sequencing. DNA from the purified recombinant plasmids was quantified by the Nanodrop-1000 spectrophotometer (Thermo Scientific) and then serially diluted in TE buffer (Qiagen) to obtain standards ranging from 3 × 101 to 3 × 10⁶ copies/µL. These reagents were used for qPCR in duplicate to create standard curves for calibration of assays.
Quantitative PCR Analysis
qPCR was used to analyze cutaneous samples from the 60 participants. Quantitation of total bacteria, total fungi, Staphylococcus species, and S. aureus was performed using the Roche LightCycler 480 II PCR system (Roche). Each assay was run in duplicate in wells, with a 20-µL final reaction volume. As described elsewhere [16], the TaqMan assay with fluorogenic probe was used for quantitation. Primers and probes are shown in Supplementary Table 1.
Pyrosequencing of 16S rRNA Gene Amplicons
DNA amplification and sequencing followed the protocol developed by the Human Microbiome Project [17]. The V1–V3 hypervariable region of 16S rRNA genes was amplified from the skin samples to be used for metagenomic analysis, using primers 27F and 534R (27F: 5′-AGAGTTTGATCCTGGCTCAG-3′; and 534R: 5′-ATTACCGCGGCTGCTGG-3′). The oligonucleotides containing the 16S primer sequences also contained a 454 adaptor sequence, as well as one of 94 tag sequences unique to each sample. A total of 2 µL of each metagenomic sample was amplified under the following conditions: initial denaturation at 95°C for 2 minutes, followed by 30 cycles of annealing at 56°C for 0.5 minutes, elongation at 72°C for 5 minutes, and final elongation at 72°C for 5 minutes. A negative control without a template was included. After excess primers and nucleotides were removed, the tagged amplicon products were pooled and sequenced on the 454 Titanium pyrosequencing platform at The Genomics Institute at Washington University School of Medicine at St. Louis.
Samples were deconvoluted by tag sequences. We allowed 1 mismatch in the barcode and up to 2 mismatches in the primer. Barcode, forward, and reverse primer sequences were removed from the reads. We further filtered out the reads of >200 bp. Chimera-slayer with default settings was used for chimera filtering before any further processing [18].
The obtained reads were further analyzed using QIIME scripts [19]. We first clustered the sequences into 97% similarity operational taxonomic units (OTUs), using the UCLUST program [20]; these were used as the finest level of taxonomic resolution. A representative sequence from each OTU cluster, automatically selected by UCLUST, was used to assign taxonomy to the cluster by using RDP Classifier [21] at 80% bootstrap confidence. These representative sequences were further aligned using PyNAST [22] with the Greengenes core-set alignment template, and the alignment was used to reconstruct an approximate phylogenetic tree, using FASTTREE [23], for the purpose of calculating UniFrac beta-diversity indices [24]. The OTU absolute abundance table and UniFrac beta-diversity matrices [25] were extracted from the pipeline for further analysis in the R statistical programming environment [26, 27]. The rarefactions for richness and Shannon diversity indices were calculated using scripts based on Community Ecology Package vegan. PCoA analysis was performed using the ade4 package in R. Intergroup and intragroup beta-diversity comparisons were performed using 1-way analysis of variance with the Tukey honestly significant difference multiple comparison correction procedure. The OTU relative abundances were calculated by dividing the absolute abundances by the total sequence count per sample analyzed. Differential relative abundance of specific taxa and OTU was calculated using the Kruskal–Wallis test, for simultaneous diabetes status and site comparison, and the Mann–Whitney U test, for within-site comparisons. The P values were adjusted for false discovery, using the Benjamini-Hochberg procedure [28].
Statistical Analysis
Wilcoxon and Student t tests were performed using SAS 9 to compare the mean similarities between the diabetic and nondiabetic groups. ANOVA test was performed to compare the mean similarities among sites. All the data analyses were done in SAS 9.2.
RESULTS
Subject Characteristics
From September 2011 to February 2012, a total of 70 subjects were enrolled in the study. Ten subjects were excluded (3 had an undocumented diagnosis of diabetes, 2 had diabetic foot ulcers observed on examination, and 1 each had tinea pedis, human immunodeficiency virus infection, severe neuropathy, history of burns on feet, and incomplete sampling). The demographic characteristics of the final group of 60 subjects are shown in Table 1. Baseline characteristics were generally similar for the 2 groups. As expected, the diabetic group had a significantly higher BMI and rate of statin use (P < .05) and higher levels of hemoglobin A1c and serum glucose.
Table 1.
Demographic and Clinical Characteristics of 30 Subjects Without Diabetes (Control) and 30 Subjects With Diabetes
| Characteristic | Control Group | Diabetes Group | P |
|---|---|---|---|
| Age, y | 59.2 ± 7.1 | 61.2 ± 5.1 | .23 |
| Race/ethnicity | |||
| White | 40 | 33 | |
| Hispanic | 23 | 20 | .73 |
| African American | 37 | 47 | |
| Height, cm | 177.2 ± 6.3 | 175.2 ± 5.9 | .44 |
| Weight, kg | 86.0 ± 16.8 | 92.9 ± 16.8 | .12 |
| BMI | 27.6 ± 4.8 | 30.3 ± 4.9 | .04 |
| Most recent serum glucose level, mg/dL | 95 ± 12 | 163 ± 98 | <.01 |
| Hemoglobin A1c level, % | 5.5 ± 0.3 | 7.9 ± 1.6 | <.01 |
| Active smoking | 17 | 23 | .75 |
| Antibiotic use in prior 12 mo | 30 | 30 | 1.00 |
| Known skin condition | 23 | 23 | 1.00 |
| History of malignancy | 20 | 13 | .73 |
| Vascular disease | 10 | 23 | .3 |
| Statin use | 30 | 77 | <.01 |
| NSAID use | 30 | 57 | .12 |
| Time since last shower, h | 12.2 ± 10.8 | 8.4 ± 10.2 | .17 |
| High temperature on sampling day, °C | 15.8 ± 5.2 | 18.2 ± 7.6 | .16 |
Data are no. of subjects or mean ± SD.
Abbreviations: BMI, body mass index (defined as the weight in kilograms divided by the height in square meters); NSAID, nonsteroidal antiinflammatory drug.
Detection of Total Bacteria and Total Fungi by qPCR
qPCR analyses were performed to enumerate the bacteria in the skin samples obtained from the 4 studied anatomical sites (the forearm, the dorsal aspect of the foot, the plantar aspect of the foot, and first interdigital space of the foot). Each sample was run in duplicate along with the standards described in the Methods section. In total, for the 240 samples studied, the number of bacterial 16S rRNA genes varied widely, with a mean of 9 × 10⁵ amplicons/µL and median of 5 × 10³ amplicons/µL. The total number bacterial amplicons per microliter was at least 1.35 log10 higher in the interdigital space than for all other studied sites (P < .0001; Figure 1A). Total bacterial counts also were higher on the plantar aspect of the foot, compared with the dorsal aspect of the foot and the forearm (P < .0001; Figure 1A). There were no significant differences in total bacterial levels between men with diabetes and controls (Figure 1A). The fungal ITS gene had a mean of 2 × 10³ amplicons/µL and a median of 9 × 101 amplicons/µL. Total fungal counts were higher in the interdigital space and on the forearms than on the plantar and dorsal aspects of the foot. There were no significant differences between fungal counts at any site between men with diabetes and controls (Figure 1D).
Figure 1.

Quantitation of bacteria from four sites. Bars: open, control subjects (n = 30); black, diabetic subjects (n = 30). Panels: log10 amplicons per site of, A, total bacteria, B, total Staphylococcus species, C, total Staphylococcus aureus per site and, D, total fungi per site. *P < .05.
qPCR Detection of Staphylococcus Species
qPCR analyses were performed for the genus Staphylococcus on samples obtained from the same 4 anatomical sites. The number of Staphylococcus copies present in the control group at the first interdigital space of the foot was greater in the control group, compared with the diabetes group (5.74 vs 5.18 log10 16S copies/µL; P = .04; Figure 1B). The samples from the 3 other sites showed no significant differences between the groups. Diabetic men had an increased number of S. aureus at the plantar aspect of the foot (0.73 vs 0.35 log10 nuc copies/µL; P = .04; Figure 1C) and at all sites combined (0.60 vs 0.34 log10 nuc copies/µL; P = .002), compared with controls.
S. aureus Carriage Rates
By qPCR, the rate of S. aureus carriage at each of the 4 sites did not significantly differ between the control and the diabetic groups (Figure 2); the S. aureus carriage rate at any site on the foot was 17% in controls and 33% in the diabetic group (P = .23). However, at the plantar aspect of the foot, more men in the diabetic group than the control group had S. aureus detected at levels >0.01% of the total bacterial population (Table 2). The combined S. aureus carriage rate on the forearm, including both controls and diabetic subjects, was higher than the carriage rate at the interdigital space (28% vs 8%; P = .008). The rates of carriage on the dorsal and plantar aspects of the foot were 17% and 20%, respectively.
Figure 2.
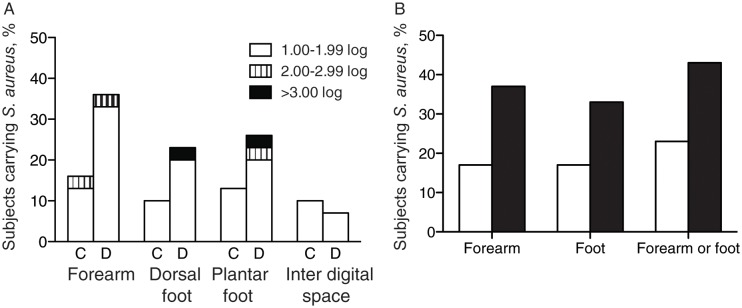
Rate of Staphylococcus aureus carriage. Panel A: Percent of subjects carrying Staphylococcus aureus on skin at four sites, stratified by log10amplicon copy number. Subjects are controls (C, n = 30) or diabetics (D, n = 30). Panel B: Percent of 60 subjects carrying S. aureus by part of body (Open, control; Black, diabetes).
Table 2.
Representation of Staphylococcus aureus in Relation to Other Bacterial Taxa, by Body Site
| Total Bacterial Population Consisting of S. aureus, % | Subjects, %, by Anatomical Site and Study Group |
|||||||
|---|---|---|---|---|---|---|---|---|
| Forearm |
Dorsal Aspect of Foot |
Plantar Aspect of Foot |
Interdigital Space of Foot |
|||||
| Control | Diabetes | Control | Diabetes | Control | Diabetes | Control | Diabetes | |
| >10.0 | 3.3 | 0.0 | 3.3 | 3.3 | 0.0 | 0.0 | 0.0 | 0.0 |
| >1.0 | 30.0 | 16.7 | 10.0 | 3.3 | 3.3 | 3.3 | 0.0 | 0.0 |
| >0.1 | 63.3 | 70.0 | 66.7 | 73.3 | 23.3 | 43.3 | 0.0 | 10.0 |
| >0.01 | 96.7 | 100.0 | 93.3 | 96.7 | 63.3 | 93.3a | 26.7 | 26.7 |
Data were determined by comparing quantitative polymerase chain reaction results for nuc with those for the universal bacterial 16S ribosomal RNA.
a P = .01, by the χ2 test, compared with controls.
Composition of Cutaneous Bacterial Communities in Diabetes
We analyzed 1 sample from the forearm and 1 from the plantar aspect of the foot for 47 subjects (24 controls and 23 men with diabetes; 94 total samples). The minimal sequence depth was 1775, and the median depth was 5274. The plantar aspect of the feet of diabetic subjects had greater taxonomic richness and Shannon diversity at all taxonomic levels, compared with the plantar aspect of the feet of controls (Figure 3). Forearm samples from both controls and diabetic men had similar alpha diversity to each other and to the diabetic foot samples (Figure 3). The bacterial composition, as determined by HTS and stratified by anatomical site and study group, is shown at the phylum and genus level in Figure 4A and 4B. We examined the taxa that composed ≥1% of the total microbiota of the foot (Figure 4C). The relative abundance of Staphylococcus species in the control group was similar to prior reports, at approximately 70% [9, 10].
Figure 3.

Alpha diversity rarefaction plots by site and diabetes status. From each of 94 specimens, 454-pyrosequencing results are normalized to 2000 reads/specimen. Panels: A, Taxonomical richness at phylum, Panel B, genus and, Panel C, 97% similarity OTU levels; and Shannon evenness index at, Panel D, phylum, Panel E, genus and Panel F, 97% similarity OTU levels are shown as rarefaction curves with colors representing site and diabetes status. Color codes are the same in each panel. Abbreviation: OTU, operational taxonomic unit.
Figure 4.

Composition of microbial communities. Data obtained from 624, 540 reads from 92 samples from 454 pyrosequencing (mean depth 6715 ± 4199), and shown by diabetes status and site. Panel A: phylum level, Panel B: genus level white area indicates other genera, Panel C: mean relative abundance of 10 most prevalent genera in control and diabetes foot samples.
Focusing only on highly abundant taxa (defined as a those with mean relative abundance of >1% across all samples), we analyzed bacterial community compositions in terms of differential relative abundance at anatomical sites (arm and foot) and according to diabetes status (Supplementary Table 2). As expected, most of the differences occurred between arm and foot specimens. Among arm samples, no significant differences in relative abundances were found between diabetic and nondiabetic subjects. Among foot specimens, the relative abundance of Firmicutes was greater in controls, compared with diabetic subjects (78.8% vs 33.0%; P < .01 after adjustment for false discovery rate [FDR]), while Actinobacteria had a greater relative abundance in foot specimens from diabetic men, compared with foot specimens from controls (31.1% vs 16.2%; P < .03 after adjustment for FDR). At the genus level, Staphylococcus had the greatest relative abundance in foot specimens from both controls and diabetic patients (76.0% and 30.5%); however, because of the intersubject variability, the difference was not statistically significant (P = .08 after adjustment for FDR). On the other hand, Corynebacterium abundance was greater in the feet of diabetic subjects (18.2%) than in the feet of controls (5.1%; P < .03 after adjustment for FDR).
By using weighted UniFrac analysis, the first plane of the principal coordinate analysis (PCoA) shows that arm specimens are more tightly clustered than the foot specimens (Figure 5A) and that the diabetic and control arm ellipses virtually overlap. These data suggest that there were no significant differences in the composition of the microbiota at the forearm (Figure 5A). Foot communities split according to diabetes status (Figure 5B and 5D; P = .015). There was increased intragroup beta-diversity in foot samples of diabetic men (Figure 5E). In arm specimens, the trend was reversed (Figure 5F); the arms of diabetic men had lower intragroup beta-diversity than the controls. The intergroup beta-diversity in the arm samples had intermediate values, suggesting that diabetic samples form a subcluster with the controls, which was evident from the PCoA plot (Figure 5C). Such findings are also illustrated in Supplementary Figure 1.
Figure 5.

Principal Coordinate Analysis (PCoA) of weighted Unifrac beta-diversity. Diabetic and control specimens from Panel A: Arm specimens (maroon – diabetes, green – control), Panel B: Foot specimens (red – diabetes, black – control), Panel C: both sites are represented on the first principal plane of corresponding PCoA. The elipses show the amount of variation along major axes (dashed lines) within each group. Percentage of variability represented by the axes are shown below each panel. Panel D: Foot specimens differ along the first principal axis according to t-test (P = .015). Panels E and F: Weighted Unifrac beta-diversity analysis of (E) feet and (F) arm samples separately. There is increased intragroup diversity in diabetic foot specimens compared with controls (P < .0002) matched by a similar intergroup increase (P < .00002). Intragroup diversity of diabetic arms is less than that of controls, while intergroup diversity takes an intermediate value (all differences significant at P < .005).
DISCUSSION
The goals of our study were to compare the bacterial community structure of the foot in diabetic and control (nondiabetic) subjects and to quantitate clinically relevant species. We found that bacterial populations at the plantar aspect of the feet of diabetic men were more diverse and had different composition, compared with values for nondiabetic men. In particular, the quantity of Staphylococcus organisms was reduced on the diabetic plantar aspect of the foot, whereas the more virulent S. aureus was present in greater quantities; these changes may be precursors to diabetic foot infection and ulcer development. The quantity of Staphylococcus species at the interdigital space of the feet of diabetic men was significantly lower than that for controls, by qPCR. This finding, along with pyrosequencing data for the plantar aspect, which showed a trend toward a higher relative abundance of Staphylococcus species in control subjects (76.0% vs 30.5%; P = .08), suggest that the diabetic foot has a lower population of Staphylococcus species present. Since both groups had low total levels of S. aureus, most Staphylococcus species present were coagulase negative and less virulent.
To our knowledge, this is the first study to use qPCR and metagenomics to study the bacterial populations of intact skin in diabetic subjects prior to clinical foot infections. The increased diversity and loss of possibly protective coagulase-negative staphylococcal species [29–31] and the enrichment of S. aureus are findings that correlate with the elevated risk of skin and soft-tissue infections that occur in diabetic patients [1]. This risk is also supported by the trend among diabetic subjects toward higher S. aureus carriage rates on the foot (Figure 2). As such, the differing populations of the plantar aspect of the diabetic foot, vis-a-vis the controls, may reflect a dysbiosis [32] that enhances disease risk. To further understand the role of the relevant microbial populations in disease, longitudinal study of high-risk patients is needed.
The difference in bacterial diversity on the skin of the foot between diabetic subjects and controls could be partially explained by the ambient outdoor temperature on the day of sampling, which was lower when control specimens were obtained by HTS (17 ± 5°C vs 21 ± 6°C; P = .01). No other factors in our study, including glycosylated hemoglobin levels, correlated with bacterial diversity. However, there were no differences in the arms between the diabetic group and controls, suggesting that the ambient temperature did not play a major role in the differences observed. Since diabetes status also correlated with diversity, we speculate that diabetes mellitus alters the microenvironment of the skin. Sweat glands, sebaceous glands, and hair follicles all contribute to specific microenvironments and each have their own microbiota [33]. Diabetic patients are known to have altered sweat and thermoregulatory responses, even prior to the development of clinical neuropathy [34, 35]. Similarly, the glucose concentration of sweat is elevated during diabetes [36]. These factors together may explain why bacterial diversity in our study correlated with ambient temperature and diabetes status. Altered thermoregulation of the skin on the foot also could help explain why the microbiota is more diverse. Sweat gland output of the forearms of diabetic patients and controls was similar, while in the lower limb, patients with diabetes had less sweat output [37]. The data indicating that forearm diversity is similar in the diabetic subjects and controls but increased in the plantar aspect of the feet of diabetic individuals are consistent with the differential propensity for skin ulceration at the 2 sites.
Sweat glands provide a role in innate immunity in their secretion of antimicrobial peptides, among other factors [38]. Antimicrobial peptides, such as dermcidin [39], secreted from eccrine sweat glands, have activity against S. aureus and other cutaneous microbes. Since these glands are less prevalent in the lower extremities of diabetic patients, this mechanism may contribute to the differences in the microbiota observed in our study. Defective sweat glands and low levels of dermcidin may contribute to atopic dermatitis [38, 40] and may be part of the pathogenesis of diabetic skin infections. Further investigation of the pathogenesis of the cutaneous microbial composition may provide a link between the functions of antimicrobial peptides and the resident microbiota in diseases such as diabetes.
Microbial diversity on the skin is influenced by many factors [41], including sex [42]. A few of the strengths of our study were that we analyzed a cohort of single-sex (ie, male) veterans, who were well matched, that all samples were taken by the same researcher who followed a consistent protocol, and that our control population was similar to previously reported controls in the literature in terms of microbial composition and quantitation [10, 11, 43]. The sampling occurred over a number of months, and there was a trend toward more cases being recruited during warmer months of the study. This limitation in the study may curtail interpretation of the correlations that we observe. However, the overall diversity at the forearm of the diabetic subjects and controls remained similar, which indicates that the differences may indeed reflect the effects of diabetes on pedal microbial populations, which may contribute to the pathogenesis of wound infections.
Supplementary Data
Supplementary materials are available at The Journal of Infectious Diseases online (http://jid.oxfordjournals.org/). Supplementary materials consist of data provided by the author that are published to benefit the reader. The posted materials are not copyedited. The contents of all supplementary data are the sole responsibility of the authors. Questions or messages regarding errors should be addressed to the author.
Notes
Acknowledgments. H. R. and M. J. B conceived and designed the study and wrote the manuscript. M. J. B. is the guarantor of this work and, as such, had full access to all of the data in the study and takes responsibility for the integrity of the data and the accuracy of the data analysis. Z. G., G. W., and E. S. contributed to the experiment. H. L provided support in statistical analysis. A. V. A. and Y. Z. provided statistical analysis of the metagenomic data. G. P. P. contributed to the design of the study.
Financial support. This work was supported by the Human Microbiome Program of the National Institutes of Health (grants UH2 AR057506-01S1 and U54 HG004968), the Medical Research Service of the Department of Veterans Affairs, and the Diane Belfer Program in Human Microbial Ecology.
Potential conflict of interest. All authors: No reported conflicts.
All authors have submitted the ICMJE Form for Disclosure of Potential Conflicts of Interest. Conflicts that the editors consider relevant to the content of the manuscript have been disclosed.
References
- 1.Lipsky BA, Berendt AR, Cornia PB, et al. 2012 Infectious Diseases Society of America clinical practice guideline for the diagnosis and treatment of diabetic foot infections. Clin Infect Dis. 2012;54:e132–73. doi: 10.1093/cid/cis346. [DOI] [PubMed] [Google Scholar]
- 2.Ramsey SD, Newton K, Blough D, et al. Incidence, outcomes, and cost of foot ulcers in patients with diabetes. Diabetes Care. 1999;22:382–7. doi: 10.2337/diacare.22.3.382. [DOI] [PubMed] [Google Scholar]
- 3.Benfield T, Jensen JS, Nordestgaard BG. Influence of diabetes and hyperglycaemia on infectious disease hospitalisation and outcome. Diabetologia. 2007;50:549–54. doi: 10.1007/s00125-006-0570-3. [DOI] [PubMed] [Google Scholar]
- 4.Ge Y, MacDonald D, Hait H, Lipsky B, Zasloff M, Holroyd K. Microbiological profile of infected diabetic foot ulcers. Diabet Med. 2002;19:1032–4. doi: 10.1046/j.1464-5491.2002.00696_1.x. [DOI] [PubMed] [Google Scholar]
- 5.Ramakant P, Verma AK, Misra R, et al. Changing microbiological profile of pathogenic bacteria in diabetic foot infections: time for a rethink on which empirical therapy to choose? Diabetologia. 2011;54:58–64. doi: 10.1007/s00125-010-1893-7. [DOI] [PubMed] [Google Scholar]
- 6.Apelqvist J, Bakker K, van Houtum WH, Schaper NC International Working Group on the Diabetic Foot (IWGDF) Editorial Board. Practical guidelines on the management and prevention of the diabetic foot: based upon the International Consensus on the Diabetic Foot (2007) Prepared by the International Working Group on the Diabetic Foot. Diabetes Metab Res Rev. 2008;24:S181–7. doi: 10.1002/dmrr.848. [DOI] [PubMed] [Google Scholar]
- 7.Gardner SE, Frantz RA. Wound bioburden and infection-related complications in diabetic foot ulcers. Biol Res Nurs. 2008;10:44–53. doi: 10.1177/1099800408319056. [DOI] [PMC free article] [PubMed] [Google Scholar]
- 8.Dowd SE, Wolcott RD, Sun Y, McKeehan T, Smith E, Rhoads D. Polymicrobial nature of chronic diabetic foot ulcer biofilm infections determined using bacterial tag encoded FLX amplicon pyrosequencing (bTEFAP) PLoS One. 2008;3:e3326. doi: 10.1371/journal.pone.0003326. [DOI] [PMC free article] [PubMed] [Google Scholar]
- 9.Singh G, Rao DJ. Bacterial flora and the diabetic skin. Indian J Med Res. 1975;63:529–32. [PubMed] [Google Scholar]
- 10.Kong HH. Skin microbiome: genomics-based insights into the diversity and role of skin microbes. Trends Mol Med. 2011;17:320–8. doi: 10.1016/j.molmed.2011.01.013. [DOI] [PMC free article] [PubMed] [Google Scholar]
- 11.Grice EA, Segre JA. The skin microbiome. Nat Rev Microbiol. 2011;9:244–53. doi: 10.1038/nrmicro2537. [DOI] [PMC free article] [PubMed] [Google Scholar]
- 12.Iwase T, Uehara Y, Shinji H, et al. Staphylococcus epidermidis Esp inhibits Staphylococcus aureus biofilm formation and nasal colonization. Nature. 2010;465:346–9. doi: 10.1038/nature09074. [DOI] [PubMed] [Google Scholar]
- 13.Gontcharova V, Youn E, Sun Y, Wolcott RD, Dowd SE. A comparison of bacterial composition in diabetic ulcers and contralateral intact skin. Open Microbiol J. 2010;4:8–19. doi: 10.2174/1874285801004010008. [DOI] [PMC free article] [PubMed] [Google Scholar]
- 14.Human Microbiome Consortium. A framework for human microbiome research. Nature. 2012;486:215–21. doi: 10.1038/nature11209. [DOI] [PMC free article] [PubMed] [Google Scholar]
- 15.Human Microbiome Project Consortium. Structure, function and diversity of the healthy human microbiome. Nature. 2012;486:207–14. doi: 10.1038/nature11234. [DOI] [PMC free article] [PubMed] [Google Scholar]
- 16.Gao Z, Perez-Perez GI, Chen Y, Blaser MJ. Quantitation of major human cutaneous bacterial and fungal populations. J Clin Microbiol. 2010;48:3575–81. doi: 10.1128/JCM.00597-10. [DOI] [PMC free article] [PubMed] [Google Scholar]
- 17.Microbiome Project Data Generation Working Group. Generalized draft form of HMP Data Generation Working Group 16S 454 default protocol. Version 4.2–Pilot Study P.1 (15) Available at: http://www.hmpdacc.org/doc/HMP_MDG_454_16S_Protocol.pdf. Accessed 22 October 2012. [Google Scholar]
- 18.Haas BJ, Gevers D, Earl AM, et al. Human Microbiome Consortium. Chimeric 16S rRNA sequence formation and detection in Sanger and 454-pyrosequenced PCR amplicons. Genome Res. 2011;21:494–504. doi: 10.1101/gr.112730.110. [DOI] [PMC free article] [PubMed] [Google Scholar]
- 19.Caporaso JG, Kuczynski J, Stombaugh J, et al. QIIME allows analysis of high-throughput community sequencing data. Nat Methods. 2010;7:335–6. doi: 10.1038/nmeth.f.303. [DOI] [PMC free article] [PubMed] [Google Scholar]
- 20.Edgar RC. Search and clustering orders of magnitude faster than BLAST. Bioinformatics. 2010;26:2460–1. doi: 10.1093/bioinformatics/btq461. [DOI] [PubMed] [Google Scholar]
- 21.Wang Q, Garrity GM, Tiedje JM, Cole JR. Naive Bayesian classifier for rapid assignment of rRNA sequences into the new bacterial taxonomy. Appl Environ Microbiol. 2007;73:5261–7. doi: 10.1128/AEM.00062-07. [DOI] [PMC free article] [PubMed] [Google Scholar]
- 22.Caporaso JG, Bittinger K, Bushman FD, DeSantis TZ, Andersen GL, Knight R. PyNAST: a flexible tool for aligning sequences to a template alignment. Bioinformatics. 2010;26:266–7. doi: 10.1093/bioinformatics/btp636. [DOI] [PMC free article] [PubMed] [Google Scholar]
- 23.Price MN, Dehal PS, Arkin AP. FastTree 2–approximately maximum-likelihood trees for large alignments. PLoS One. 2010;5:e9490. doi: 10.1371/journal.pone.0009490. [DOI] [PMC free article] [PubMed] [Google Scholar]
- 24.Lozupone C, Knight R. UniFrac: a new phylogenetic method for comparing microbial communities. Appl Environ Microbiol. 2005;71:8228–35. doi: 10.1128/AEM.71.12.8228-8235.2005. [DOI] [PMC free article] [PubMed] [Google Scholar]
- 25.Lozupone C, Lladser ME, Knights D, Stombaugh J, Knight R. UniFrac: an effective distance metric for microbial community comparison. ISME J. 2010;5:169–72. doi: 10.1038/ismej.2010.133. [DOI] [PMC free article] [PubMed] [Google Scholar]
- 26.Gentleman RC, Carey VJ, Bates DM, et al. Bioconductor: open software development for computational biology and bioinformatics. Genome Biol. 2004;5:R80. doi: 10.1186/gb-2004-5-10-r80. [DOI] [PMC free article] [PubMed] [Google Scholar]
- 27.Team RDC. R: a language and environment for statistical computing. Vienna, Austria: R Foundation for Statistical Computing; 2009. [Google Scholar]
- 28.Benjamini Y, Hochberg Y. Controlling the False Discovery Rate - a Practical and Powerful Approach to Multiple Testing. J Roy Stat Soc B Met. 1995;57:289–300. [Google Scholar]
- 29.Bibel DJ, Aly R, Bayles C, Strauss WG, Shinefield HR, Maibach HI. Competitive adherence as a mechanism of bacterial interference. Can J Microbiol. 1983;29:700–3. doi: 10.1139/m83-114. [DOI] [PubMed] [Google Scholar]
- 30.Lai Y, Di Nardo A, Nakatsuji T, et al. Commensal bacteria regulate Toll-like receptor 3-dependent inflammation after skin injury. Nat Med. 2009;15:1377–82. doi: 10.1038/nm.2062. [DOI] [PMC free article] [PubMed] [Google Scholar]
- 31.Cogen AL, Yamasaki K, Sanchez KM, et al. Selective antimicrobial action is provided by phenol-soluble modulins derived from Staphylococcus epidermidis, a normal resident of the skin. J Invest Dermatol. 2010;130:192–200. doi: 10.1038/jid.2009.243. [DOI] [PMC free article] [PubMed] [Google Scholar]
- 32.Littman DR, Pamer EG. Role of the commensal microbiota in normal and pathogenic host immune responses. Cell Host Microbe. 2011;10:311–23. doi: 10.1016/j.chom.2011.10.004. [DOI] [PMC free article] [PubMed] [Google Scholar]
- 33.Kong HH. Skin microbiome: genomics-based insights into the diversity and role of skin microbes. Trends Mol Med. 2011;17:320–8. doi: 10.1016/j.molmed.2011.01.013. [DOI] [PMC free article] [PubMed] [Google Scholar]
- 34.Markendeya N, Martina V, Mathew A, Srinivas CR. Sweat function in the diabetic foot. Indian J Dermatol Venereol Leprol. 2004;70:18–19. [PubMed] [Google Scholar]
- 35.Rutkove SB, Veves A, Mitsa T, et al. Impaired distal thermoregulation in diabetes and diabetic polyneuropathy. Diabetes Care. 2009;32:671–6. doi: 10.2337/dc08-1844. [DOI] [PMC free article] [PubMed] [Google Scholar]
- 36.Moyer J, Wilson D, Finkelshtein I, Wong B, Potts R. Correlation between sweat glucose and blood glucose in subjects with diabetes. Diabetes Technol Ther. 2012;14:398–402. doi: 10.1089/dia.2011.0262. [DOI] [PubMed] [Google Scholar]
- 37.Provitera V, Nolano M, Caporaso G, Stancanelli A, Santoro L, Kennedy WR. Evaluation of sudomotor function in diabetes using the dynamic sweat test. Neurology. 2010;74:50–6. doi: 10.1212/WNL.0b013e3181c7da4b. [DOI] [PubMed] [Google Scholar]
- 38.Schittek B, Paulmann M, Senyürek I, Steffen H. The role of antimicrobial peptides in human skin and in skin infectious diseases. Infect Disord Drug Targets. 2008;8:135–43. doi: 10.2174/1871526510808030135. [DOI] [PubMed] [Google Scholar]
- 39.Schittek B, Hipfel R, Sauer B, et al. Dermcidin: a novel human antibiotic peptide secreted by sweat glands. Nat Immunol. 2001;2:1133–7. doi: 10.1038/ni732. [DOI] [PubMed] [Google Scholar]
- 40.Shiohara T, Doi T, Hayakawa J. Defective sweating responses in atopic dermatitis. Curr Probl Dermatol. 2011;41:68–79. doi: 10.1159/000323297. [DOI] [PubMed] [Google Scholar]
- 41.Costello EK, Lauber CL, Hamady M, Fierer N, Gordon JI, Knight R. Bacterial community variation in human body habitats across space and time. Science. 2009;326:1694–7. doi: 10.1126/science.1177486. [DOI] [PMC free article] [PubMed] [Google Scholar]
- 42.Fierer N, Hamady M, Lauber CL, Knight R. The influence of sex, handedness, and washing on the diversity of hand surface bacteria. Proc Natl Acad Sci U S A. 2008;105:17994–9. doi: 10.1073/pnas.0807920105. [DOI] [PMC free article] [PubMed] [Google Scholar]
- 43.Gao Z, Tseng CH, Pei Z, Blaser MJ. Molecular analysis of human forearm superficial skin bacterial biota. Proc Natl Acad Sci U S A. 2007;104:2927–32. doi: 10.1073/pnas.0607077104. [DOI] [PMC free article] [PubMed] [Google Scholar]
- 44.Paulino LC, Tseng CH, Strober BE, Blaser MJ. Molecular analysis of fungal microbiota in samples from healthy human skin and psoriatic lesions. J Clin Microbiol. 2006;44:2933–41. doi: 10.1128/JCM.00785-06. [DOI] [PMC free article] [PubMed] [Google Scholar]
Associated Data
This section collects any data citations, data availability statements, or supplementary materials included in this article.