Abstract
The interaction of immunoglobulin E (IgE) antibodies with the high-affinity receptor, FcεRI, plays a central role in initiating most allergic reactions. The IgE–receptor interaction has been targeted for treatment of allergic diseases, and many high-affinity macromolecular inhibitors have been identified. Small molecule inhibitors would offer significant advantages over current anti-IgE treatment, but no candidate compounds have been identified and fully validated. Here, we report the development of a time-resolved fluorescence resonance energy transfer (TR–FRET) assay for monitoring the IgE–receptor interaction. The TR–FRET assay measures an increase in fluorescence intensity as a donor lanthanide fluorophore is recruited into complexes of site-specific Alexa Fluor 488-labeled IgE-Fc and His-tagged FcεRIα proteins. The assay can readily monitor classic competitive inhibitors that bind either IgE-Fc or FcεRIα in equilibrium competition binding experiments. Furthermore, the TR–FRET assay can also be used to follow the kinetics of IgE-Fc–FcεRIα dissociation and identify inhibitory ligands that accelerate the dissociation of preformed complexes, as demonstrated for an engineered DARPin (designed ankyrin repeat protein) inhibitor. The TR–FRET assay is suitable for high-throughput screening (HTS), as shown by performing a pilot screen of the National Institutes of Health (NIH) Clinical Collection Library in a 384-well plate format.
Keywords: IgE, Allergy, Asthma, High-affinity receptor, Inhibitors, High-throughput screening, TR–FRET
The prevalence of allergic diseases has been increasing steadily in industrialized countries during past decades [1], including allergic rhinitis, atopic dermatitis, allergic asthma, and food allergies. Most allergic diseases are caused by immunoglobulin E (IgE)1-mediated activation of mast cells and basophils [2,3], although IgE antibodies serve a primary function in conferring immunity to infection by parasites and other organisms. Mast cells and basophils express FcεRI, the high-affinity receptor for IgE, on the cell surface, and in cases of individuals with allergic diseases the interaction of IgE with FcεRI sensitizes these cells to release mediators in response to normally benign environmental stimuli. The IgE antibody Fc region consists of three domains, Cε2–Cε3–Cε4, containing an additional immunoglobulin domain (Cε2) as compared with immunoglobulin G (IgG) antibodies. FcεRI is expressed on cell surfaces as a heterotrimeric αγ2 or a heterotetrameric αβγ2 receptor [3,4], with the ecto-domain of the α-chain (FcεRIα) consisting of two Ig domains that bind the IgE-Fc. IgE binds to FcεRI through direct interactions between the Cε3 domains of the heavy chains (Fc) and the extracellular domains of FcεRIα [5-8]. Due to its high binding affinity to FcεRIα (~1 nM), IgE-Fc or IgE-Fc3–4 (a homodimer of ε-chains consisting of the Cε3 and Cε4 domains) forms stable complexes with FcεRIα even in the absence of allergen binding [9,10]. These preformed IgE–FcεRI complexes exhibit long half-lives and prime mast cells and basophils to respond to antigen even prior to antigen exposure. Although the IgE–FcεRI interaction has been validated as a therapeutic target through Food and Drug Administration (FDA)-approved anti-IgE therapy, obstacles to treating a broader patient population remain, as does the challenge of interrupting an acute allergic response triggered by preformed IgE–FcεRI complexes on cells.
Numerous strategies have been pursued to identify molecules that inhibit the IgE–FcεRI interaction, and anti-IgE antibodies such as omalizumab (Xolair) [11,12], anti-FcεRI antibodies [13,14], synthetic oligonucleotides, and DARPins (designed ankyrin repeat proteins) [15-17] have been identified as high-affinity inhibitors. However, no small molecule inhibitors have been identified for the IgE–FcεRI interaction to date. The task of discovering small molecules that disrupt protein–protein interactions in general, and IgE–receptor interactions more specifically, is an enormous challenge [18]. In the case of the IgE–receptor interaction, the high affinity of the binding and extreme stability of the complexes make this task more difficult. However, conformational flexibility of the IgE-Fc Cε3 domains has been observed in IgE crystal structures [7,8,19] and we previously identified a small pocket at the hinge region of Cε3–Cε4 domains that might influence IgE-Fc Cε3 domain conformations and receptor binding [19]. In addition, we recently demonstrated that an engineered protein inhibitor, DARPin E2_79, blocks IgE binding and accelerates the dissociation rate of IgE–FcεRI complexes, most likely by competing for a subset of IgE–FcεRI attachment sites that become exposed during partial dissociation of the complexes (manuscript in press).
Together, these observations suggest the possibility that small molecules that modulate the IgE-Fc conformation, or that compete directly for a subset of IgE–FcεRI interactions, could block receptor binding and potentially even affect the dissociation rates and disrupt preformed complexes. To explore this possibility, we developed a fluorescence-quenching (FQ) assay to monitor IgE binding to its receptor (manuscript in press). In the FQ assay, the binding of FcεRIα to a fluorophore-labeled IgE-Fc, Alexa Fluor 488-Fc, leads to a decrease in fluorescence signal intensity. The FQ assay allowed quantitative experiments of IgE–FcεRI binding and inhibition, but it exhibited a signal/background (S/B) ratio that was too low for large-scale high-throughput screening (HTS). Therefore, we sought to develop a second assay with a significantly improved S/B ratio that would be better suited for use in a primary screen of large compound libraries.
Here, we describe a time-resolved fluorescence resonance energy transfer (TR–FRET) assay for measuring IgE-Fc binding to its high-affinity receptor, FcεRI. The assay consists of a three-component mix-and-read format, suitable for automated screening applications. The three required components are commercially available terbium-labeled anti-His tag antibody, fluorophore-labeled IgE-Fc, and an N-terminally His6-tagged FcεRIα protein. Saturation binding and competition experiments indicate that this assay has a good S/B ratio and exhibits full inhibition. Four inhibitors were tested in competition assays: FcεRIα lacking the His tag, an anti-FcεRI antibody (mAb15.1), the anti-IgE antibody (omalizumab/Xolair), and anti-IgE DARPin E2_79. The measurement of dissociation of IgE-Fc–FcεRIα complexes in the presence of IgE inhibitors allows us to identify IgE inhibitors that alter the dissociation rate of the complexes. To validate that this TR–FRET assay provides a reliable primary assay for HTS, we reduced the assay volume to 10 μl in a 384-well plate format, conducted a pilot screen using the National Institutes of Health (NIH) Clinical Collection Library, and further evaluated potential hits with full dose–response curve measurements. The results confirm that the TR–FRET assay for IgE-Fc–FcεRI binding is suitable for HTS to identify small molecule inhibitors of the interaction.
Materials and methods
Materials
Cysteine-reactive fluorescent dye (Alexa Fluor 488) was purchased from Invitrogen/Molecular Probes. Omalizumab (Xolair) was purchased from Novartis. LanthaScreen Elite terbium-labeled anti-His antibody (Tb-Ab) was purchased from Invitrogen. Five compounds from the pilot screen of the NIH Clinical Collection Library were purchased for follow-up dose–response assays: rofecoxib (Vioxx), epigallocatechin gallate, and oxiconazole nitrate (all purchased from Santa Cruz Biotechnology) and loratidine and dihydrexidine hydrochloride (both purchased from Tocris Bioscience).
Expression and purification of proteins
The expression and purification in insect cells of a double mutant of the IgE-Fc3–4 protein (A328/C367) required for fluorescent dye labeling was carried out as described previously (manuscript in press). Expression and purification of the DARPin E2_79 in Escherichia coli has been reported elsewhere [15]. Expression and purification of the soluble FcεRI α-chain ectodomain lacking a His6 tag has been reported elsewhere [8,20,21]. We generated an additional construct for the FcεRIα by subcloning a polymerase chain reaction (PCR) product into the pBACGus-3 expression vector using the SmaI and BamHI restriction enzyme sites. After enterokinase cleavage, the mature His6 FcεRIα protein contains N-terminal residues from the vector corresponding to Ser-Pro-Gly. Recombinant baculovirus was generated using the BaculoGold DNA, and virus stocks were amplified twice by infection of Sf9 cells. Protein was purified from clarified insect cell supernatants using nickel-nitrilotriacetic acid (Ni-NTA) affinity resin (Qiagen), and the purity was verified by SDS–PAGE. To remove the His tag at the C terminus of C367 IgE-Fc3–4 and the His tag on E2_79, the purified proteins were concentrated to 1 to 2 mg/ml and treated with 5 to 10 U of recombinant enterokinase (Invitrogen) per 1 mg protein at room temperature overnight. The enzymes were removed from the solution by EKapture Agarose (Novagen). The preparation of Alexa Fluor-labeled C367 IgE-Fc (AF488-Fc) was carried out as described previously (manuscript in press).
TR–FRET measurements
Except for the pilot screen described below, all TR–FRET experiments were performed in a final volume of 100 μl in black 96-well Costar fluorescence plates (Corning) using a Synergy 4 Fluorometer (BioTek) in assay buffer (50 mM Tris [pH 8.0], 50 mM NaCl, 0.1% [v/v] Tween 20, and 100 nM bovine serum albumin [BSA]) at room temperature. Fluorescence signals were measured at 490 and 520 nm with a 100-μs delay after excitation at 340 nm. To study the effect of dimethyl sulfoxide (DMSO) on the TR–FRET signal, TR–FRET was measured in the presence of increasing concentrations of DMSO (0–10%) with 15 nM FcεRIα, 5 nM Tb-Ab, and 25 nM AF488-Fc in assay buffer and carried out in duplicate.
FcεRIα saturation binding experiments
Increasing concentrations of FcεRIα (0–200 nM) and 5 nM Tb-Ab were incubated at room temperature for at least 10 min, and the complexes were mixed with AF488-Fc (0, 25, or 50 nM) for 10 min before measurement. All measurements were performed in duplicate.
AF488-Fc saturation binding experiments
FcεRIα (0, 10, or 15 nM) and 5 nM Tb-Ab were incubated at room temperature for at least 10 min, and the complexes were mixed with increasing concentrations of AF488-Fc (0–200 nM) for 10 min before measurement. All measurements were performed in duplicate.
Competitive inhibition with FcεRIα, Xolair, E2_79, and mAb15.1
FcεRIα (15 nM) and 5 nM Tb-Ab were incubated at room temperature for at least 10 min, and the complexes were mixed with 25 nM AF488-Fc preincubated with increasing concentrations of FcεRIα, Xolair, or E2_79 (0–200 nM). For mAb15.1 competitive inhibition, 15 nM FcεRIα and 5 nM Tb-Ab were incubated at room temperature for at least 10 min and then incubated with increasing concentrations of mAb15.1 (0–200 nM) for 10 min. These mixed samples were subsequently incubated with 25 nM AF488-Fc for 10 min. All measurements were performed in duplicate.
Dose–response measurements with small molecule compounds selected from the pilot screen
All small molecule compounds were dissolved in 100% DMSO. Small molecule compounds were prepared with the final stock concentrations (up to 18.25 mM), and these compounds were distributed into the dose–response assay at a 73-fold dilution (final concentrations: 0–250 μM). FcεRIα (15 nM) and 5 nM Tb-Ab were incubated at room temperature for 10 min, and the complexes were mixed with 25 nM AF488-Fc preincubated for 10 min with increasing concentrations of each small compound (0–200 μM).
Complex dissociation kinetic assay
Preformed complexes (15 nM FcεRIα, 5 nM Tb-Ab, and 25 nM AF488-Fc) were incubated with either FcεRIα or E2_79 at a final concentration of 2 μM. Measurements were performed at multiple time points (0 min to 5 h). All measurements were performed in duplicate.
Pilot screen with the NIH Clinical Collection Library
The pilot screen with 446 compounds in the NIH Clinical Collection Library was carried out at the Stanford High Throughput Bioscience Facility (HTBC). For Z’ factor determination [22], both positive and negative controls were set up in parallel on each plate. For the positive controls, 20 nM FcεRIα and 5 nM Tb-Ab were first incubated together in the assay buffer for 10 min, and then the preformed complexes were incubated with 50 nM AF488-Fc for 10 min. This positive control for binding was distributed in columns 1 and 2 of a 384-well plate in a volume of 10 μl, and no library compounds were added. For a negative control, 5 nM Tb-Ab and 50 nM AF488-Fc, without FcεRIα, were incubated for 10 min and distributed in columns 23 and 24 of a 384-well plate, also without the addition of library compounds. The premixed assay proteins (20 nM FcεRIα and 5 nM Tb-Ab) were dispensed into columns 3–22 (10 μl), and compounds from the NIH Clinical Collection Library (stock concentrations: 6–24.8 mM) were added as 1000-fold dilutions for each compound (final concentrations: 6–24.8 μM). Fluorescence signals at 490 and 520 nm were measured with a 100-μs delay after excitation at 340 nm using an Infinite M1000 plate reader (Tecan). The pilot screen was carried out with duplicate measurements for each compound, and the plates were read at 15 min and 3 h.
Data fitting
The TR–FRET ratio was calculated as fluorescence intensity at 520 nm divided by fluorescence intensity at 490 nm. Data obtained were analyzed and plotted using KaleidaGraph (Synergy). Binding constants (Kd) of AF488-Fc and half-maximal inhibitory concentrations (IC50) of FcεRIα, Xolair, E2_79, and mAb15.1 were obtained by fitting the experimental data to a standard Michaelis–Menten/hyperbolic curve-fitting model.
Results
A TR–FRET assay for IgE–receptor binding
The format for the TR–FRET assay is shown in Fig. 1. Commercially available LanthaScreen Elite Tb-Ab is used as a donor fluorophore, and site-specific AF488-Fc is used as the acceptor. The Tb-labeled antibody binds to His6-tagged FcεRIα, and there is no tag on the AF488-Fc. The formation of a ternary complex containing Tb-Ab, FcεRIα, and AF488-Fc results in fluorescence energy transfer between the Tb-Ab donor and the AF488-Fc acceptor (Figs. 1 and 2). TR–FRET provides a benefit in that the long emission half-lives of lanthanides, such as Tb, make the assay less susceptible to background fluorescence interference from AF488-Fc or library compounds. The TR–FRET measurement is initiated with a pulse of light to excite the Tb donor, followed by a delay time (~100 μs) and then a FRET measurement taken over 400 μs. Interfering fluorescence from library compounds is likely to decay with nanosecond half-lives, limiting their impact on the TR–FRET assay.
Fig.1.
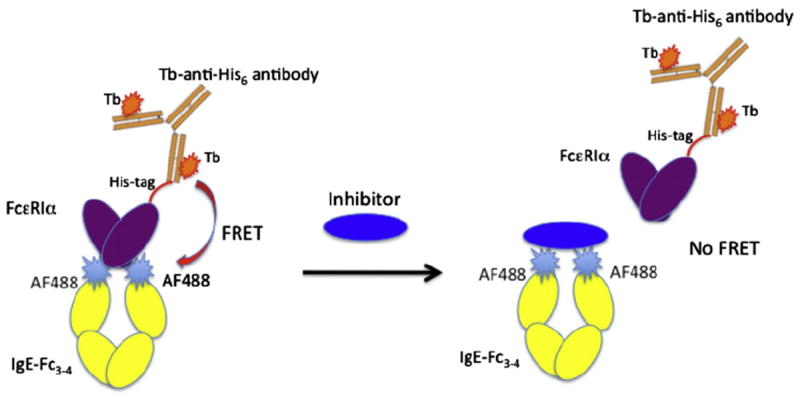
Schematic of the TR–FRET assay. The terbium-labeled anti-His-tag antibody (Tb-Ab) acts as a FRET donor to the Alexa Fluor 488-labeled IgE-Fc. The Tb-Ab binds an N-terminal His6 tag present in FcεRIα. The Alexa Fluor 488 dye is covalently coupled to the IgE-Fc3–4 at residue 367, which was mutated to cysteine to enable site-specific labeling, generating the AF488-Fc. Assembly of the Tb-anti-His6 antibody, FcεRIα, and AF488-Fc ternary complex results in FRET between the acceptor and donor fluorophores, which can be inhibited by inhibitory ligands that bind IgE-Fc or FcεRIα.
Fig.2.
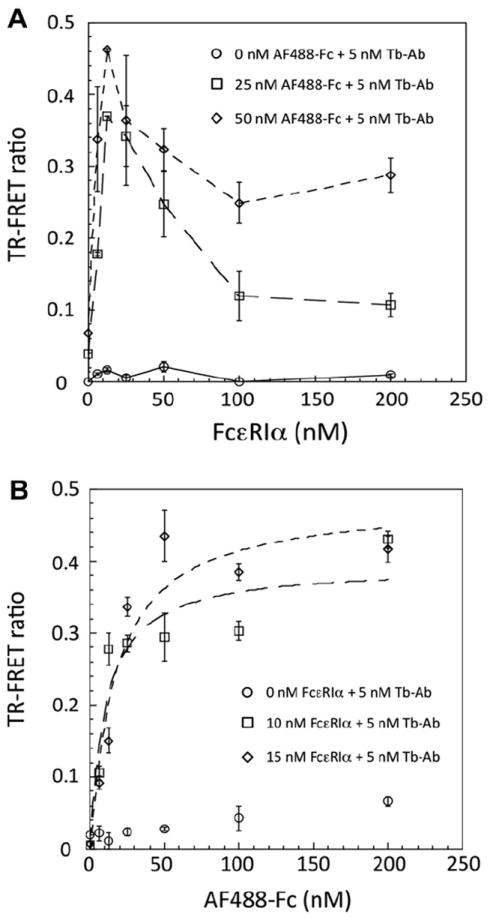
Characterization and optimization of the TR–FRET assay. (A) FcεRIα titration experiments with 0, 25, and 50 nM AF488-Fc and 5 nM Tb-Ab. No TR–FRET signal is observed in the absence of AF488-Fc. A distinct peak in the TR–FRET ratio is observed at approximately 12 nM FcεRIα, using either 25 or 50 nM AF488-Fc, with higher FcεRIα concentrations leading to a decline in the TR–FRET ratio. (B) AF488-Fc titration experiments with 0, 10, and 15 nM FcεRIα and 5 nM Tb-Ab. Minimal fluorescence background is observed in the absence of FcεRIα. In the presence of FcεRIα, the AF488-Fc titration curves exhibit a hyperbolic shape, yielding an apparent equilibrium Kd of approximately 16 nM.
We performed saturation binding experiments to establish optimal assay parameters. First, FcεRIα concentrations were varied in the presence of fixed Tb-Ab and two concentrations of AF488-Fc. These saturation binding experiments indicated that with 5 nM Tb-Ab, the optimal concentration of FcεRIα was approximately 12.5 nM, which provided the maximum TR–FRET signal (Fig. 2A). This observation also indicated that high concentrations of FcεRIα (25–200 nM) lead to a reduction in the amount of the ternary complex, as seen in the decreasing TR–FRET, as separate Tb-Ab–FcεRIα and IgE-Fc–FcεRIα complexes form that would not colocalize the donor and acceptor fluorophores.
Next, AF488-Fc saturation binding experiments were conducted with 10 and 15 nM FcεRIα together with 5 nM Tb-Ab (Fig. 2B), which showed simple hyperbolic saturation of the TR–FRET signal. The apparent Kd for this interaction was approximately 16 nM, in good agreement with a Kd of approximately 30 nM measured independently in the FQ assay (manuscript in press) and with the expectation that the mutation of the IgE-Fc C328 disulfide bond leads to an approximately 10-fold decrease in the binding affinity [9]. Importantly, very low background signal was observed for the Tb-Ab and AF488-Fc in the absence of FcεRIα, consistent with the requirement that all components be recruited into a ternary complex for TR–FRET to occur. Under these assay conditions, using 15 nM FcεRIα, 5 nM Tb-Ab, and 25 nM AF488-Fc, an S/B ratio of approximately 14 was observed, which was a significant improvement over our FQ assay (S/B ~ 0.3), providing improved sensitivity for primary HTS.
Known inhibitors reduce the TR–FRET signal in a dose–response manner
To demonstrate that the TR–FRET assay is specific and can quantitatively measure the inhibition of IgE–receptor interactions by known IgE inhibitors, we measured the TR–FRET ratio of the ternary complex in the presence of FcεRIα lacking a His tag, the anti-IgE antibody (omalizumab/Xolair), DARPin E2_79, and the anti-FcεRI antibody mAb15.1. FcεRIα lacking a His tag cannot bind and recruit Tb-Ab into ternary complexes, omalizumab is an anti-IgE antibody that binds an epitope overlapping the FcεRIα binding site [23], E2_79 [15-17] binds the IgE-Fc Cε3 domains with partial steric overlap with FcεRIα, and Mab15-1 binds FcεRIα directly at the IgE binding site. These IgE inhibitors exhibited concentration-dependent reductions in the observed TR–FRET signal, consistent with the expected inhibition of IgE-Fc–receptor complex formation (Fig. 3). These results further indicate that the TR–FRET assay will enable identification of inhibitors that not only bind to IgE but alternatively could bind to FcεRI. The apparent IC50 for each inhibitor was determined from the inhibition curves (Table 1). The apparent IC50 values for Xolair (IC50 ~ 3.4 nM) and mAb15.1 (IC50 ~ 7.7 nM) measured in the TR–FRET assay are in the range of previously described values obtained from in vitro cell-based assays [13,15]. Taken together, these results demonstrate that this TR–FRET assay provides a simple, reliable, and robust readout for monitoring IgE–FcεRI interaction in the presence of IgE and FcεRI-directed inhibitors.
Fig.3.
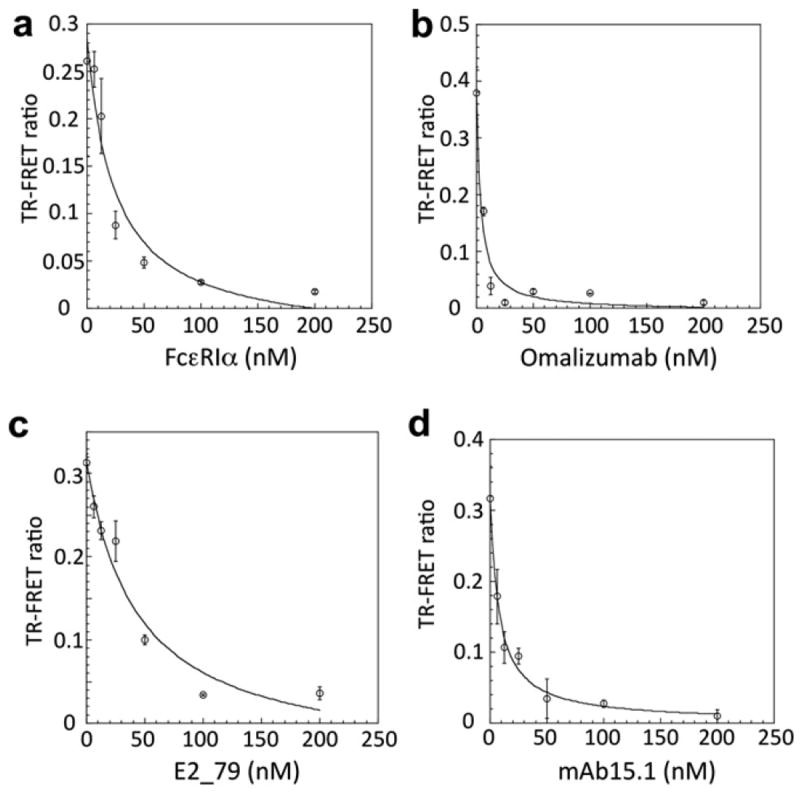
The TR–FRET assay follows competitive inhibition mediated by IgE-Fc and FcεRIα-specific ligands. (A) Inhibition with FcεRIα lacking a His tag. Here, 25 nM AF488-Fc premixed with increasing concentrations of FcεRIα lacking a His tag (0– 200 nM) was tested in the presence of 15 nM FcεRIα and 5 nM Tb-Ab. (B) Inhibition with anti-IgE omalizumab (Xolair). Here, 25 nM AF488-Fc premixed with increasing concentrations of Xolair (0–200 nM) was tested in the presence of 15 nM FcεRIα and 5 nM Tb-Ab. (C) Inhibition with the IgE-Fc ligand DARPin E2_79. Here, 25 nM AF488-Fc premixed with increasing concentrations of E2_79 (0–200 nM) was tested in the presence of 15 nM FcεRIα and 5 nM Tb-Ab. (D) Inhibition with anti-FcεRIα Mab15-1. Here, 25 nM AF488-Fc was tested in the presence of 15 nM FcεRIα and 5 nM Tb-Ab premixed with increasing concentrations of mAb15.1 (0–200 nM).
Table 1.
Inhibition constants of IgE inhibitors in the TR–FRET assay.
| Inhibitor | IC50 (nM) | Standard error |
|---|---|---|
| FcεRIα | 24.3 | 12.4 |
| Xolair | 3.4 | 1.4 |
| E2_79 | 43.1 | 19.3 |
| mAb15.1 | 7.7 | 1.3 |
Measurement of IgE–FcεRIα dissociation rates in the presence of inhibitors
Classic competitive inhibitors do not influence the dissociation rates of preformed ligand–receptor complexes, but they require ligand dissociation prior to inhibitor binding. In this TR–FRET assay, the untagged FcεRIα protein acts as a classical competitive inhibitor, and at high concentrations the rate of inhibitor binding should be limited by IgE–FcεRIα dissociation. Recently, we demonstrated that the DARPin E2_79 is an inhibitor that accelerates the dissociation of IgE–FcεRIα complexes, likely by competing with intermediates along the IgE–FcεRIα dissociation pathway that becomes accessible to simultaneous E2_79 binding (manuscript in press). To investigate whether our TR–FRET assay can also monitor the change of the apparent dissociation rate of the complex in the presence of E2_79, we compared dissociation of the AF488-Fc–FcεRIα complexes in the presence of FcεRIα lacking the His tag and E2_79 (Fig. 4). Preformed ternary complexes reequilibrated to a new equilibrium set point in the presence of inhibitors over a period of 5 to 60 min. The dissociation rate constants of the complex in the presence of FcεRIα and E2_79 were dramatically different. The apparent dissociation rate in the presence of E2_79 was dramatically accelerated relative to FcεRIα, based on data points corresponding to the initial linear portion of the dissociation curves (~2 h and 10 min, respectively). E2_79 increased the apparent dissociation rate of the complex by at least 10-fold. A steady background decrease in the TR–FRET signal was observed over multiple measurements over long time periods, also evident in controls lacking any inhibitors, which might be due to photoble-aching or a slow loss of Tb-Ab–FcεRIα–AF488-Fc complexes. However, these data demonstrate that the TR–FRET assay can be used to measure the kinetic effects of inhibitors, potentially providing a tool to identify IgE inhibitors that increase the dissociation rate of the complex, similar to the activity observed for E2_79.
Fig.4.
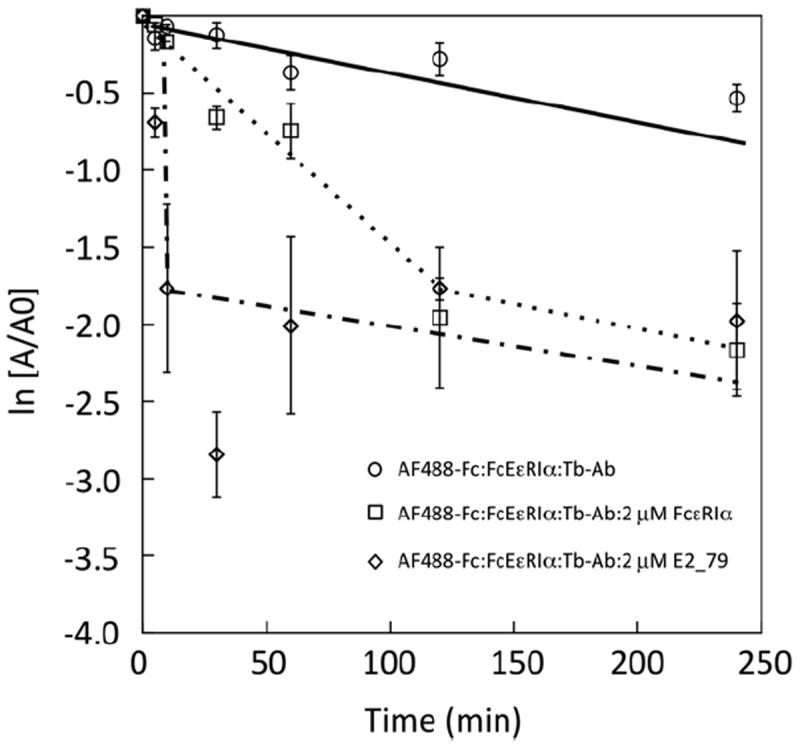
Measurement of the apparent dissociation rate of AF488-Fc–FcεRIα complexes in the presence of IgE inhibitors. Excess IgE inhibitors (FcεRIα or E2_79) were incubated with preformed ternary complexes (AF488-Fc–FcεRIα–Tb-Ab). A slow decay in TR–FRET is observed in the absence of inhibitors. The rate of dissociation measured in the presence of E2_79 is characteristic of the ability of E2_79 to accelerate the dissociation of prebound IgE-Fc.
A pilot screen with the NIH Clinical Collection Library
DMSO is widely used for solubilizing small molecule libraries, so the DMSO tolerance of the TR–FRET assay was examined. TR–FRET signals were recorded in the presence of DMSO (Fig. 5). The TR–FRET signal remained significantly unchanged up to 5% (v/v) DMSO, exhibiting partial loss of signal in 10% DMSO. The assay is sufficiently robust for HTS, allowing measurements of compounds at 20-fold dilutions from a primary library dissolved in DMSO.
Fig.5.
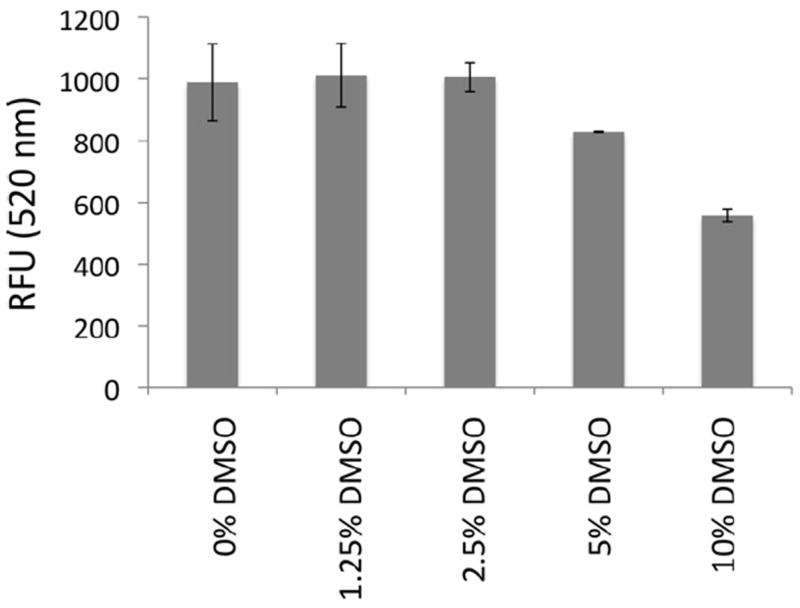
DMSO tolerance of TR–FRET assay. Preformed ternary complexes (AF488-Fc–FcεRIα–Tb-Ab) were mixed with increasing concentrations of DMSO, and FRET signals (520 nm) were measured. RFU, relative fluorescence units.
We conducted a pilot screen using 446 compounds in the NIH Clinical Collection Library. We reduced the volumes to 10 μl in 384-well plates, and the NIH Clinical Collection Library compounds were added to premixed assay reagents (20 nM FcεRIα, 5 nM Tb-Ab, and 50 nM AF488-Fc) in duplicate. The assay buffer contains detergent (0.1% Tween 20) and carrier protein (100 nM BSA) to help eliminate nonspecific inhibition. Negative and positive controls were included in each plate. Overall statistics for the assay are good, yielding an average S/B ratio of 4.9 and a Z’ factor of 0.68 (Fig. 6). The results shown represent the averaged inhibition of each compound measured in duplicate. One compound reproducibly showed increased fluorescence, leading to a −145% level of inhibition (not shown for clarity). From this preliminary screen, no compounds exhibited an average inhibition greater than 50%.
Fig.6.
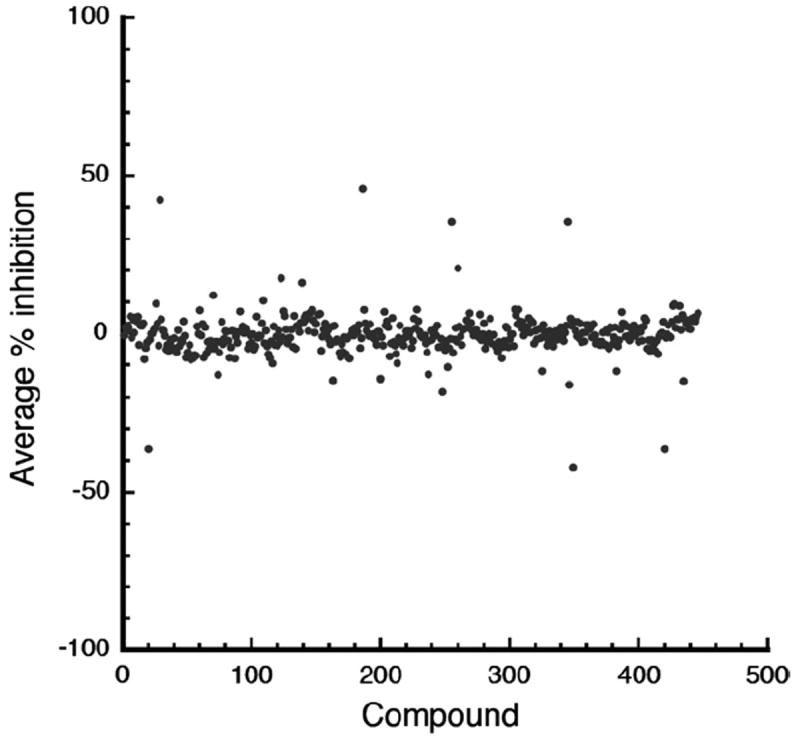
Pilot screen results using the NIH Clinical Collection Library. Scatter plots show the averaged percentage inhibition for each compound. One compound that exhibited increased overall fluorescence consistent with assay interference and yielded an overall −145% level of apparent “inhibition” is not shown for clarity. The overall S/B ratio was 4.9 and the Z’ factor was 0.68 for the pilot screen.
Two candidates for hit compounds from the pilot screen showed consistent inhibition in duplicates and increased inhibition over time (15 min vs. 3 h), consistent with the slow kinetics of dissociation. At 3 h, rofecoxib (Vioxx) had an average inhibition of 30.4% (31.7 and 29.1% in replicates), increasing from 11% at 15 min. Dihydrexidine hydrochloride had an average inhibition of 28.2% (24 and 32.4% in replicates), increasing from 6.7% at 15 min. An additional three compounds were chosen for further follow-up studies. One (epigallocatechin gallate) showed no increase over time but exhibited low variability in replicates and overall 35% inhibition. Two others, oxiconazole nitrate and loratidine, showed high average inhibition (46 and 35%, respectively) but with inconsistent replicates. To further evaluate these five compounds from the screen, we subsequently measured full dose–response curves over concentrations spanning 0 to 250 μM. None of the compounds showed a concentration-dependent decrease in the TR–FRET signal, indicating that these are not inhibitors of the interaction of IgE and FcεRIα. Overall, however, these data demonstrate that the TR–FRET assay is suitable for HTS and can be adapted for large-scale compound screening.
Discussion
The IgE–FcεRI interaction is centrally involved in triggering inflammatory allergic reactions. Due to its central importance, this interaction has been a therapeutic target [11-16]. Recent structural and mechanistic studies of the DARPin E2_79 IgE inhibitor provide evidence that preformed receptor-bound IgE can be actively disassembled with accelerated dissociation rates (manuscript in press). Small molecule inhibitors of tumor necrosis factor (TNF) that accelerate the dissociation of TNF trimers approximately 600-fold have been identified [18,24], and small molecule inhibitors with similar activity against IgE–FcεRI complexes might offer significant clinical benefits.
A TR–FRET assay has been developed to monitor the binding of IgE-Fc to the high-affinity receptor (FcεRIα). We demonstrated that this assay can be used to quantitatively measure inhibitors of the binding interaction and, furthermore, that this assay allows us to identify inhibitors that affect the dissociation rates of IgE–FcεRI complexes. The binding affinity of FcεRIα for AF488-Fc (~16 nM) is weaker than the binding affinity of FcεRIα for IgE-Fc (~1 nM), which may improve the ability of the assay to identify low-affinity lead inhibitors of the IgE–receptor interaction. The assay is a simple mix-and-read assay conducted in a microplate format, and it exhibits S/B and Z’ statistics that are compatible with HTS. A preliminary small-scale screen of 446 compounds further demonstrates the suitability of the assay for a large-scale screen and indicates that the hit rate set with cutoffs of greater than 50% inhibition for duplicate measurements could be less than 0.1% in a larger screen, corresponding to less than 100 leads from a 100,000-compound library or less than 1000 leads from a 1,000,000-compound library. Due to the high affinities among reagents and a high S/B ratio of the assay, relatively small amounts of the reagents are required for screening a large compound library.
Acknowledgments
We thank past and present members of the Jardetzky Laboratory, as well as Bruch Koch and David Solow-Cordero. This research was supported in part by an NIH research grant to T.S.J. (AI-18939), an American Asthma Foundation Senior Investigator Award, and the Swiss Commission of Technology and Innovation (KTI grant 8803.1 LSPP-LS to A.E. and M.V.).
Footnotes
Abbreviations used: IgE, immunoglobulin E; IgG, immunoglobulin G; DARPin, designed ankyrin repeat protein; FQ, fluorescence-quenching; S/B, signal/background; HTS, high-throughput screening; TR–FRET, time-resolved fluorescence resonance energy transfer; NIH, National Institutes of Health; Tb-Ab, terbium-labeled anti-His antibody; PCR, polymerase chain reaction; AF488-Fc, Alexa Fluor-labeled 367 IgE-Fc; BSA, bovine serum albumin; DMSO, dimethyl sulfoxide; TNF, tumor necrosis factor.
References
- 1.Arbes SJ, Jr, Gergen PJ, Elliott L, Zeldin DC. Prevalences of positive skin test responses to 10 common allergens in the U.S. population: results from the third National Health and Nutrition Examination Survey. J Allergy Clin Immunol. 2005;116:377–383. doi: 10.1016/j.jaci.2005.05.017. [DOI] [PubMed] [Google Scholar]
- 2.Galli SJ, Tsai M. IgE and mast cells in allergic disease. Nat Med. 2012;18:693–704. doi: 10.1038/nm.2755. [DOI] [PMC free article] [PubMed] [Google Scholar]
- 3.Kraft S, Kinet JP. New developments in FcεRI regulation, function, and inhibition. Nat Rev Immunol. 2007;7:365–378. doi: 10.1038/nri2072. [DOI] [PubMed] [Google Scholar]
- 4.Kalesnikoff J, Galli SJ. New developments in mast cell biology. Nat Immunol. 2008;9:1215–1223. doi: 10.1038/ni.f.216. [DOI] [PMC free article] [PubMed] [Google Scholar]
- 5.Henry AJ, McDonnell JM, Ghirlando R, Sutton BJ, Gould HJ. Conformation of the isolated Cε3 domain of IgE and its complex with the high-affinity receptor, FcεRI. Biochemistry. 2000;39:7406–7413. doi: 10.1021/bi9928391. [DOI] [PubMed] [Google Scholar]
- 6.Holdom MD, Davies AM, Nettleship JE, Bagby SC, Dhaliwal B, Girardi E, Hunt J, Gould HJ, Beavil AJ, McDonnell JM, Owens RJ, Sutton BJ. Conformational changes in IgE contribute to its uniquely slow dissociation rate from receptor FcεRI. Nat Struct Mol Biol. 2011;18:571–576. doi: 10.1038/nsmb.2044. [DOI] [PMC free article] [PubMed] [Google Scholar]
- 7.Wurzburg BA, Garman SC, Jardetzky TS. Structure of the human IgE-Fc Cε3–Cε4 reveals conformational flexibility in the antibody effector domains. Immunity. 2000;13:375–385. doi: 10.1016/s1074-7613(00)00037-6. [DOI] [PubMed] [Google Scholar]
- 8.Garman SC, Wurzburg BA, Tarchevskaya SS, Kinet JP, Jardetzky TS. Structure of the Fc fragment of human IgE bound to its high-affinity receptor FcεRIα. Nature. 2000;406:259–266. doi: 10.1038/35018500. [DOI] [PubMed] [Google Scholar]
- 9.Hunt J, Beavil RL, Calvert RA, Gould HJ, Sutton BJ, Beavil AJ. Disulfide linkage controls the affinity and stoichiometry of IgE FCε3–4 binding to FcεRI. J Biol Chem. 2005;280:16808–16814. doi: 10.1074/jbc.M500965200. [DOI] [PubMed] [Google Scholar]
- 10.Basu M, Hakimi J, Dharm E, Kondas JA, Tsien WH, Pilson RS, Lin P, Gilfillan A, Haring P, Braswell EH, Nettleton MY, Kochan JP. Purification and characterization of human recombinant IgE-Fc fragments that bind to the human high affinity IgE receptor. J Biol Chem. 1993;268:13118–13127. [PubMed] [Google Scholar]
- 11.Di Domenico M, Bisogno A, Polverino M, De Rosa C, Ricci V, Capasso A. Xolair in asthma therapy: an overview. Inflamm Allergy Drug Targets. 2011;10:2–12. doi: 10.2174/187152811794352042. [DOI] [PubMed] [Google Scholar]
- 12.Kuhl K, Hanania NA. Targeting IgE in asthma. Curr Opin Pulm Med. 2012;18:1–5. doi: 10.1097/MCP.0b013e32834deebb. [DOI] [PubMed] [Google Scholar]
- 13.Mirkina I, Schweighoffer T, Kricek F. Inhibition of human cord blood-derived mast cell responses by anti-FcεRI mAb 15/1 versus anti-IgE omalizumab. Immunol Lett. 2007;109:120–128. doi: 10.1016/j.imlet.2007.02.003. [DOI] [PubMed] [Google Scholar]
- 14.Nechansky A, Kricek F. Mapping the epitope of the anti-FcεRIα mAb15/1 to peptide eRI. Allergy. 2001;56:45. doi: 10.1034/j.1398-9995.2001.056005450.x. [DOI] [PubMed] [Google Scholar]
- 15.Baumann MJ, Eggel A, Amstutz P, Stadler BM, Vogel M. DARPins against a functional IgE epitope. Immunol Lett. 2010;133:78–84. doi: 10.1016/j.imlet.2010.07.005. [DOI] [PubMed] [Google Scholar]
- 16.Eggel A, Baumann MJ, Amstutz P, Stadler BM, Vogel M. DARPins as bispecific receptor antagonists analyzed for immunoglobulin E receptor blockage. J Mol Biol. 2009;393:598–607. doi: 10.1016/j.jmb.2009.08.014. [DOI] [PubMed] [Google Scholar]
- 17.Eggel A, Buschor P, Baumann MJ, Amstutz P, Stadler BM, Vogel M. Inhibition of ongoing allergic reactions using a novel anti-IgE DARPin-Fc fusion protein. Allergy. 2011;66:961–968. doi: 10.1111/j.1398-9995.2011.02546.x. [DOI] [PubMed] [Google Scholar]
- 18.Wells JA, McClendon CL. Reaching for high-hanging fruit in drug discovery at protein–protein interfaces. Nature. 2007;450:1001–1009. doi: 10.1038/nature06526. [DOI] [PubMed] [Google Scholar]
- 19.Wurzburg BA, Jardetzky TS. Conformational flexibility in immunoglobulin E-Fc3–4 revealed in multiple crystal forms. J Mol Biol. 2009;393:176–190. doi: 10.1016/j.jmb.2009.08.012. [DOI] [PMC free article] [PubMed] [Google Scholar]
- 20.Garman SC, Sechi S, Kinet JP, Jardetzky TS. The analysis of the human high affinity IgE receptor FcεRIα from multiple crystal forms. J Mol Biol. 2001;311:1049–1062. doi: 10.1006/jmbi.2001.4929. [DOI] [PubMed] [Google Scholar]
- 21.Garman SC, Kinet JP, Jardetzky TS. Crystal structure of the human high-affinity IgE receptor. Cell. 1998;95:951–961. doi: 10.1016/s0092-8674(00)81719-5. [DOI] [PubMed] [Google Scholar]
- 22.Zhang JH, Chung TD, Oldenburg KR. A simple statistical parameter for use in evaluation and validation of high throughput screening assays. J Biomol Screen. 1999;4:67–73. doi: 10.1177/108705719900400206. [DOI] [PubMed] [Google Scholar]
- 23.Zheng L, Li B, Qian W, Zhao L, Cao Z, Shi S, Gao J, Zhang D, Hou S, Dai J, Wang H, Guo Y. Fine epitope mapping of humanized anti-IgE monoclonal antibody omalizumab. Biochem Biophys Res Commun. 2008;375:619–622. doi: 10.1016/j.bbrc.2008.08.055. [DOI] [PubMed] [Google Scholar]
- 24.He MM, Smith AS, Oslob JD, Flanagan WM, Braisted AC, Whitty A, Cancilla MT, Wang J, Lugovskoy AA, Yoburn JC, Fung AD, Farrington G, Eldredge JK, Day ES, Cruz LA, Cachero TG, Miller SK, Friedman JE, Choong IC, Cunningham BC. Small-molecule inhibition of TNF-α. Science. 2005;310:1022–1025. doi: 10.1126/science.1116304. [DOI] [PubMed] [Google Scholar]


