

Abstract
The human cytochrome P450 (CYP) enzyme family is involved in the biotransformation of many xenobiotics. As part of the U.S. Tox21 Phase I effort, we profiled the CYP activity of approximately three thousand compounds, primarily those of environmental concern, against human CYP1A2, CYP2C19, CYP2C9, CYP2D6, and CYP3A4 isoforms in a quantitative high throughput screening (qHTS) format. In order to evaluate the extent to which computational models built from a drug-like library screened in these five CYP assays under the same conditions can accurately predict the outcome of an environmental compound library, five support vector machines (SVM) models built from over 17,000 drug-like compounds were challenged to predict the CYP activities of the Tox21 compound collection. Although a large fraction of the test compounds fall outside of the applicability domain (AD) of the models, as measured by k-nearest neighbor (k-NN) similarities, the predictions were largely accurate for CYP1A2, CYP2C9, and CYP3A4 ioszymes with area under the receiver operator characteristic curves (AUC-ROC) ranging between 0.82 and 0.84. The lower predictive power of the CYP2C19 model (AUC-ROC = 0.76) is caused by experimental errors and that of the CYP2D6 model (AUC-ROC = 0.76) can be rescued by rebalancing the training data. Our results demonstrate that decomposing molecules into atom types enhanced the coverage of the AD and that computational models built from drug-like molecules can be used to predict the ability of non-drug like compounds to interact with these CYPs.
Keywords: Human CYPs, QSAR models, Predictive Capacity, SVM, Predictive Toxicology
Introduction
The cytochrome P450 proteins (CYPs) are a gene super-family of heme proteins that consists in humans of 57 isozymes[1]. CYPs play critical roles by catalyzing reactions in: (a) the metabolism of pharmaceuticals, environmental pollutants, and other xenobiotics; (b) the biosynthesis of steroid hormones; (c) the oxidation of unsaturated fatty acids to intracellular messengers; and (d) the metabolism of fat-soluble vitamins[2–8]. Variability in xenobiotic metabolism is an important complicating factor in many areas of pharmacology and toxicology[7], and the activities of CYP enzymes are affected by genetic, endogenous, and environmental factors. Among environmental factors, compounds that inhibit or induce the activity of various CYPs are among the most important. Alteration of CYP activity by drugs or chemicals has received considerable attention since cimetidine was shown to affect drug metabolism in both animals and humans[9–10]. Predictive in vitro assays and in vitro–in vivo extrapolation models have revolutionized this aspect of drug development. However, interactions of environmental compounds with CYPs are less well developed and the significance of chemical–drug or chemical–chemical interactions is still not well understood.
Structural examination of the CYP isozymes by X-ray crystallography indicates an extremely plastic and flexible binding site, which can accommodate structurally diverse compounds of different molecular weights[11–14]. This conformational plasticity of CYP isozymes has precluded the use of some structure-based approaches, such as molecular docking, from making conclusive predictions. On the other hand, ligand-based approaches, such as quantitative structure-activity relationships (QSAR) and machine learning, are widely used to predict the CYP activities of compounds[15–16]. Of the various human CYPs, five isoforms -- 1A2, 2C9, 2C19, 2D6 and 3A4 -- account for the metabolism of 90% of known drugs[17]. The public availability of a large dataset, containing over 17,000 compounds screened against these five CYPs, using a quantitative high throughput screening (qHTS) platform by the National Center for Advancing Translational Sciences (NCATS), has laid a solid foundation for QSAR approaches[18]. This collection, consisting mostly of drug-like compounds, is a valuable resource for the prediction of the CYP profiles of compounds in the drug discovery pipeline. In this study, models based on these drug-like compounds have been used to predict the CYP profiles of nearly 3,000 structurally dissimilar molecules (including industrial chemicals, food additives, pesticides, and a relatively small number of pharmaceutical agents) contained within the pilot phase collection of the U.S. Tox21 program[19–20]. The predictions were then compared with results obtained for the Tox21 compound library screened against the same CYPs under the same experimental conditions used to screen the drug-like library.
It has long been recognized that no single QSAR model is applicable to all molecules, since no matter how large and diverse the training data are, the chemical space represented by the training data is limited. A reliable prediction requires a minimum level of structural similarity between the test set compounds and the training compounds[21]. The applicability domain (AD) of a model is defined as “the response and chemical structure space in which the model makes predictions with a given reliability”[22]. This domain can be represented simply by a bounding box, convex hull, or ellipsoid covering the training set in descriptor space, or more precisely by similarities of the nearest neighbors[23–24]. A general consensus is that test set compounds falling in the AD of a developed model can be predicted with higher confidence. With a predefined AD, we can quantitatively estimate the prediction accuracy of a compound according to its distance to model (DM)[25].
In the QSAR and machine learning community, AD is a ubiquitous term associated with many models, and the concept of AD not only supplies an immediate explanation to a large fraction of failed predictions, but also reminds users of the existence of a model boundary. Despite the importance of AD, there lacks a universal definition of AD that can be used to precisely estimate the predictive power of a model. The K-nearest neighbor algorithm (k-NN), originally designed for classification and regression[26], is widely accepted to assess the DM of a test compound, since the k-NN similarity of a test compound is a good measurement of the extent to which the compound is represented by the training set of compounds.
Another challenge to the QSAR and machine learning community is imbalanced data sets. Recently, substantial research has been devoted to the development and analysis of strategies to efficiently learn from imbalanced data sets[27–28]. The strategies, such as re-balancing a training set through over-sampling the minority class and under-sampling the majority class, are mostly focused on how to enhance the predictive accuracy of the minority class[29–30]. Under-sampling has been shown to produce a reasonable sensitivity to changes in class distribution, while over-sampling often demonstrates little or no effect[29]. Limited successes have also been observed in cost sensitive, consensus, and ensemble learning[31]. In this study, different rebalancing strategies were practiced where identified as needed, and the results are presented and analyzed.
Materials and Methods
Data sets
The pilot phase Tox21 compound collection consists of 2870 compounds, 1408 of which were provided by the National Toxicology Program (NTP)[32] and 1462 provided by the U.S. Environmental Protection Agency (EPA)[33–34]. The structures and annotations of these compounds are publicly available[35–37]. Compounds from the NTP and EPA collections were tested against the five recombinant CYP isozymes (1A2, 2C9, 2C19, 2D6, 3A4)[18] at 14 or 15 concentrations with the final concentrations ranging from 0.6 nM to 92 μM. CYP profiles generated on 17,143 drug-like compounds were downloaded from PubChem (PubChem AID: 1851) and used as the training data. These five isozymes were assayed with a bioluminescent-based detection technique where the activity of firefly luciferase is coupled to the metabolism of pro-luciferin CYP substrates[38]. The luciferase-based P450-Glo™ Screening Systems were obtained from Promega (Madison, WI, USA) for CYP1A2 (V9770), CYP2C9 (V9790), CYP2C19 (V9880), CYP2D6 (V9890), and CYP3A4 Luciferin-PPXE (V9910) and were adapted for 1,536-well microplates and an automated protocol. The control compounds furafylline (Chemicals Abstracts Service Registry Number [CASRN] 80288-49-9) for CYP1A2, sulfaphenazole (CASRN 526-08-9) for CYP2C9, ketoconazole (CASRN 65277-42-1) for CYP2C19, quinidine (CASRN 56-54-2) for CYP2D6, and ketoconazole for CYP3A4 were purchased from Sigma Aldrich (St. Louis, MO, USA). Recombinant CYP enzymes were obtained from baculovirus constructs expressed in insect cells (BD/Gentest, San Jose, CA). These enzymatic assays detect both inhibitors and activators of the CYP isozymes. It is important to note that in addition to inhibitors, substrates may also decrease the bioluminescent signal in these assays as both types of compounds reduce the amount of free enzyme available to catalyze the conversion of pro-luciferin substrates. Therefore, inhibition in the present dataset may be due to either inhibitors or substrates.
The Tox21 data sets were used as the test data. For each isozyme, compounds were binned into three different categories, active, inactive, and inconclusive, according to their curve classes[39]. Inconclusive compounds were excluded from the data set. The remaining compounds were processed through a Pipeline Pilot protocol (Accelrys, San Diego, CA) to remove salts, replicates, and heavy metal containing compounds. The same procedure was applied to process data in both the training and test sets. Finally, the duplicate compounds found in both training and testing sets were removed from the training sets.
Molecular descriptors
The molecular descriptors used in this study are custom generated atom types and correction factors. The atom types are assigned to each atom in a molecule according to its chemical environment, while the correction factors add important molecular properties to the descriptor system, such as molecular globularity, molecular flexibility, polar surface area, and group functionality. A detailed description of the atom typing procedure and definition of atom types and correction factors was published elsewhere[40–41].
Support vector machine (SVM)
Founded on an elegant mathematical theory of statistical learning, SVM is a supervised machine learning method that has been successfully applied to many pattern recognition problems[42]. As a widely used classification algorithm, SVM nonlinearly maps data points through its kernel algorithm from the original input space to a higher-dimensional feature space where the separation boundary are hyper-planes[43–44]. SVM is known to outperform other machine learning methods because of its outstanding generalization capability[11, 44]. Proved to be equivalent to minimization of the generalization errors, the SVM algorithm maximizes the margin between the separating hyper-planes. In cases where the training data are not separable, the concept of soft margin was introduced to allow misclassified data points at a cost, parameterized as C. C-SVM with the Gaussian Radial Basis Function (RBF) kernel was selected to construct the models in this study. Optimal SVM parameter selection was accomplished by a 7-fold cross-validation (CV) and an exhausted grid search. LIBSVM, a software implementation of SVM developed by Chang and Lin[45] was employed throughout the study.
Performance assessment for classifiers
The area under the receiver operating characteristics curve (AUC-ROC) is used to assess and analyze the performance of different classifiers. Its simplicity and insensitiveness to changes in class distribution and error costs make ROC a suitable tool in this study to compare the models with different levels of class skewness[46].
Similarity by k-NN method
To estimate to what extent a test compound is represented by the training set compounds, an averaged similarity between the test compound and its five nearest neighbors (5-NN) found in the training set was computed[25]. The overall similarity between a test set and a training set was calculated by averaging the 5-NN similarities of all test set compounds. The similarity of two individual compounds was defined as the Tanimoto coefficient calculated by using either FCFP_4 and ECFP_6 fingerprints, which are based on circular substructure fragments having a maximum diameter of 4 bonds and the extended connectivity up to a maximum width of 6 bonds, or the Cosine similarity of the mean centered and scaled atom typing descriptors used to construct the SVM models in this study. The DM of a test compound refers to the average similarity to its 5-NN in the training set.
Rebalance an imbalanced data set
Both under-sampling and over-sampling were carried out in this study to rebalance the heavily skewed CYP2D6 and slightly unbalanced CYP3A4 training data, where the actives are less than 14% and 33% respectively. Over-sampling was done by randomly selecting compounds from the minority class, which are the active compounds in this case, until the total number of active compounds was close to the number of inactive compounds in the majority class. To avoid an incomplete minority class, the randomly generated active compounds were appended to the original copy of non-redundant active compounds.
Several different under-sampling strategies were applied: 1. Random under-sampling, where a portion of inactive compounds were randomly selected to match the number of active compounds in the training set; 2. Similarity-guided under-sampling, where those inactive compounds which were the most similar to the test set compounds or to the active compounds in the training set were selected; 3. SV-guided under-sampling, where a new training set was formed by combining all of the inactive compounds in the support vectors and all of the active compounds in the training set.
Internal approaches to an imbalanced data set
The SVM algorithm was modified to deal with the problem of imbalanced data. Besides accuracy, 7-fold CV was performed to optimize precision, recall, and AUC (Fig. 1), respectively. In another attempt, heavier weights were assigned to the minority class to increase the penalties associated with false negatives.
Figure 1.
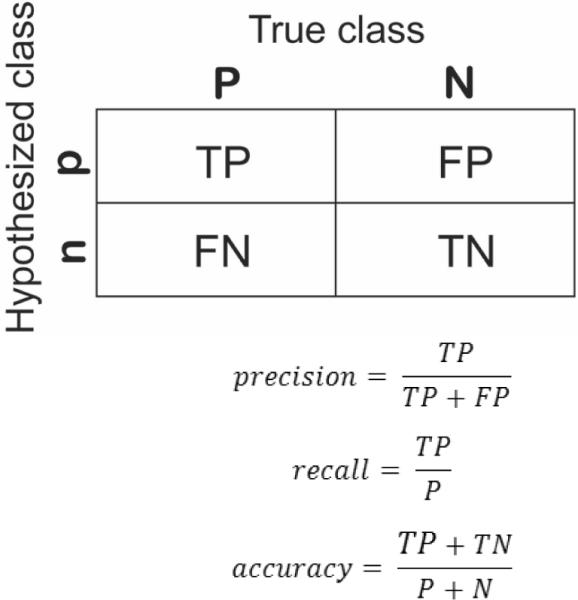
Confusion matrix of a two-class model and common performance metrics calculated from it.
Results and Discussion
Analysis of testing data
CYP2C9 and CYP2C19 sequences share 91% identical residues[14]; thus, a large overlap was observed between the active compounds of these two isoforms (Fig. 2A). Of 746 CYP2C9 actives, 547 compounds were also active in CYP2C19. However, an even larger overlap was found between the actives of CYP2C9 and CYP1A2, where 77.2% of CYP2C9 actives were also active in CYP1A2, although their sequences are much less similar (i.e., 25.8%) (Fig. 2A). Less than 14% of the test set compounds showed activity against CYP2D6, but 69.4% of these actives were also active in CYP1A2 and CYP2C9 (Fig. 2B). Of the 488 CYP3A4 actives, 65.6% of them were active in both CYP1A2 and CYP2C9 (Fig. 2C). Eighty-nine compounds were active in all five isoforms, while 1057 compounds were not active in any of the five CYPs (Fig. 2D).
Figure 2.

Venn diagrams showing the overlaps of (A) CYP1A2, CYP2C9, and CYP2C19 actives, (B) CYP1A2, CYP2C9, and CYP2D6 actives, (C) CYP1A2, CYP2C9, and CYP3A4 actives, and (D) a histogram showing the number of compounds active in 0 to 5 CYP isozymes.
SVM classifiers for CYP isozymes
Five SVM classifiers were built for the five major CYP isozymes based on the high quality qHTS data. Due to the differences in the number of inconclusive compounds from the five different assays, the training sets varied in size, ranging from 11,833 to 15,428 compounds. Similar variations also existed in the test sets (Table 1). The CV optimized SVM parameters, C and γ, for each CYP isozyme are listed in Table 1. The models produced accurate predictions on three of the five Tox21 test sets, with AUC-ROC between 0.82 and 0.84 for CYP1A2, CYP2C9, and CYP3A4. Less accurate but still fairly good predictions were achieved for CYP2C19 and CYP2D6, with AUC-ROC values of 0.76. The concordance, specificity and sensitivity values are also computed for the five models at their optimal cutoffs[47] (Table 1).
Table 1.
Summary of training and test sets of five CYP isozymes, optimized SVM parameters, and the performances of the five classifiers over the test sets.
| CYP Isozymes | |||||
|---|---|---|---|---|---|
| 1A2 | 2C19 | 2C9 | 2D6 | 3A4 | |
| Training Set | 14226 | 11833 | 13064 | 15428 | 13433 |
| Positive % | 39.8% | 44.8% | 38.1% | 13.7% | 33.5% |
| C | 4.0 | 4.0 | 4.0 | 4.0 | 4.0 |
| γ | 0.5 | 0.5 | 0.5 | 0.5 | 1.0 |
| CV (7) | 88.65% | 83.18% | 84.25% | 90.32% | 82.36% |
| Test Set (Pos %) | 2011 (44.5%) | 2005 (27.3%) | 1706 (43.7%) | 1945 (9.9%) | 1803 (27.1%) |
| AUC-ROC | 0.82 | 0.76 | 0.84 | 0.76 | 0.84 |
| Optimal Cutoff | 0.15 | 0.21 | 0.13 | 0.07 | 0.11 |
| Concordance | 72.6% | 67.0% | 77.1% | 64.8% | 75.8% |
| Sensitivity | 82.8% | 74.5% | 77.8% | 72.0% | 78.7% |
| Specificity | 64.4% | 64.2% | 76.7% | 64.0% | 74.7% |
Abbreviations: AUC-ROC = area under the receiver operator characteristic curves; C = cost of misclassification; CV = cross-validation; γ = gamma in kernel function; SVM = support vector machines.
Variation of data quality
Data quality and class distribution are the key to understanding the variations in the performances of the five CYP classifiers. Poor data quality is one of the fundamental contributors to the failure of QSAR models. One major source of poor quality data is experimental variance, which differs from assay to assay. Although the data quality of qHTS is much better than that of single concentration HTS, the assay results, like any other experimental data, are never error-free. To a certain extent, the proportion of inconclusive compounds is indicative of the overall quality of an assay. There are multiple reasons behind an inconclusive assay result, one of which relates to fluctuations in the assay data caused by experimental variances. The training set of CYP2C19 contained significantly more inconclusive compounds than the other isozymes (Table 1). Furthermore, the percentages of active compounds in the training and test sets differed by less than 6.4% for the other four isozymes, but this difference exceeded 17% for CYP2C19. There is a small portion of pharmaceuticals in the test set, some of which are identical to the training compounds. Although these duplicated compounds were later-on removed from the training data, they can be used as internal controls for estimating the assay consistency. Table 2 listed the compounds present in both the training and test sets of the five CYP isozymes, together with the mismatched assay results. CYP2C19 and CYP2C9 had significantly more compounds with inconsistent assay results even though the assay was run under the same conditions. Experimental errors and inconsistent assay results are likely the major reason for the poor performance of the CYP2C19 classifier.
Table 2.
The number of compounds duplicated between the training and test sets of the five CYP isozymes, together with the compound counts with inconsistent assay results.
| CYP Isozymes | |||||
|---|---|---|---|---|---|
| 1A2 | 2C19 | 2C9 | 2D6 | 3A4 | |
| Overlapped compounds | 102 | 123 | 88 | 114 | 100 |
| Mismatched compounds | 8 | 32 | 22 | 6 | 8 |
| Percentage of mismatches | 7.8% | 26.0% | 25.0% | 5.3% | 8.0% |
Cost sensitive learning for CYP2D6
Experimental errors cannot explain the poor performance of the CYP2D6 model, since the assay results were highly consistent for the duplicated compounds in the training and test sets of CYP2D6 (Table 2). Imbalanced class distribution, which tends to generate classifiers with a strong estimation bias toward the majority class[48], is another major source for poor predictive quality of a model.
Class imbalance is such a common problem that it has caused trouble to a large segment of the QSAR and machine learning community. Traditional machine learning algorithms tend to bias toward the majority class, thus producing poor predictive accuracy over the minority class. For imbalanced data sets, accuracy is not an adequate metric to evaluate the performance of a model. Using CYP2C6 as an example, if a model predicted all test set compounds as inactive, the accuracy would still be above 90%, but the precision and recall would suffer. Furthermore, a false negative is usually more costly than a false positive in the case of predictive toxicology.
To improve the predictive accuracy on active compounds in the CYP2D6 test set, the SVM and CV algorithms were modified to optimize the SVM parameters against precision, recall, and AUC in the 7-fold CV runs. The results, as listed in Table 3, indicate that the changes of the optimization criteria in selecting the best SVM parameters could not improve the predictive accuracy of CYP2D6 test set.
Table 3.
Summary of the SVM models optimized against different criteria, including the optimized SVM parameters, correct rates in a 7-fold CV, and predictive performances for CYP2D6.
| Optimization Criteria | ||||
|---|---|---|---|---|
| accuracy | precision | recall | AUC | |
| C | 2.5 | 0.5 | 64.0 | 4.0 |
| γ | 1.0 | 0.5 | 0.3 | 0.5 |
| Rate | 87.4% | 93.0% | 52.5% | 86.0% |
| AUC-ROC | 0.76 | 0.76 | 0.7 | 0.76 |
Abbreviations: ; AUC-ROC = area under the receiver operator characteristic curves; C = cost of misclassification; CV = cross-validation; γ = gamma in kernel function; ; ; P = positive; N = negative; TP = true positive; TN = true negative; FP = false positive.
One strategy to rebalance an imbalanced data set is to assign a larger penalty to misclassified minority class members (i.e., false negative for CYP2D6). Instead of the default weight of 1, a weight of 2, 5, 10, and 100 were assigned to the minority class, in an attempt to push the decision boundary away from the minority class[49]. The classifiers generated from the SVM-WEIGHT method did not improve the prediction accuracy at all different weights.
Rebalancing the skewed data
Under-sampling and over-sampling are the two major external methods to rebalance an imbalanced data set[30].
Over-sampling
The original active compounds in the minority class were appended with a number of randomly selected duplicated active compounds to reach a full balance against the inactive compounds. The over-sampled training set contains 13,347 active and 13,315 inactive compounds. The CV optimized classifier achieved a high CV accuracy of 97.5%, but no improvement was accomplished in terms of the model's capability to classify the test data (AUC-ROC = 0.75). The same conclusion, that over-sampling did not benefit from the change of the training set distribution and often produced little or no change in performance, was made in a study comparing the effectiveness of under- and over-sampling with the decision tree learner[29].
Under-sampling
Under-sampling is considered more efficient than over-sampling because of a reduced training set, but one concern is that removal of some compounds from the training set might result in information loss. Random under-sampling was first carried out, where about 17% of the inactive compounds were randomly selected from the pool of CYP2D6 training set to form a new training set with all the active compounds. The process was repeated 3 times, and the results are presented in Table 4. All three trials produced classifiers with slightly improved predictive power, while the consensus model, created by averaging the three probabilities for each test compound, resulting in an AUC-ROC of 0.79.
Table 4.
Summary of three parallel random under-sampling results.
| Random Under-sampling | ||||
|---|---|---|---|---|
| trial 1 | trial 2 | trial 3 | consensus | |
| C | 8.0 | 2.0 | 2.0 | |
| γ | 0.125 | 0.5 | 0.5 | |
| Rate (CV) | 78.5% | 78.5% | 79.1% | |
| AUC-ROC | 0.76 | 0.78 | 0.79 | 0.79 |
Abbreviations: AUC-ROC = area under the receiver operator characteristic curves; C = cost of misclassification; CV = cross-validation; γ = gamma in kernel function.
A similar approach, the ensemble consensus method, achieved similar improvement. In the ensemble approach, the inactive compounds were randomly split into six equal-sized groups, and each group formed a new training set through combining with all the active compounds. Most of the six new classifiers trained by the six new training sets offered better AUC-ROC values than the original model (0.81, 0.74, 0.78, 0.77, 0.79, and 0.78, respectively), although the new models were based on a fraction of the total training data. The consensus model achieved an AUC-ROC of 0.80, while the concordance, sensitivity, and specificity improved to 70.5%, 73.1%, and 70.2% respectively, at the optimal cutoff of 0.30. In conclusion, the results demonstrated that consensus methods, including random under-sampling and the ensemble method, constantly enhanced the model performance on learning from imbalanced CYP2D6 data sets.
Similarity-guided under-sampling was practiced on the CYP2D6 training set also. The inactive compounds with highest similarities to the test set compounds and active compounds in the training set, as measured by the 5-NN method, were selected to form new training sets with all active compounds, respectively. The first similarity-guided under-sampling model produced better predictions on the test compounds with an AUC-ROC of 0.78, while the second method significantly reduced the predictive power of the resulting classifier with an AUC-ROC of 0.66.
In SVM, only the support vectors (SVs) contribute to defining the classification boundary and other compounds can be removed safely without affecting classification. Based on this principal, downsizing the majority class can be accomplished by eliminating the non-SVs from the majority class[49]. Out of the 5121 SVs of the original CYP2D6 model, the 3178 inactive compounds were combined with all 2113 active compounds to form a new training set. The model built on the new training data increased the AUC-ROC from 0.76 to 0.79.
The consensus ensemble under-sampling strategy was also applied to CYP3A4 training data, where one third of training compounds were positive. Splitting the negatives into two and combining with all positives separately resulted in two training sets. The two rebalanced models yielded higher ROC-AUC values of 0.88 and 0.89, while the consensus model produced an AUC of 0.89.
Applicability domains (AD)
The AD is a frequent topic in the QSAR and machine learning community, because the concept is closely related to many important practical issues of QSAR modeling, such as assessment of quality and predictability of a model, confidence level of a prediction, etc.[50]. Although different measures have been used to quantify the AD of a model, it is largely defined in chemical descriptor space by the structural features of the compounds in the training sets, which is independent of the biological activities of these compounds[24]. In this study, a dominant portion of the training and test compounds for five different classifiers are overlapping, since the same compounds were tested against five different targets and the small variation only resulted from the inconclusive compounds excluded from the training and test sets. In addition, the molecular descriptors used to construct the five models are identical. Therefore, it is reasonable to expect that the ADs of the five CYP models would be greatly overlapping, if not identical, and similarly, the DM of the testing compounds should also lie in the same ranges. However, the performances of the five classifiers fell into two groups – the models for CYP1A2, CYP2C9, and CYP3A4 demonstrated higher predictive power when applied to the test sets, while the classifiers of CYP2C19 and CYP2D6 only offered fairly good predictions. We next explore why the five models of similar ADs behaved differently.
The overall similarity between the training and test sets compounds were found to be very low in this study. The averaged Tanimoto similarities are 0.47 and 0.29 using FCFP_4 and ECFP_6 fingerprints and 0.28 using the Cosine similarity of the same atom typing descriptors for model construction. The blue bars in Figure 3 display the distributions of compound numbers falling into the five bins of 5-NN similarities of the CYP3A4 testing compounds, computed by using two different metrics. In both cases, the distributions are nearly normal. The low similarity level is due to the fact that the majority of the training data are drug-like compounds, while the test set compounds are mostly environmental chemicals (i.e., non-drug-like molecules). If pairs of molecules with Tanimoto coefficients (ECFP_6) lower than 0.4 are considered dissimilar to each other, then, as high as 70% of the CYP3A4 test compounds would fall outside of the AD of the model. However, the results presented in Table 1 obviously contradict the common understanding that a QSAR model should only be used to make predictions within its AD by interpolation not extrapolation[51]. Fragment analysis of the training and test sets of the compounds using LeadScope (Columbus, OH) led to the same conclusion. For example, there were 19 compounds in the CYP3A4 testing set carrying acidic halogen groups, which are chemically reactive, but none was found in the training set. In other words, the chemical space of the test set was more diverse than that of the training set in certain domains, thus the classifier was trained with incomplete learning materials. The lack of similarity and incomplete learning materials, however, did not seem to prevent some classifiers from making accurate predictions.
Figure 3.

The 5-NN similarity distributions of CYP3A4 test compounds (gray bars) and the percentages of correctly predicted compounds (black lines) binned into the ranges of the averaged 5NN similarities. (A) Tanimoto similarities using ECFP_4 and (B) Cosine similarities using atom typing descriptors.
If the evidence of the overall similarity is not sufficient, the correlation between the predictive performances of individual test set compounds and their k-NN similarities to the training compounds lends further support to our argument. Using the CYP3A4 consensus model as an example, the red lines in Figure 3 illustrate the averaged accuracies of the compounds grouped according to their 5NN similarities to the training compounds. First, the variation is limited across the different similarity levels, varying from 79% to 85% for Tanimoto similarity and 75% to 85% for Cosine similarity; second, there were no clear trends observed between the model performances and the levels of the similarities, no matter which metric was used. The general conclusion that similarity to molecules in the training set is a good predictor for accuracy of a prediction was summarized and validated largely on small datasets with one or a few chemotypes[21, 25]; while whether the same conclusion can be drawn from large and diverse training sets remains unknown. The evidences presented here suggested that AD was not an absolute indicator for the confidence of a prediction, especially for models built on highly diverse compounds like in this study.
Comparison with other molecular descriptors
A parallel model construction was carried out for the same data sets using the extended connectivity fingerprints (ECFP_6) and MOE (Molecular Operating Environment, CCG, Montreal, Canada) 2D descriptors as molecular descriptors. Both ECFP_6 and MOE 2D descriptors suffered from a significant drop in predictive performances on predicting the test set compounds of CYP1A2 (Table 5). The models built on the MOE 2D descriptors demonstrated lower tolerance to experimental errors in CYP2C9 and imbalanced data in CYP2D6. The rank ordering of the three different molecular descriptor systems is: atom type > ECFP_6 > MOE 2D, judged by the overall predictive performance of the five CYP models. One possible explanation on the atom type descriptors outperforming the other two descriptors is that the atom type descriptors decompose a molecule to atoms, thus improving the coverage of the chemical space or AD. On the other hand, MOE 2D descriptors contain largely whole molecule properties, which limited their extrapolation power. The differences between the training and test set compounds are larger at the whole molecule level, e.g., the average molecular weights for training and testing compounds are 350 and 150, respectively. Furthermore, atom type based molecular descriptors grant the highest model interpretability, while the ECFP_6 the least [41].
Table 5.
Comparison of CYP models constructed from atom types and other descriptors.
| AUC-ROC | CYP Isozymes | ||||
|---|---|---|---|---|---|
| 1A2 | 2C19 | 2C9 | 2D6 | 3A4 | |
| Atom Types | 0.82 | 0.76 | 0.84 | 0.76 | 0.84 |
| ECFP_6 | 0.75 | 0.72 | 0.84 | 0.74 | 0.84 |
| MOE 2D | 0.68 | 0.76 | 0.74 | 0.65 | 0.83 |
Abbreviations: AUC-ROC = area under the receiver operator characteristic curves.
Summary
The five SVM models built from a large dataset containing over 15,000 drug-like compounds were applied to predict the CYP profiles of the non-drug-like Tox21 compounds. Given the low overall similarity between the training and test set compounds and the variations of predictive power among the individual models, the concept of the AD was examined. The results from this study provide evidence to the argument that AD is not a universal rule to guide the estimation of the accuracy of a prediction. Sharing a common AD, three out of five CYP classifiers achieved satisfactory predictions against the test compounds with AUC-ROC values between 0.82 and 0.84. The lower predictive performance of the CYP2C19 model was largely attributed to experimental errors, as indicated by the larger fraction of inconclusive compounds, larger variations in the active compound rates in the training and test sets, and lower reproducibility of duplicated compounds. Imbalanced data sets were believed the major cause of the lower performance of the CYP2D6 model. A variety of rebalancing strategies were applied to the CYP2D6 dataset, among which the consensus of the random under-sampling and ensemble method outperformed other methods, including cost sensitive learning (SVM-WEIGHT) and over-sampling. The results presented here not only validated the robustness of the five SVM models developed for the five major CYP isozymes, but also call for a reexamination by the modeling community of the concept of AD as well as the different re-balancing strategies for learning from imbalanced data sets. The CYP data generated on the Tox21 Phase I compound library will also be useful for expanding our knowledge on the ability of environmental compounds to alter in humans the metabolism of endogenous compounds as well as xenobiotics such as drugs.
Acknowledgements
This work was supported by the Intramural Research Programs (Interagency agreement #Y2-ES-7020-01) of the National Toxicology Program, National Institute of Environmental Health Sciences (NIEHS), and the National Center for Advancing Translational Sciences (NCATS), National Institutes of Health (NIH). The statements, opinions, or conclusions contained therein do not necessarily represent the statements, opinions or conclusions of NIEHS, NCATS, NIH, or the United States government.
Footnotes
Competing Financial Interests Declaration: None of the authors have a competing financial interest.
References
- [1].Evans WE, Relling MV. Science. 1999;286(5439):487–491. doi: 10.1126/science.286.5439.487. [DOI] [PubMed] [Google Scholar]
- [2].Brown CM, Reisfeld B, Mayeno AN. Drug Metab Rev. 2008;40(1):1–100. doi: 10.1080/03602530802309742. [DOI] [PubMed] [Google Scholar]
- [3].Denisov IG, Makris TM, Sligar SG, Schlichting I. Chem Rev. 2005;105(6):2253–2277. doi: 10.1021/cr0307143. [DOI] [PubMed] [Google Scholar]
- [4].Guengerich FP, Wu ZL, Bartleson CJ. Biochem Biophys Res Commun. 2005;338(1):465–469. doi: 10.1016/j.bbrc.2005.08.079. [DOI] [PubMed] [Google Scholar]
- [5].Guengerich FP. Chem Res Toxicol. 2008;21(1):70–83. doi: 10.1021/tx700079z. [DOI] [PubMed] [Google Scholar]
- [6].Liu YT, Hao HP, Liu CX, Wang GJ, Xie HG. Drug Metab Rev. 2007;39(4):699–721. doi: 10.1080/03602530701690374. [DOI] [PubMed] [Google Scholar]
- [7].Pelkonen O, Turpeinen M, Hakkola J, Honkakoski P, Hukkanen J, Raunio H. Arch Toxicol. 2008;82(10):667–715. doi: 10.1007/s00204-008-0332-8. [DOI] [PubMed] [Google Scholar]
- [8].Rendic S. Drug Metab Rev. 2002;34(1–2):83–448. doi: 10.1081/dmr-120001392. [DOI] [PubMed] [Google Scholar]
- [9].Rendic S, Sunjic V, Toso R, Kajfez F, Ruf HH. Xenobiotica. 1979;9(9):555–564. doi: 10.3109/00498257909042321. [DOI] [PubMed] [Google Scholar]
- [10].Puurunen J, Pelkonen O. Eur J Pharmacol. 1979;55(3):335–336. doi: 10.1016/0014-2999(79)90205-x. [DOI] [PubMed] [Google Scholar]
- [11].Sansen S, Yano JK, Reynald RL, Schoch GA, Griffin KJ, Stout CD, Johnson EF. J Biol Chem. 2007;282(19):14348–14355. doi: 10.1074/jbc.M611692200. [DOI] [PubMed] [Google Scholar]
- [12].Rowland P, Blaney FE, Smyth MG, Jones JJ, Leydon VR, Oxbrow AK, Lewis CJ, Tennant MG, Modi S, Eggleston DS, Chenery RJ, Bridges AM. J Biol Chem. 2006;281(11):7614–7622. doi: 10.1074/jbc.M511232200. [DOI] [PubMed] [Google Scholar]
- [13].Williams PA, Cosme J, Vinkovic DM, Ward A, Angove HC, Day PJ, Vonrhein C, Tickle IJ, Jhoti H. Science. 2004;305(5684):683–686. doi: 10.1126/science.1099736. [DOI] [PubMed] [Google Scholar]
- [14].Williams PA, Cosme J, Ward A, Angove HC, Matak Vinkovic D, Jhoti H. Nature. 2003;424(6947):464–468. doi: 10.1038/nature01862. [DOI] [PubMed] [Google Scholar]
- [15].Roy K, Roy PP. Expert Opin Drug Metab Toxicol. 2009;5(10):1245–1266. doi: 10.1517/17425250903158940. [DOI] [PubMed] [Google Scholar]
- [16].Fox T, Kriegl JM. Curr Top Med Chem. 2006;6(15):1579–1591. doi: 10.2174/156802606778108915. [DOI] [PubMed] [Google Scholar]
- [17].Wolf CR, Smith G, Smith RL. BMJ. 2000;320(7240):987–990. doi: 10.1136/bmj.320.7240.987. [DOI] [PMC free article] [PubMed] [Google Scholar]
- [18].Veith H, Southall N, Huang R, James T, Fayne D, Artemenko N, Shen M, Inglese J, Austin CP, Lloyd DG, Auld DS. Nat Biotechnol. 2009;27(11):1050–1055. doi: 10.1038/nbt.1581. [DOI] [PMC free article] [PubMed] [Google Scholar]
- [19].Kavlock RJ, Austin CP, Tice RR. Risk Anal. 2009;29(4):485–487. doi: 10.1111/j.1539-6924.2008.01168.x. discussion 492–487. [DOI] [PMC free article] [PubMed] [Google Scholar]
- [20].Tice RR, Austin CP, Kavlock R, Bucher JR. Submitted for publication. 2012 [Google Scholar]
- [21].Sheridan RP, Feuston BP, Maiorov VN, Kearsley SK. J Chem Inf Comput Sci. 2004;44(6):1912–1928. doi: 10.1021/ci049782w. [DOI] [PubMed] [Google Scholar]
- [22].Tetko IV, Sushko I, Pandey AK, Zhu H, Tropsha A, Papa E, Oberg T, Todeschini R, Fourches D, Varnek A. J Chem Inf Model. 2008;48(9):1733–1746. doi: 10.1021/ci800151m. [DOI] [PubMed] [Google Scholar]
- [23].Stanforth RW, Kolossov E, Mirkin B. QSAR Comb. Sci. 2007;26(7):837–844. [Google Scholar]
- [24].Jaworska J, Nikolova-Jeliazkova N, Aldenberg T. Altern Lab Anim. 2005;33(5):445–459. doi: 10.1177/026119290503300508. [DOI] [PubMed] [Google Scholar]
- [25].Weaver S, Gleeson MP. J Mol Graph Model. 2008;26(8):1315–1326. doi: 10.1016/j.jmgm.2008.01.002. [DOI] [PubMed] [Google Scholar]
- [26].Zheng W, Tropsha A. J Chem Inf Comput Sci. 2000;40(1):185–194. doi: 10.1021/ci980033m. [DOI] [PubMed] [Google Scholar]
- [27].Japkowicz N, Stephen S. Intelligent Data Analysis. 2002;6(5):203–231. [Google Scholar]
- [28].Chawla NV, Japkowicz N, Kotcz A. ACM SIGKDD Explorations Newsletter. 2004;6(1):1–6. [Google Scholar]
- [29].Drummond C, Holte R. C4.5, class imbalance, and cost sensitivity: Why under-sampling beats over-sampling. Proceedings of the ICML'03 Workshops on Learning from Imbalanced Data Sets.2003. [Google Scholar]
- [30].Estabrooks A, Jo T, Japkowicz N. Computational Intelligence. 2004;20(1):18–36. [Google Scholar]
- [31].Batista GEAPA, Prati RC, Monard MC. ACM SIGKDD Explorations Newsletter. 2004;6(1):20–29. [Google Scholar]
- [32].Xia M, Huang R, Witt KL, Southall N, Fostel J, Cho MH, Jadhav A, Smith CS, Inglese J, Portier CJ, Tice RR, Austin CP. Environ Health Perspect. 2008;116(3):284–291. doi: 10.1289/ehp.10727. [DOI] [PMC free article] [PubMed] [Google Scholar]
- [33].Huang R, Southall N, Xia M, Cho MH, Jadhav A, Nguyen DT, Inglese J, Tice RR, Austin CP. Toxicol Sci. 2009;112(2):385–393. doi: 10.1093/toxsci/kfp231. [DOI] [PMC free article] [PubMed] [Google Scholar]
- [34].Judson R, Richard A, Dix DJ, Houck K, Martin M, Kavlock R, Dellarco V, Henry T, Holderman T, Sayre P, Tan S, Carpenter T, Smith E. Environ Health Perspect. 2009;117(5):685–695. doi: 10.1289/ehp.0800168. [DOI] [PMC free article] [PubMed] [Google Scholar]
- [35].Huang R. Tox21 Phase I compound information and supplementary data. 2010;Vol. 2011 [Google Scholar]
- [36].PubChem, NTP compound collection. 2007;Vol. 2011 [Google Scholar]
- [37].PubChem, Tox21 Phase I compound collection. 2009;Vol. 2011 [Google Scholar]
- [38].Cali JJ, Ma D, Sobol M, Simpson DJ, Frackman S, Good TD, Daily WJ, Liu D. Expert Opin Drug Metab Toxicol. 2006;2(4):629–645. doi: 10.1517/17425255.2.4.629. [DOI] [PubMed] [Google Scholar]
- [39].Inglese J, Auld DS, Jadhav A, Johnson RL, Simeonov A, Yasgar A, Zheng W, Austin CP. Proc Natl Acad Sci U S A. 2006;103(31):11473–11478. doi: 10.1073/pnas.0604348103. [DOI] [PMC free article] [PubMed] [Google Scholar]
- [40].Sun H. J Chem Inf Comput Sci. 2004;44(2):748–757. doi: 10.1021/ci030304f. [DOI] [PubMed] [Google Scholar]
- [41].Sun H, Veith H, Xia M, Austin CP, Huang R. J Chem Inf Model. 2011;51(10):2474–2481. doi: 10.1021/ci200311w. [DOI] [PMC free article] [PubMed] [Google Scholar]
- [42].Noble WS. Nat Biotechnol. 2006;24(12):1565–1567. doi: 10.1038/nbt1206-1565. [DOI] [PubMed] [Google Scholar]
- [43].Cortes C, Vapnik V. Machine Learning. 1995;20:273–297. [Google Scholar]
- [44].Cristianini N, Shawe-Taylor J. An Introduction to Support Vector Machines. Cambridge University Press; Cambridge: 2005. [Google Scholar]
- [45].Chang C-C, Lin C-J. LIBSVM : a library for support vector machines. 2001 [Google Scholar]
- [46].Fawcett T. Pattern Recognition Letters. 2006;27:861–874. [Google Scholar]
- [47].Westin LK. Receiver Operating Characteristic (ROC) analysis, in UMINF report. Umea University; 2001. [Google Scholar]
- [48].Akbani R, Kwek S, Japkowicz N. Applying support vector machines to imbalanced datasets. Proc. of the 15th European Conference on Machine Learning (ECML 2004).2004. pp. 39–50. [Google Scholar]
- [49].Tang Y, Zhang Y-Q, Chawla NV, Krasser S. J Latex Class Files. 2002;1(11):1–9. [Google Scholar]
- [50].Dragos H, Gilles M, Alexandre V. J Chem Inf Model. 2009;49(7):1762–1776. doi: 10.1021/ci9000579. [DOI] [PubMed] [Google Scholar]
- [51].Jaworska JS, Comber M, Auer C, Van Leeuwen CJ. Environ Health Perspect. 2003;111(10):1358–1360. doi: 10.1289/ehp.5757. [DOI] [PMC free article] [PubMed] [Google Scholar]