

Abstract
In vivo molecular imaging holds promise for understanding the underlying mechanisms of health, injury, aging, and disease, as it can detect distinct biochemical processes such as enzymatic activity, reactive small-molecule fluxes, or post-translational modifications. Current imaging techniques often detect only a single biochemical process, but, within whole organisms, multiple types of biochemical events contribute to physiological and pathological phenotypes. In this report, we present a general strategy for dual-analyte detection in living animals that employs in situ formation of firefly luciferin from two complementary caged precursors that can be unmasked by different biochemical processes. To establish this approach, we have developed Peroxy Caged Luciferin-2 (PCL-2), a H2O2-responsive boronic acid probe that releases 6-hydroxy-2-cyanobenzothiazole (HCBT) upon reacting with this reactive oxygen species (ROS), as well as a peptide-based probe, Ile-Glu-Thr-Asp-D-Cys (IETDC) which releases D-cysteine in the presence of active caspase 8. Once released, HCBT and D-cysteine form firefly luciferin in situ, giving rise to a bioluminescent signal if and only if both chemical triggers proceed. This system thus constitutes an AND-type molecular logic gate that reports on the simultaneous presence of H2O2 and caspase 8 activity. Using these probes, chemoselective imaging of either H2O2 or caspase 8 activity was performed in vitro and in vivo. Moreover, concomitant use of PCL-2 and IETDC in vivo establishes a concurrent increase in both H2O2 and caspase 8 activity during acute inflammation in living mice. Taken together, this method offers a potentially powerful new chemical tool for studying simultaneous oxidative stress and inflammation processes in living animals during injury, aging, and disease, as well as a versatile approach for concurrent monitoring of multiple analytes using luciferin-based bioluminescence imaging technologies.
INTRODUCTION
Molecular imaging is an emerging field at the interface of chemistry and biology that promises to illuminate the mechanism of a variety of diseases, including cancer, cardiovascular disorders, diabetes, and Alzheimer’s and related neurodegenerative diseases.1–7 In this context, firefly luciferin bioluminescence imaging, in which light is produced by a firefly luciferase-catalyzed reaction, is an attractive modality, particularly for in vivo preclinical applications, owing to its red-shifted emission for good tissue penetration, biological compatibility, and low background signal.8–11 Indeed, many innovative molecular probes have been reported that utilize caged luciferin derivatives to detect a single specific type of biological process, ranging from enzymatic activity,12–24 to reactive small-molecule fluxes,25 and post-translational modifications,26 with applications that span from high-throughput assays to live-cell and live-animal imaging. In addition, elegantly engineered luciferin substrates and luciferase enzymes for potential multicolor applications have been presented27–39 and recently reviewed.40 Our laboratories have contributed to this growing literature by developing Peroxy Caged Luciferin-1 (PCL-1), a boronate-caged luciferin that can be used for chemoselective bioluminescence imaging of hydrogen peroxide (H2O2) fluxes in living animals, which we utilized to image elevations in the levels of this reactive oxygen species (ROS) in a murine model of prostate cancer.25
In addition to changes in ROS, the vast majority of injury, aging, and disease states have complex alterations in a combination of biological processes. Thus, we sought to expand the utility of bioluminescence imaging by using firefly luciferin to simultaneously monitor multiple biochemical events in living animals. In this report, we present a general strategy to visualize two different biochemical processes in vivo via selective unmasking of a pair of complementary luciferin precursors, which leads to in situ luciferin formation if and only if both biochemical processes proceed. This dual-analyte imaging system relies on a condensation reaction between a cyanobenzothiazole and cysteine to form luciferin, and in this context we note related elegant studies that exploit this ligation for biomolecule labeling purposes.41–44 When applied to dual-analyte imaging, the cyanobenzothiazole/cysteine condensation reaction provides an AND-type molecular logic-gate, and we apply it herein to the concurrent and selective detection of H2O2 and caspase 8 activity, two major contributors to oxidative stress and cell death in injury and disease.45–54 Peroxy Caged Luciferin-2 (PCL-2) is a boronate-caged probe that generates 6-hydroxy-2-cyanobenzothiazole (HBCT) upon reaction with H2O2, and the pentapeptide probe Ile-Glu-Thr-Asp-D-Cys (IETDC) produces D-Cys upon caspase 8 cleavage (Figure 1). Application of either probe in conjunction with the complementary, uncaged luciferin precursor, HCBT or D-Cys, can be utilized to selectively monitor H2O2 or caspase 8 activity individually, and elevations in both H2O2 and caspase 8 activity lead to increased in situ luciferin formation and bioluminescent signal when both probes are used in tandem. We demonstrate that these probes are capable of selectively monitoring H2O2 and/or caspase 8 activity in aqueous solution as well as in living cells and animals. Finally, we have applied this dual-analyte imaging strategy to simultaneously monitor changes in both H2O2 production and caspase 8 activity in a murine model of acute inflammation. This work establishes a logic-gated molecular imaging platform for dual monitoring of ROS and caspase activity in stages of injury, aging, and disease that is complementary to multi-color imaging of independent processes, but avoids the difficulties of spectral unmixing. This work also provides a starting point for a potentially diverse array of bioluminescent probes for in vivo multi-analyte imaging through caging of complementary luciferin precursors. Specifically, other functional groups present on the HCBT and D-cysteine luciferin precursors could be masked, resulting in a multi-analyte luciferin imaging strategy in which two or more analytes can be detected simultaneously in the same animal at the same time, providing an alternative to serial measurements of single analytes in either the same animal at different times or two different animals in tandem.
Figure 1.

Design strategy for simultaneous detection of H2O2 and caspase 8 activity through release of HCBT and D-cysteine and in situ formation of firefly luciferin.
RESULTS AND DISCUSSION
Design and Synthesis of Peroxy Caged Luciferin-2 (PCL-2) and IETD-D-Cysteine (IETDC) Probes for Dual-Analyte Luciferin Imaging
The use of firefly bioluminescence for in vivo optical imaging of gene expression, tumor growth, and more recently, for functional detection of enzymatic activity, small-molecule fluxes, and post-translational modifications, has been widely adopted owing to its biological compatibility, red-shifted emission, and high signal-to-noise ratio. Our design strategy for dual-analyte detection using luciferin bioluminescence relies on these aforementioned attractive characteristics, as well as in situ luciferin formation via a facile cyclization reaction between HCBT and D-cysteine (Figure 1). This reaction occurs quickly in aqueous solution and may be involved in luciferin biosynthesis, 55–57 making it ideal for use in complex biological environments, as demonstrated by use of this condensation reaction for biomolecule labeling.41–44 Furthermore, in situ luciferin formation affords the opportunity to create an AND-type molecular logic gate through the development of a pair of distinct yet complementary probes, one using a masked HCBT scaffold and one using a masked D-cysteine precursor, to detect two different types of biological analytes in an orthogonal fashion. Indeed, in situ luciferin formation and concomitant production of bioluminescent signal occurs only if both HCBT as well as the D-cysteine are released from their respective cages, while unmasking of either HCBT or D-cysteine alone does not generate appreciable amounts of free luciferin (Figure 1). To illustrate this concept, we sought to apply this dual-analyte detection system to the visualization of specific biological processes, ROS production and caspase activity, in acute inflammation. Thus, we developed one probe for detection of H2O2, which is involved in early and late inflammatory response to external stress and pathogens,58–64 and a second probe for caspase 8 detection, owing to its pivotal role in initiation of the apoptotic pathway during inflammatory cascades.46,65,66
In designing a luciferin precursor probe for H2O2, we utilized a general reaction-based method exploited by our lab25,67–78 and others79–86 for chemoselective H2O2 detection, namely the H2O2-triggered oxidation of boronates to phenols. To this end, attachment of an aryl boronic acid cage to the phenolic position of HCBT through a self-immolative linker affords PCL-2 (1, Scheme 1). For detection of caspase 8, we were inspired by previous reports of caspase 8 detection and inhibition, which rely on the enzymatic cleavage of a short peptide, IETD, to release a fluorescent molecule or inhibit the enzyme.87–91 For our purposes, we sought to unmask D-cysteine, which can react with the HCBT released from PCL-2 to form luciferin in situ. As such, we prepared a peptide probe, Ile-Glu-Thr-Asp-D-Cys (IETDC, Figure 1) containing either free carboxylic acids on the glutamate and aspartate residues for in vitro studies or esterase-cleavable methyl ester groups for in vivo studies. In a broader sense, we highlight that the synthesis of both types of luciferin precursor probe is accessible and versatile, particularly with regard to peptide-based probes. We envision that masking HBCT or its amino derivative, as well as D-cysteine and related precursors at the amino, sulfhydryl, or carboxylate positions, offers ample opportunities to prepare and mix-and-match a diverse array of potential probes for multianalyte detection.
Scheme 1.

Synthesis of Peroxy Caged Luciferin-2 (PCL-2).
Characterization of In Situ Luciferin Formation
To determine the utility of the in situ luciferin formation approach for dual-analyte imaging we compared signals from HCBT/D-cysteine to luciferin, determined the effect of endogenous L-cysteine, and analyzed the lifetime of the complementary HCBT and D-cysteine partner molecules in cells. We first completed an in vitro test comparing the bioluminescent signal produced by luciferin to that produced by a mixture of HCBT and D-cysteine (Figure 2a,b). A linear regression analysis of the data indicates a linear fit (R2 = 0.9864) for luciferin, while HCBT/D-cysteine has an exponential fit (R2 = 0.9889), which is indicative of the second-order reaction between HCBT and D-cysteine for luciferin formation. Using the luciferin standard curve (Figure 2a), we determined that 25 μM HCBT/D-cysteine produces ca. 6.7 μM luciferin, a 27% yield, in vitro. Subsequent determination of in situ luciferin formation in PC3M-luc cells indicates that at lower concentrations exogenous luciferin produces a greater signal than HCBT/D-cysteine (Figure 2e,f). However, at higher concentrations, HCBT/D-cysteine produces a greater signal than luciferin. As HCBT and D-cysteine are not able to produce more luciferin, and thus bioluminescent signal, than equivalent concentrations of luciferin, we sought to determine whether the greater HCBT/D-cysteine signal was due to differences in cell-membrane permeability. Indeed, when the same comparison of HCBT/D-cysteine and luciferin is completed following cell lysis (Figure S1), the signal from HCBT/D-cysteine approaches, but does not surpass, the luciferin signal at high concentrations, indicating that the greater signal from HCBT/D-cysteine detected within intact, living cells is due to an increased permeability of HCBT and D-cysteine across the cell membrane compared to the full luciferin substrate. A final experiment comparing HCBT/D-cysteine in FVB-luc+ mice,92 which ubiquitously express firefly luciferase, indicates that 0.05 μmol luciferin produces a ca. 40-fold brighter signal than 0.05 μmol HCBT/D-cysteine, however, a 10-fold increase in HCBT/D-cysteine results in a bioluminescent signal that is equivalent to the 0.05 μmol luciferin signal.
Figure 2. Comparison of HCBT/D-cysteine and luciferin.

(a) Total bioluminescent signal, integrated over 45 min, from luciferin (0.5–10 μM). (b) Total bioluminescent signal, integrated over 45 min, from HCBT and D-cysteine (5–25 μM, each) following incubation for 1 h in Tris buffer (50 mM, pH 7.4). To measure luciferin formation in a and b, 100 μg/mL luciferase in 50 mM Tris buffer with 10 mM MgCl2, 0.1 mM ZnCl2, and 2 mM ATP (pH 7.4) was added to the luciferin and HCBT/D-cysteine solutions. (c) Line graph representation of a, which indicates a linear increase (R2 = 0.9864) in bioluminescent signal from luciferin (0.5–10 μM). (d) Line graph representation of b, which indicates an exponential increase (R2 = 0.9889) in bioluminescent signal from HCBT and D-cysteine (2.5–25 μM, each). (e) Total photon flux, integrated over 2 h, from PC3M-luc cells with HCBT and D-cysteine (0–500 μM, dark grey bars) or luciferin (0–500 μM, light grey bars) in HBSS (25 mM glucose). (f) Representative image of PC3M-luc cells with HCBT and D-cysteine or luciferin, log scale. (g) Total photon flux, 0–60 min post-injection, for mice injected with HCBT and D-cysteine (0.05 or 0.5 μM, each) or luciferin (0.05 μM). (h) Representative image (30 min post-injection) of mice injected with HCBT and D-cysteine or luciferin, log scale. Error bars are ±SEM; E: n = 3, G: n = 3–4.
Next, we determined the effect of endogenous L-cysteine on the signal from HCBT, as previous work documents that firefly luciferase can convert non-luminescent L-luciferin to luminescent D-luciferin.57 Initial experiments in PC3M-luc cells indicate a negligible production of bioluminescence from HCBT and endogenous L-cysteine compared to the signal obtained from mixing HCBT and D-cysteine (Figure 3a,b). Analogous studies in FVB-luc+ mice give the same result, as the bioluminescent signal from the condensation of HCBT and endogenous L-cysteine is negligible compared to the signal produced when D-cysteine is present (Figure 3c,d).
Figure 3. Determination of bioluminescent signal from endogenous L-cysteine.

(a) Total photon flux, integrated over 2 h, from PC3M-luc cells with HCBT (0–50 μM) in the presence (solid line, y1 axis) or absence (dashed line, y2 axis) of D-cysteine (0–50 μM) in HBSS (25 mM glucose). (b) Representative image of PC3M-luc cells with HCBT ± D-cysteine, log scale. (c) Total photon flux, 0–60 min post-injection, for mice injected with D-cysteine (0.05 μmol in 20 μL PBS) or vehicle (20 μL PBS) and HCBT (0.05 μM in50 μL 1:1 DMSO:PBS). (d) Representative image (30 min post-injection) of mice injected with HCBT ± D-cysteine. Error bars are ±SEM; A: n = 3, C: n = 3–4.
Finally, to determine the length of time that released HCBT and D-cysteine are available for reaction with their complementary luciferin-forming reagent, cellular lifetime experiments were completed. Specifically, PC3M-luc cells were first incubated with HCBT or D-cysteine for 30 min, then the cells were washed, and then the complementary luciferin-forming reagent was added after 0, 15, 30, 45, or 60 min. For the HCBT lifetime studies, we observe that as the time between removal of HBCT and addition of D-cysteine increased, there was a decrease in luminescence (Figure 4a,b). This result is likely due to reactions of HCBT with intracellular nucleophiles41 that make HCBT unavailable for reaction with D-cysteine. In contrast to HCBT, D-cysteine is still fully available for reaction with HCBT even an hour after the cells have been washed (Figure 4c,d), indicating that D-cysteine has a long lifetime in cells. Notably, this feature could be exploited for studying healthy and disease states in which one analyte is produced prior to the second analyte. Taken together, these analyses illuminate the robust in situ luciferin formation of HCBT and D-cysteine, the negligible impact of endogenous L-cysteine, and the cellular availability of HCBT and D-cysteine for dual-analyte detection.
Figure 4. Lifetime of HCBT and D-cysteine in PC3M-luc cells.

(a) Total photon flux, integrated over 2 h, from PC3M-luc cells with D-cysteine (100 μM) added 0, 15, 30, 45, or 60 min after incubation with HCBT (100 μM). (b) Representative image of PC3M-luc cells with D-cysteine added 0, 15, 30, 45, or 60 min following removal of HCBT. (c) Total photon flux, integrated over 2 h, from PC3M-luc cells with HCBT (100 μM) added 0, 15, 30, 45, or 60 min after incubation with D-cysteine (100 μM). (d) Representative image of PC3M-luc cells with HCBT added 0, 15, 30, 45, or 60 min following removal of D-cysteine. Error bars are ±SEM; A and C: n = 3.
Peroxide Reactivity and Selectivity of PCL-2
With these data in hand, we proceeded to determine the ROS selectivity of PCL-2 for H2O2, the kinetics of the deprotection reaction, and the concentration dependence of the response of PCL-2 to H2O2. Reaction of PCL-2 with a panel of biologically relevant ROS for 5–60 min, followed by incubation with D-cysteine for in situ luciferin formation and addition of firefly luciferase, triggers a ca. 50-fold increase in bioluminescence in the presence of H2O2, with negligible response to other ROS (Figure 5a). Furthermore, in the presence of catalase, a selective H2O2-scavenging enzyme, the turn-on bioluminescent signal produced in the presence of H2O2 is attenuated (Figure 5a), thus verifying a robust and selective response to H2O2. In addition, when the control compound HCBT is incubated with the same panel of ROS, no bioluminescence turn-on is detected (Figure S2), confirming that the response of PCL-2 to H2O2 is dependent on reaction at the boronate switch.
Figure 5. Selective and concentration-dependent bioluminescent detection of H2O2 by PCL-2.

(a) Total bioluminescent signal, integrated over 10 min, from PCL-2 (5 μM) alone (light grey bars) or incubated with various ROS (100 μM) or H2O2 (100 μM) and catalase (0.4 mg/mL) for 5, 20, 40, or 60 min. Signals normalized to signal from PCL-2 in the absence of any ROS. (b) Total bioluminescent signal, integrated over 15 min, from 5 μM PCL-2 incubated for 1 h with increasing concentrations of H2O2 (0–100 μM). To measure HCBT release in a and b, PCL-2/ROS solutions were incubated with D-cysteine (20 μM) for 15 min, prior to addition of 100 μg/mL luciferase in 50 mM Tris buffer with 10 mM MgCl2, 0.1 mM ZnCl2, and 2 mM ATP (pH 7.4). (c) Line graph representation of b, which indicates a linear increase (R2 = 0. 9957) in bioluminescent signal from PCL-2 in the presence of H2O2 in aqueous solution. (d) Total photon flux, integrated over 2 h, from PC3M-luc cells with PCL-2 (25 μM), D-cysteine (25 μM), and H2O2 (0–100 μM) in DMEM. (e) Line graph representation of d, which indicates a linear increase (R2 = 0.9993) in bioluminescent signal from PCL-2 in the presence of H2O2 in PC3M-luc cells. (f) Representative image of PC3M-luc cells with PCL-2, D-cysteine, and H2O2 in DMEM, log scale. Statistical analyses were performed with a two-tailed Student’s t-test. *P < 0.01 (D and E: n = 6) and error bars are ±SEM.
Next, we analyzed the kinetics and dose-dependence of the PCL-2 and H2O2 reaction. A comparison of the measured second-order rate constant (k = 2.7 M−1s−1, Figure S3) for the PCL-2 and H2O2 reaction to the catalytic constant (kcat = 1.6 s−1) for firefly luciferase29 indicates that release of HCBT from PCL-2 is rate-limiting at the μM concentrations used in our studies. The dose-dependence of the response of PCL-2 to H2O2 was then determined via incubation of PCL-2 with various concentrations of H2O2 (0–100 μM) for 60 min, prior to incubation with D-cysteine and addition of firefly luciferase. As shown in Figures 5b and c, PCL-2 shows a linear response (R2 = 0.9957) to H2O2 over two orders of magnitude, from 1–100 μM H2O2. Furthermore, this same response is found in cellulo when PCL-2 (25 μM), D-cysteine (25 μM), and H2O2 (0–100 μM) are added to PC3M-luc cells stably transfected with firefly luciferase. Determination of the resultant bioluminescent signal with a sensitive charge coupled device (CCD) camera again indicates a linear response (R2 = 0.9993) to H2O2 over two orders of magnitude, from 0–100 μM H2O2 (Figure 5d–f). Taken together, the selective response of PCL-2 to H2O2, as well as its dose-dependent turn-on, low micromolar detection limit, and ability to form luciferin in situ show that PCL-2 possesses the requisite features for useful in vivo detection of alterations in H2O2 levels in living organisms.
Selective Cleavage of IETDC by Caspase 8
After determining the selectivity and sensitivity of PCL-2 for turn-on bioluminescent H2O2 detection, we evaluated the ability of caspase 8 to cleave IETDC and release D-cysteine for in situ luciferin formation. This goal was accomplished via incubation of IETDC with caspase 8 for 60 min in the presence of HCBT. After subsequent addition of firefly luciferase, the bioluminescent signal was determined, indicating a ca. 27–fold turn-on response (Figure 6). More importantly, addition of a broad-spectrum caspase inhibitor, Q-VD-OPh,93,94 shows complete attenuation of the response of IETDC to caspase 8, and incubation with other caspase enzyme isoforms that are important for the inflammatory caspase cascade, caspase 3 and caspase 9,46 do not give rise to a turn-on bioluminescent response for the peptide probe (Figure 6). These latter control experiments verify the chemoselectivity of the IETDC probe for caspase 8 detection. Finally, incubation of D-cysteine with these caspase enzymes causes no change in bioluminescent signal (Figure S4), further indicating that the response seen with the IETDC luciferin precursor probe is caspase 8-dependent.
Figure 6. Selective and sensitive bioluminescent detection of Caspase 8 activity by IETDC.
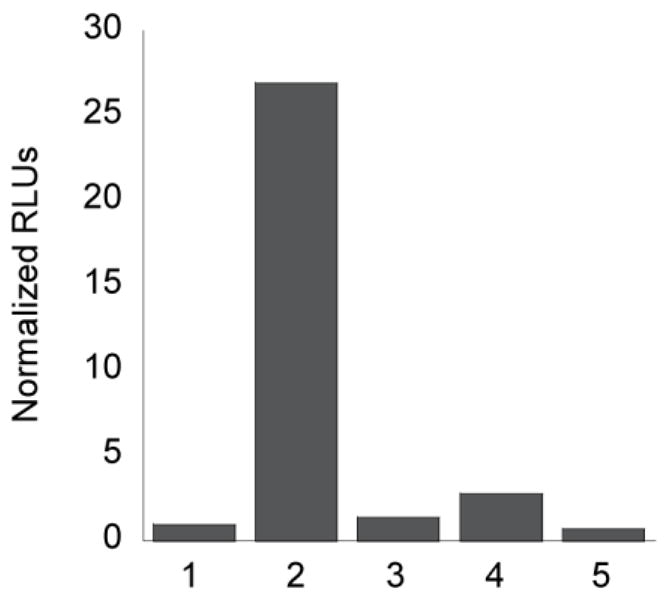
(a) Total bioluminescent signal, integrated over 10 min, from IETDC (5 μM) and HCBT (5 μM) alone or incubated with various caspase enzymes (3 and 8: 1 unit; 9: 0.001 unit) or caspase 8 and Q-VD-OPh (10 μM) for 60 min. From left to right, 1: IETDC and HCBT; 2: IETDC, HCBT, and caspase 8; 3: IETDC, HCBT, caspase 8, and Q-VD-OPh; 4: IETDC, HCBT, and caspase 3; 5: IETDC, HCBT, and caspase 9. Signals normalized to signal from IETDC and HCBT in the absence of the caspase enzymes. To quantify luciferin formation, 100 μg/mL luciferase in 50 mM Tris buffer with 10 mM MgCl2, 0.1 mM ZnCl2, and 2 mM ATP (pH 7.4) was added to 100 μL of each IETDC/HCBT solution.
Dual Detection of H2O2 and Caspase 8 Activity via In Situ Luciferin Formation
To establish the ability of our probes for dual imaging of H2O2 and caspase 8 activity, we incubated PCL-2 with H2O2, followed by addition of caspase 8 and IETDC. The resultant bioluminescent signal indicates that in the presence of these two analytes, both probes are deprotected, and luciferin is readily formed to produce a ca. 18-fold increase in bioluminescent signal (Figure 7). Notably, addition of a single analyte, either H2O2 or caspase 8, results in little to no increase in bioluminescent signal, verifying that the system acts as an AND-type molecular logic gate by requiring the presence of both analytes for bioluminescent signal production. Moreover, treatment with either a H2O2 scavenger, catalase, or a caspase inhibitor, Q-VD-OPh, attenuates the increase in signal observed in the presence of H2O2 and caspase 8, further demonstrating that both probes must be uncaged for luciferin formation and bioluminescent signal production (Figure 7). As expected, treatment with both inhibitors causes a complete attenuation of signal, providing additional validation for the use of PCL-2 and IETDC for dual-analyte detection. Finally, several additional sets of control experiments were performed before moving on to in vivo imaging experiments. First, in contrast to the turn-on response of the dual-probe system in the presence of both H2O2 and caspase 8, incubation of HCBT and D-cysteine with H2O2 and caspase 8 causes no alteration of the bioluminescent signal (Figure S5). Also, addition of catalase and Q-VD-OPh does not interfere with in situ luciferin formation or the resultant bioluminescent signal (Figure S5). Taken together, the tandem use of PCL-2 and IETDC for dual-analyte imaging in vitro highlights this unique method for detection of two different analytes through production of a single bioluminescent signal.
Figure 7. Dual detection of H2O2 and Caspase 8 via in situ luciferin formation.
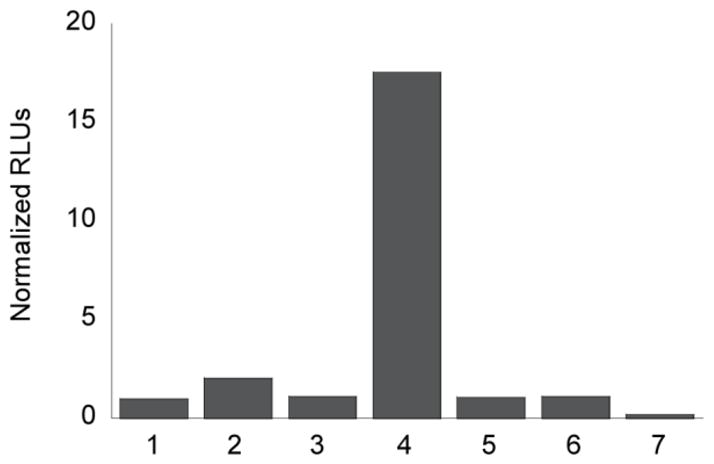
Total bioluminescent signal, integrated over 10 min, from PCL-2 (10 μM) and IETDC (10 μM) alone or incubated with H2O2 (250 μM) and caspase 8 (1 unit) in the presence or absence of catalase (1 unit) and/or Q-VD-OPh (10 μM). From left to right, 1: PCL-2 and IETDC; 2: PCL-2, IETDC, and H2O2; 3: PCL-2, IETDC, and caspase 8; 4: PCL-2, IETDC, H2O2, and caspase 8; 5: PCL-2, IETDC, H2O2, caspase 8, and catalase; 6: PCL-2, IETDC, H2O2, caspase 8, and Q-VD-OPh; 7: PCL-2, IETDC, H2O2, caspase 8, catalase, and Q-VD-OPh. Signals normalized to signal from PCL-2 and IETDC in the absence of H2O2 and caspase 8. To quantify luciferin formation, 100 μg/mL luciferase in 50 mM Tris buffer with 10 mM MgCl2, 0.1 mM ZnCl2, and 2 mM ATP (pH 7.4) was added to the PCL-2/IETDC solutions.
Molecular Imaging of H2O2 Fluxes in Living FVB-luc+ Mice with PCL-2
Following the in vitro demonstration of the utility of PCL-2 and IETDC for dual-analyte imaging, we next sought to apply PCL-2 to molecular imaging of H2O2 fluxes in FVB-luc+ mice that ubiquitously express firefly luciferase.92 For our initial in vivo studies, several doses of H2O2 were injected into the intraperitoneal (IP) cavity of mice, along with a solution of PCL-2 and D-cysteine. The animals were then imaged using a CCD camera to detect the luciferin formed following deprotection of PCL-2 by H2O2 and in situ cyclization with D-cysteine. These imaging experiments reveal a detection limit of ca. 0.5 μmol H2O2 and a robust increase in luciferin production as a function of H2O2 dose, with a ca. 10-fold turn-on in bioluminescent signal following treatment with 4.5 μmol H2O2 (Figure 8). Comparison of PCL-2 to PCL-1 imaging under optimized imaging conditions for each probe indicates that PCL-1 has a lower detection limit for H2O2 than PCL-2 in vivo (0.037 μmol versus 0.5 μmol), while PCL-2 shows an increased fold turn-on when higher amounts of H2O2 are injected (6.4-fold with 1.5 μmol H2O2 for PCL-2 versus 3.6-fold with 2.4 μmol H2O2 for PCL-1; Table S1).
Figure 8. Bioluminescent response of PCL-2 to H2O2 in FVB-luc+ mice.

(a) Representative image (10 min post-injection) for mice injected with a mixture of PCL-2 and D-cysteine (IP, 0.05 μmol each, in 50 μL of 1:1 DMSO:PBS) immediately prior to injection of H2O2 (IP, 0, 0.5, 1.5, or 4.5 μmol, left to right, in 100 μL of PBS). (b) Total photon flux, 0–15 min post-injection, for mice injected with PCL-2 and D-cysteine ± H2O2. (c) Representative image (10 min post-injection) for mice injected with NAC (IP, 10 mg/kg in 25 μL of PBS, pH 7–8) or PBS (IP, 25 μL) two min prior to injection of a mixture of PCL-2 and D-cysteine (IP, 0.05 μmol each, in 50 μL of 1:1 DMSO:PBS) and a solution of H2O2 (IP, 1.5 μmol in 75 μL of PBS). (d) Total photon flux, 0–15 min post-injection, for mice injected with PCL-2 and H2O2 in the presence or absence of NAC. Statistical analyses were performed with a two-tailed Student’s t-test. *P < 0.05, **P < 0.01 (B: n = 4, D: n = 3) and error bars are ±SEM.
In additional experiments to further show that H2O2 is required for the turn-on bioluminescent response, a separate group of mice was treated with 1.5 μmol H2O2 in the presence or absence of N-acetyl-L-cysteine (NAC), a small-molecule H2O2 scavenger.95 In the absence of NAC, a robust bioluminescent signal is detected; however, upon NAC addition the bioluminescent signal is considerably attenuated (Figure 8), thus providing evidence that the signal increase observed with H2O2 injection is a result of reaction of the PCL-2 probe with H2O2 in vivo. Finally, additional control experiments with a solution of HCBT and D-cysteine showed no change in the luciferin bioluminescent signal upon treatment with either H2O2 or NAC (Figure S6).
In Vivo Detection of Endogenous H2O2 Fluxes and Caspase 8 Activity during Acute Inflammation
Building on the results from these in vitro and in vivo experiments, we next applied the PCL-2 and IETDC probes to the individual detection of their respective bioanalytes in a murine model of acute inflammation. As stated previously, both H2O2 and caspase 8 play important roles in the development and progression of the inflammatory response, wherein H2O2 has been found to be important for eradication of pathogens,59,60,96 as well as playing a role in cellular signaling.58,61–63 Caspase 8 is important in its own right as one of the key initiators of the apoptotic cell-death pathway that is often initiated during inflammation.46,65,66 To monitor these two analytes individually, an acute inflammatory response was induced via injection of mice with lipopolysaccharides (LPS), a lipoglycan found on the surface of pathogenic bacteria that causes an inflammatory response in vivo.97–100
For H2O2 detection during inflammation, we treated mice with LPS or vehicle 6 h prior to injection of PCL-2 and D-cysteine. These studies indicate a ca. 3.7-fold turn-on in response to LPS stimulation, with a 55% reduction in signal upon treatment with apocynin101–103 (Figure 9a,b), an antioxidant and broad-spectrum inhibitor of NADPH oxidase enzymes that are a major source of ROS production during inflammation and the general immune response.58,59,63,104 The increase in bioluminescent signal detected upon LPS treatment, as well as its attenuation by apocynin, indicate that PCL-2 successfully monitors alterations in endogenous H2O2 levels in living animals during inflammation. These data are further supported by previous, imaging-independent studies using ex vivo analysis of tissues or cells, which have shown an increase in ROS following LPS injection under similar conditions as demonstrated by lipid peroxidation and an increased oxidized to reduced glutathione ratio.105–107
Figure 9. Bioluminescent signal from PCL-2 and IETDC following lipopolysaccharide challenge.

(a) Representative image (10 min post-injection) of mice 6 h after injection of LPS (IP, 3 mg/kg in 50 μL of saline) or saline vehicle (IP, 50 μL). Two minutes prior to imaging, mice were treated with apocynin (IP, 10 mg/kg in 20 μL of DMSO) or vehicle (IP, 20 μL DMSO). Imaging was started following injection of a mixture of PCL-2 and D-cysteine (IP, 0.05 μmol each, in 50 μL of 1:1 DMSO:PBS). (b) Total photon flux, 0–15 min post-injection, for mice injected with PCL-2 and D-cysteine, ± LPS, and ± apocynin. (c) Representative image (30 min post-injection) of mice 6 h after injection of LPS (IP, 3 mg/kg in 50 μL of saline) or vehicle (IP, 50 μL saline). Thirty minutes prior to imaging, mice were treated with z-VD(OMe)-OPh (IP, 1 μmol in 20 μL of DMSO) or vehicle (IP, 20 μL DMSO). Imaging was started following injection of a mixture of IETDC and HCBT (IP, 0.05 μmol each, in 50 μL of 1:1 DMSO:PBS). (d) Total photon flux, 15–45 min post-injection, for mice injected with IETDC and HCBT, ± LPS, and ± z-VD(OMe)-OPh. Statistical analyses were performed with a two-tailed Student’s t-test. *P < 0.05 (B and D: n = 3–4) and error bars are ±SEM.
Parallel studies were completed with IETDC to verify its ability to monitor caspase 8 activity during acute inflammation in this same murine model. Treatment of FVB-luc+ mice with LPS or vehicle 6 h prior to injection of IETDC and HCBT reveals an even greater increase in bioluminescent signal of ca. 18-fold (Figure 9c,d). Furthermore, a 34% attenuation of the signal is afforded by injection of the pan-caspase inhibitor z-VD-OPh, a methyl ester protected analog of Q-VD-OPh, thus establishing that IETDC reliably monitors increased caspase 8 activity following LPS stimulation (Figure 9c,d). Again, this increase in caspase 8 activity upon LPS stimulation is supported by ex vivo tissue studies that indicate increased caspase 8 expression and cleavage of procaspase 8 to form active caspase 8 following treatment with LPS.91,108,109
To verify that both apocynin and z-VD-OPh have no affect on the luciferin bioluminescent signal, a solution of HCBT and D-cysteine was injected following apocynin, z-VD-OPh, or vehicle injection. Detection of the resultant bioluminescent signal indicates that apocynin and z-VD-OPh do not alter the luciferin signal in vivo (Figure S7). Taken together, these data indicate an increase in both the level of H2O2 and the activity of caspase 8 in living mice during acute inflammation.
In Vivo Dual-Analyte Detection of Endogenous H2O2 and Caspase 8 Activity during Acute Inflammation
After confirming the individual abilities of the PCL-2 and IETDC probes to detect alterations in endogenous H2O2 levels and caspase 8 activity, respectively, in living animals in an inflammation disease model, we next applied these two probes for simultaneous detection of both bioanalytes in vivo. For these studies, LPS was again used to provoke an acute inflammatory response in FVB-luc+ mice. Initial experiments with PCL-2 and IETDC in control animals not treated with LPS clearly demonstrate that injection of both probes results in a very low bioluminescent signal (Figure 10), indicating very low basal levels of H2O2 and/or caspase 8 activity. To our delight, induction of inflammation via treatment with LPS causes a 2.7-fold increase in bioluminescent signal (Figure 10), verifying use of this luciferin-based molecular logic-gate system to indicate the simultaneous presence of both H2O2 and caspase 8 during acute inflammation.
Figure 10. Dual imaging of H2O2 and Caspase 8 following lipopolysaccharide challenge.
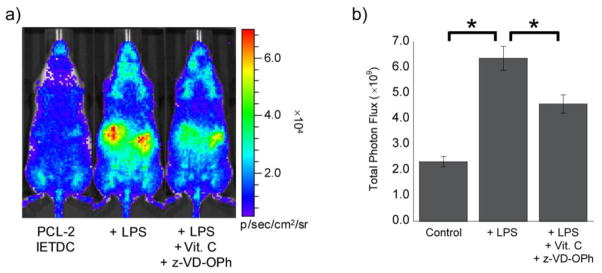
(a) Representative image (45 min post-injection) of mice following injection of ascorbic acid (IP, 200 mg/kg in 30 μL of saline), LPS (IP, 3 mg/kg in 50 μL of saline), z-VD(OMe)-OPh (IP, 1 μmol in 20 μL of DMSO), and/or their respective vehicles (IP, 30 or 50 μL saline or 20 μL DMSO). Mice were treated with ascorbic acid or vehicle 4.5 h prior to imaging, LPS or vehicle 4 h prior to imaging, and z-VD(OMe)-OPh or vehicle 2 h prior to imaging. Imaging was started following injection of a mixture of PCL-2 and IETDC (IP, 0.05 μmol each, in 50 μL of 7:3 DMSO:PBS). (b) Total photon flux, 30–60 min post-injection, for mice injected with PCL-2 and IETDC, ± LPS, ± z-VD(OMe)-OPh, and ± ascorbic acid. Statistical analyses were performed with a two-tailed Student’s t-test. *P < 0.05 (B and D: n = 3–4) and error bars are ±SEM.
We then moved on to examine whether the turn-on signal for the dual-analyte molecular logic-gate system could be attenuated by reducing ROS and caspase 8 activity. For these experiments pre-treatment with the antioxidant ascorbic acid (Vitamin C) was used to reduce the level of H2O2, as previous literature suggests a potential clinical application of this antioxidant for treatment of sepsis and other inflammatory responses.110–112 The caspase inhibitor z-VD-OPh was used for reduction of caspase 8 activity. As expected, use of both these compounds results in a 30% decrease in bioluminescent signal (Figure 10), indicating the utility of PCL-2 and IETDC for dual-analyte detection of H2O2 and caspase 8 during acute inflammation. Importantly, injection of ascorbic acid does not impact the bioluminescent signal from HCBT and D-cysteine (Figure S8), demonstrating that this vitamin alone does not alter the bioluminescent signal of luciferin. The successful application of PCL-2 and IETDC in this in vivo model of inflammation demonstrates not only the ability of both probes to detect their respective single analytes in living animals, but further establishes the tandem use of PCL-2 and IETDC to detect the concomitant increase in two different biochemical events using a single bioluminescent reporter system.
CONCLUDING REMARKS
The field of molecular imaging continues to produce an expanding set of unique chemical tools for studying living biological systems, thus affording new opportunities to elucidate the complex processes involved in various states of health, injury, aging, and disease. Central to this effort is the development of new detection methods that can be directly translated from in vitro assays to cellular and in vivo imaging applications. In this study, we have presented a general method for monitoring two different biological analytes with a single bioluminescent reporter system via in situ luciferin formation. By caging the two complementary luciferin precursors HCBT and D-cysteine with appropriate reactive protecting groups, we have devised a new sensing system for concomitant detection of a key small molecule (H2O2) and enzyme activity (caspase 8) involved in a wide variety of injury and disease states.
Specifically, the H2O2 detection probe PCL-2 relies on conversion of an aryl boronic acid to a phenol to release one half of firefly luciferin, HCBT. Complementary design and synthesis of a caspase 8 activity probe is based on a cleavable peptide, IETDC, which reacts with caspase 8 to release D-cysteine, the other half of firefly luciferin. These probes work together to form an AND-type molecular logic gate in which concomitant cleavage of both probes is required to produce a bioluminescent signal, which results from release of both HCBT and D-cysteine and subsequent in situ luciferin formation. We establish that PCL-2 and IETDC can be used separately to selectively detect their targeted analytes, H2O2 and caspase 8, respectively, and that they can be used concurrently in vitro for dual imaging of H2O2 fluxes and caspase 8 activity. Moreover, subsequent individual use of PCL-2 and IETDC in vivo during an LPS-induced acute inflammatory response verifies the ability of these probes to detect alterations in endogenous levels of H2O2 and caspase 8 activity. Finally, PCL-2 and IETDC can be used in tandem to simultaneously image H2O2 fluxes and caspase 8 activity, respectively, in a murine model of acute inflammation, showing that this molecular logic-gate approach is applicable all the way from in vitro plate-reader assays to in vivo animal disease models. Importantly, the background signal following injection of both probes is extremely low, highlighting the bioorthogonal nature of the probes and their reliable use in vivo. On balance, we note potential limitations of the system as described here is that both the cyanobenzothiazole and D-cysteine partners must be unmasked and bioavailable in the same time and space for luciferin formation within the timeframe of imaging, so quantitation may be challenging owing to spatial and temporal variations in pharmacokinetics and tissue distributions of caged species, particularly on the cyanobenzothiazole end. However, the relatively long lifetime of D-cysteine suggests that caged versions of this partner may allow imaging of analytes produced at different timescales. To expand the scope of this multi-analyte detection technology, current efforts are focused on the development of alternative probes for other biochemical processes, including enzymatic activities and related stoichiometric and catalytic reactions, small molecules and ions, and post-translational and other covalent and ionic modifications.
EXPERIMENTAL SECTION
Synthetic Materials and Methods
Compound 3 was synthesized according to literature procedures.25 Chemicals were purchased from Sigma-Aldrich (St. Louis, MO), EMD Chemicals Inc. (Gibbstown, NJ), Alfa Aesar (Ward Hill, MA), and Thermo Fisher Scientific (Waltham, MA) and were used as received. Column chromatography was performed using SiliaFlash P60 silica gel (40–63 microns) from Silicycle (Quebec, Canada). Analytical thin layer chromatography was performed using glass-backed SiO2 TLC plates from Silicycle. NMR spectra were obtained in deuterated solvents from Cambridge Isotope Laboratories (Cambridge, MA) on a Bruker AV-400 spectrometer at the College of Chemistry NMR Facility at the University of California, Berkeley. All chemical shifts are reported in the standard δ notation of parts per million using the peaks of residual proton and carbon signals of the solvent as internal references. Low resolution Electrospray Ionization (ESI) mass spectral analyses were performed on an Agilent 6100 series single quad LC/MS system or an Agilent 7890A GC system with a 5975C inert MSD with a triple-axis detector.
4-((2-Cyanobenzo[d]thiazol-6-yloxy)methyl)phenylboronic acid (1)
6-Hydroxy-2-cyanobenzothiazole (3) (150 mg, 0.85 mmol, 1.1 equiv) and 4-(hydroxymethyl)benzeneboronic acid (4) (166 mg, 0.77 mmol, 1.0 equiv) were dissolved in 15 mL dry N,N-dimethylformamide (DMF) prior to the addition of cesium carbonate (277 mg, 0.85 mmol, 1.0 equiv). The mixture was stirred at 60 °C for 45–50 min before it was allowed to cool to room temperature. Ethyl acetate (EtOAc, 100 mL) was added to the reaction, and the organic phase was washed with deionized H2O (3 × 50 mL). The aqueous layers were combined and back extracted with EtOAc (3 × 30 mL). All of the organic layers were combined, washed twice with brine, dried over sodium sulfate, and concentrated in vacuo. The crude material was purified on a silica column (90:10 EtOAc:methanol, dry loaded) to give 225 mg (94%) of the pure product as a white powder. 1H NMR (400 MHz, d6-Acetone): δ 5.33 (2H, s), 7.23 (2H, s), 7.45 (1H, dd, J = 9.0, 2.6 Hz), 7.52 (2H, d, J = 8.0 Hz), 7.91–7.94 (3H, m), 8.16 (1H, d, J = 8.8 Hz). LRMS (m/z): [M]+ calcd. for C15H12BN2O3S, 311.1; found, 311.1.
Kinetic Analysis
H2O2 (1, 2.5, or 5 mM) was added to PCL-2 (10 μM) in Tris buffer (pH 8.5) and absorbance measurements were recorded every 15–30 seconds over 5–20 minutes to determine the second order rate constant for the reaction. Measurements were taken at pH 8.5 to distinguish the HCBT peak, which shifts from 321 nm to 379 nm when it is deprotonated, from the PCL-2 peak (321 nm).
Bioluminescent Assays
Millipore water was used to prepare all aqueous solutions. Luciferase (100 μg/mL) in 50 mM Tris buffer, pH 7.4, with 10 mM MgCl2, 0.1 mM ZnCl2, and 2 mM ATP was added to selectivity assay samples (described below) to determine the relative amount of luciferin formed during incubation. Measurements for bioluminescent assays were performed at 37 °C and were recorded using a Molecular Devices SpectraMax M2 plate reader (Sunnyvale, CA). Samples for bioluminescent measurements were placed in white, opaque 96-well plates, which were purchased from Corning Inc. (Corning, NY). ATP was purchased from MP Biomedicals (Solon, OH) or Sigma-Aldrich (St. Louis, MO), and luciferase was purchased from Promega (Madison, WI). Caspase enzymes were purchased from Sigma-Aldrich (St. Louis, MO), and caspase inhibitors were purchased from MP Biomedicals (Solon, OH).
Standard Curve for Luciferin Bioluminescence
Luciferin (0.5–10 μM) was incubated in 100 μL Tris buffer (50 mM, pH 7.4) for 60 min prior to addition of 100 μL of a Tris buffer (50 mM, pH 7.4) containing luciferase (100 μg/mL), 10 mM MgCl2, 0.1 mM ZnCl2, and 2 mM ATP. Following addition of the luciferase-containing solution the bioluminescent signal was detected.
In Situ Luciferin Formation from HCBT and D-cysteine
HCBT (2.5–25 μM) was incubated with D-cysteine (2.5–25 μM) in 100 μL Tris buffer (50 mM, pH 7.4) for 60 min prior to addition of 100 μL of a Tris buffer (50 mM, pH 7.4) containing luciferase (100 μg/mL), 10 mM MgCl2, 0.1 mM ZnCl2, and 2 mM ATP. Following addition of the luciferase-containing solution the bioluminescent signal was detected.
Selectivity Assays for PCL-2
Various ROS (100 μM) were administered to PCL-2 or HCBT (5 μM) in Tris buffer (50 mM, pH 7.4) with or without 10 mM MgCl2 and 0.1 mM ZnCl2. Hydrogen peroxide (H2O2), tert-butyl hydroperoxide (TBHP), and hypochlorite (−OCl) were delivered from 10 mM stock solutions prepared using 30%, 70%, and 6.15% aqueous solutions, respectively. Hydroxyl radical (·OH) and tert-butoxy radical (·OtBu) were generated by reaction of 1 mM FeCl2 with 100 μM H2O2 or TBHP, respectively. Nitric oxide (NO·) was delivered using PROLI NONOate, and superoxide (O2−) was delivered from a 10 mM stock solution of KO2 in DMSO. Experiments with H2O2 and catalase were performed with 100 μM H2O2 and 0.4 mg/mL catalase. After each ROS was incubated with PCL-2 for 5, 20, 40, or 60 min or HCBT for 60 min, dithiothreitol (1 mM) and D-cysteine (20 μM) were added. For solutions with Fe2+, EDTA (1 mM) was added prior to D-cysteine to chelate the iron. After an additional 15 min incubation, 100 μL of a Tris buffer (50 mM, pH 7.4) containing luciferase (100 μg/mL), 10 mM MgCl2, 0.1 mM ZnCl2, and 2 mM ATP was added to 100 μL of the PCL-2 or HCBT solutions and the bioluminescent signal was detected.
Concentration Dependence of PCL-2
PCL-2 was incubated in Tris buffer (50 mM, pH 7.4) with various concentrations of H2O2 for 60 min prior to the addition of catalase (0.4 mg/mL), dithiothreitol (1 mM) and D-cysteine (20 μM). After an additional 15 min incubation, 100 μL of a Tris buffer (50 mM, pH 7.4) containing luciferase (100 μg/mL), 10 mM MgCl2, 0.1 mM ZnCl2, and 2 mM ATP was added to 100 μL of the PCL-2 solutions and the bioluminescent signal was detected.
Selectivity Assays for IETDC (Carboxylic Acid)
For determination of caspase selectivity, various caspases (3 and 8: 1 unit, 9: 0.001 unit) were administered to IETDC or D-cysteine (5 μM) in Tris buffer (50 mM, pH 7.4). A caspase buffer (10% sucrose containing 20 mM Tris-HCl, 150 mM imidazole-HCl, 20 mM 2-mercaptoethanol, 500 mM NaCl, 2.5 mM EDTA, and 0.1% CHAPS, pH 8.0) was also added with the caspase enzymes to a total volume (enzyme + buffer) of 5 μL. Additionally, dithiothreitol (1 mM) and HCBT (5 μM) were added to each solution for luciferin formation. For experiments with caspase inhibition, a pan-caspase inhibitor, Q-VD-OPh (10 μM), was added to the Tris buffer and incubated with caspase 8 for 15 min prior to delivery of IETDC, DTT, and HCBT. After each enzyme was incubated with IETDC or D-cysteine for 60 min, 100 μL of a Tris buffer (50 mM, pH 7.4) containing luciferase (100 μg/mL), 10 mM MgCl2, 0.1 mM ZnCl2, and 2 mM ATP was added to 100 μL of the IETDC or D-cysteine solutions and the bioluminescent signal was detected.
Selectivity Assays for Dual H2O2 and Caspase 8 Detection
To demonstrate dual imaging of H2O2 and caspase 8 in vitro, H2O2 (250 μM) was first added to a solution of PCL-2 (10 μM) or HCBT (5 μM) in Tris buffer (50 mM). To quench H2O2 immediately, catalase (1 unit) was subsequently added to some of the solutions. After 60 min, catalase (1 unit) was added to all other solutions containing H2O2 to quench any remaining H2O2. Subsequently, caspase 8 (1 unit) was added to the solutions in the presence or absence of the caspase inhibitor, Q-VD-OPh (10 μM), 15 min prior to IETDC (10 μM) or D-cysteine (5 μM) addition. Following IETDC or D-cysteine addition, the solutions were incubated for 60 min. Additionally, dithiothreitol (1 mM) was added to all solutions at the time of caspase 8 addition to maintain the reduced state of the D-cysteine. To monitor luciferin formation, 100 μL of a Tris buffer (50 mM, pH 7.4) containing luciferase (100 μg/mL), 10 mM MgCl2, 0.1 mM ZnCl2, and 2 mM ATP was added to 100 μL of the PCL-2/IETDC or HCBT/D-cysteine solutions and the bioluminescent signal was detected.
Cellular Assays
A Xenogen IVIS Spectrum instrument (Caliper Life Sciences, Hopkinton, MA) was used for bioluminescent imaging in all cellular experiments. PC3M-luc cells (kindly provided by Chris Contag, Stanford University) were cultured in Dulbecco’s Modified Eagle Medium (DMEM) containing 10% Fetal Bovine Serum (FBS). Prior to assaying, cells were passed and plated (1.3–1.5 x 10⁴ cells/well) in black 96-well plates with clear bottoms (Becton Dickinson and Company, Franklin Lakes, NJ). Once the cells were ca. 95% confluent, reagents were added for bioluminescent assays.
Comparison of In Situ Luciferin Formation and Luciferin in PC3M-luc Cells
PC3M-luc cells prepared as described above were washed with HBSS (25 mM glucose) prior to addition of HCBT and D-cysteine (0–500 μM, 1% DMSO) or luciferin (0–500 μM, 1% DMSO) in HBSS (25 mM glucose). For experiments with lysed cells, 100 μL Glo lysis buffer (Promega, Madison, WI) was incubated with the PC3M-luc cells for 5 min prior to addition of HCBT and D-cysteine or luciferin. The plates were immediately imaged for 2 h to determine the peak bioluminescent signal produced.
Determination of Signal Produced from Endogenous L-Cysteine in PC3M-luc Cells
PC3M-luc cells prepared as described above were washed with HBSS (25 mM glucose) prior to addition of HCBT and D-cysteine (0–50 μM, 1% DMSO) or HCBT alone (0–50 μM, 1% DMSO) in HBSS (25 mM glucose). The plate was immediately imaged for 2 h to determine the peak bioluminescent signal produced.
Lifetime of HCBT and D-Cysteine in PC3M-luc Cells
The medium was removed from PC3M-luc cells prepared as described above, and HCBT (100 μM, 1% DMSO) or D-cysteine (100 μM, 1% PBS) in DMEM (-FBS) was added. After a 30 min incubation, the HCBT or D-cysteine was removed, the cells were washed with DMEM (-FBS), and fresh DMEM was added. After 0, 15, 30, 45, or 60 min, the second component of luciferin, D-cysteine (100 μM final concentration, 1% PBS) or HCBT (100 μM final concentration, 1% DMSO) in HBSS (25 mM glucose) was added, and the plate was immediately imaged for 2 h to determine the peak bioluminescent signal produced.
Concentration Dependence of PCL-2 with PC3M-luc Cells
The medium was removed from PC3M-luc cells prepared as described above, and PCL-2 (25 μM, 2.5% final DMSO concentration), D-cysteine (25 μM), and H2O2 (0–100 μM final concentrations) in DMEM (-FBS) were added. The plate was immediately imaged for 2 h to determine the peak bioluminescent signal produced from PCL-2.
Animal Experiments
A Xenogen IVIS Spectrum instrument (Caliper Life Sciences, Hopkinton, MA) was used for bioluminescent imaging in all animal experiments. Mice were anesthetized prior to injection and during imaging via inhalation of isoflurane. Phosphate Buffered Saline (PBS) was purchased from Thermo Fisher Scientific (Waltham, MA), and saline (0.9%) was made from sodium chloride and Millipore water. Isoflurane was purchased from Phoenix Pharmaceuticals, Inc. (St. Joseph, MO), and pharmaceutical grade DMSO was purchased from Sigma-Aldrich (St. Louis, MO). Medical grade oxygen was purchased from Praxair (Danbury, CT).
Animals
FVB-luc+ (FVB-Tg(CAG-luc,-GFP)L2G85Chco/J) mice were bred at UC Berkeley, and were single or group-housed on a 12:12 light-dark cycle at 22 °C with free access to food and water. All studies were approved and performed according to the guidelines of the Animal Care and Use Committee of the University of California, Berkeley.
Comparison of In Situ Luciferin Formation and Luciferin in Mice
Unshaven, male FVB-luc+ mice were anesthetized with isoflurane and injected IP with D-cysteine (0.05 or 0.5 μmol, in 20 μL of PBS) or vehicle (20 μL PBS). After 2 min, mice were injected IP with HCBT (0.05 or 0.5 μmol in 50 μL of 1:1 DMSO:PBS) or luciferin (0.05 μmol in 50 μL of 1:1 DMSO:PBS). Following injections, mice were imaged with an IVIS Spectrum.
Determination of Signal Produced from Endogenous L-Cysteine in Mice
Unshaven, male FVB-luc+ mice were anesthetized with isoflurane and injected IP with D-cysteine (0.05 μmol, in 20 μL of PBS) or vehicle (20 μL PBS). After 2 min, mice were injected IP with HCBT (0.05 μmol in 50 μL of 1:1 DMSO:PBS). Following injections, mice were imaged with an IVIS Spectrum.
Exogenous H2O2 Experiments in Mice
Unshaven, male FVB-luc+ mice were anesthetized with isoflurane and injected IP with a mixture of PCL-2 and D-cysteine (0.05 μmol each, in 50 μL of 1:1 DMSO:PBS), followed immediately by an IP injection of H2O2 (0–4.5 μmol in 100 μL of PBS). Control mice were injected IP with a mixture of HCBT and D-cysteine (0.01 μmol each, in 50 μL of 1:1 DMSO:PBS) immediately prior to H2O2 (4.5 μmol in 100 μL of PBS). Following injections, mice were imaged with an IVIS Spectrum.
Antioxidant Experiments in Mice
Unshaven, male FVB-luc+ mice, were anesthetized with isoflurane and injected IP with NAC (10 mg/kg in 25 μL of PBS, pH 7–8) or PBS (25 μL). After 2 min, the mice were injected IP with a mixture of PCL-2 and D-cysteine (0.05 μmol each, in 50 μL of 1:1 DMSO:PBS) immediately prior to IP injection of H2O2 (1.5 μmol in 75 μL of PBS). Firefly luciferin control mice were injected IP with NAC (10 mg/kg in 100 μL of PBS, pH 7–8) or PBS (100 μL) immediately following IP injection of a mixture of HCBT and D-cysteine (0.01 μmol each, in 50 μL of 1:1 DMSO:PBS). Following injections, mice were imaged with an IVIS Spectrum.
Lipopolysaccharide Inflammation Model
Unshaven, female FVB-luc+ mice, aged 2–5 months, were anesthetized with isoflurane and injected IP with lipopolysaccharides (LPS, 3 mg/kg in 50 μL of saline) or saline (50 μL). For studies with PCL-2 alone, mice were injected IP with either apocynin (10 mg/kg in 20 μL of DMSO) or DMSO (20 μL) 6 h after LPS injection. Two minutes after this injection, mice were injected IP with a mixture of PCL-2 and D-cysteine (0.05 μmol each, in 50 μL of 1:1 DMSO:PBS) and imaged. For studies with IETDC alone, mice were injected IP with either z-VD(OMe)-OPh (1 μmol in 20 μL of DMSO) or DMSO (20 μL) 5.5 h after LPS injection. Thirty minutes after z-VD(OMe)-OPh or vehicle injection, mice were injected IP with a mixture of IETDC and HCBT (0.05 μmol each, in 50 μL of 1:1 DMSO:PBS) and imaged.
For studies with PCL-2 and IETDC, mice were injected IP with ascorbic acid (200 mg/kg in 30 μL of saline) or the saline vehicle (30 μL) 30 min prior to IP injection of LPS (3 mg/kg in 50 μL of saline) or saline (50 μL). Two hours after injection of LPS, z-VD(OMe)-OPh (1 μmol in 20 μL of DMSO) or the vehicle, DMSO (20 μL), was injected IP. Two hours later, mice were injected IP with a mixture of PCL-2 and IETDC (0.05 μmol each, in 50 μL of 7:3 DMSO:PBS) and imaged.
Supplementary Material
Acknowledgments
We thank the National Institute of General Medical Sciences (NIH GM 79465 to C.J.C. and NIH GM 058867 to C.R.B.) and the Packard Foundation (C.J.C.) for funding this work. C.J.C. and C.R.B. are Investigators with the Howard Hughes Medical Institute. We thank David King (UC Berkeley) for synthesis of the IETDC peptides and help with purification of the peptides. We thank Ann Fischer (UC Berkeley) for culturing and plating of PC3M-luc cells. We thank Prof. Elena Dubikovskaya for preliminary discussions and experiments that lead to this study.
Footnotes
Supplementary figures. This material is available free of charge via the Internet at http://pubs.acs.org.
References
- 1.Tsien RY. Nat Rev Mol Cell Biol. 2003;4:SS16–SS21. [PubMed] [Google Scholar]
- 2.Meade TJ, Aime S. Acc Chem Res. 2009;42:821. doi: 10.1021/ar900166c. [DOI] [PubMed] [Google Scholar]
- 3.Hilderbrand SA, Weissleder R. Curr Opin Chem Biol. 2010;14:71–79. doi: 10.1016/j.cbpa.2009.09.029. [DOI] [PubMed] [Google Scholar]
- 4.Ueno T, Nagano T. Nat Methods. 2011;8:642–645. doi: 10.1038/nmeth.1663. [DOI] [PubMed] [Google Scholar]
- 5.Pittet MJ, Weissleder R. Cell. 2011;147:983–991. doi: 10.1016/j.cell.2011.11.004. [DOI] [PMC free article] [PubMed] [Google Scholar]
- 6.James ML, Gambhir SS. Physiol Rev. 2012;92:897–965. doi: 10.1152/physrev.00049.2010. [DOI] [PubMed] [Google Scholar]
- 7.Chang PV, Bertozzi CR. Chem Commun. 2012;48:8864–8879. doi: 10.1039/c2cc31845h. [DOI] [PMC free article] [PubMed] [Google Scholar]
- 8.Seliger HH, McElroy WD. Arch Biochem Biophys. 1960;88:136–141. doi: 10.1016/0003-9861(60)90208-3. [DOI] [PubMed] [Google Scholar]
- 9.Zhao H, Doyle TC, Coquoz O, Kalish F, Rice BW, Contag CH. J Biomed Opt. 2005;10(1–9):041210. doi: 10.1117/1.2032388. [DOI] [PubMed] [Google Scholar]
- 10.Berger F, Paulmurugan R, Bhaumik S, Gambhir S. Eur J Nucl Med Mol Imaging. 2008;35:2275–2285. doi: 10.1007/s00259-008-0870-6. [DOI] [PMC free article] [PubMed] [Google Scholar]
- 11.Prescher JA, Contag CH. Curr Opin Chem Biol. 2010;14:80–89. doi: 10.1016/j.cbpa.2009.11.001. [DOI] [PubMed] [Google Scholar]
- 12.Geiger R, Schneider E, Wallenfels K, Miska W. Biol Chem Hoppe-Seyler. 1992;373:1187–1191. doi: 10.1515/bchm3.1992.373.2.1187. [DOI] [PubMed] [Google Scholar]
- 13.Monsees T, Miska W, Geiger R. Anal Biochem. 1994;221:329–334. doi: 10.1006/abio.1994.1421. [DOI] [PubMed] [Google Scholar]
- 14.O’Brien MA, Daily WJ, Hesselberth PE, Moravec RA, Scurria MA, Klaubert DH, Bulleit RF, Wood KV. J Biomol Screening. 2005;10:137–148. doi: 10.1177/1087057104271865. [DOI] [PubMed] [Google Scholar]
- 15.Shah K, Tung CH, Breakefield XO, Weissleder R. Mol Ther. 2005;11:926–931. doi: 10.1016/j.ymthe.2005.01.017. [DOI] [PubMed] [Google Scholar]
- 16.Zhou W, Valley MP, Shultz J, Hawkins EM, Bernad L, Good T, Good D, Riss TL, Klaubert DH, Wood KV. J Am Chem Soc. 2006;128:3122–3123. doi: 10.1021/ja058519o. [DOI] [PubMed] [Google Scholar]
- 17.Valley MP, Zhou W, Hawkins EM, Shultz J, Cali JJ, Worzella T, Bernad L, Good T, Good D, Riss TL, Klaubert DH, Wood KV. Anal Biochem. 2006;359:238–246. doi: 10.1016/j.ab.2006.09.035. [DOI] [PubMed] [Google Scholar]
- 18.Zhou W, Shultz JW, Murphy N, Hawkins EM, Bernad L, Good T, Moothart L, Frackman S, Klaubert DH, Bulleit RF, Wood KV. Chem Commun. 2006:4620–4622. doi: 10.1039/b610682j. [DOI] [PubMed] [Google Scholar]
- 19.Wehrman TS, von Dogenfeld G, Krutzik PO, Nolan GP, Blau HM. Nat Methods. 2006;3:295–301. doi: 10.1038/nmeth868. [DOI] [PubMed] [Google Scholar]
- 20.Yao H, So M-k, Rao J. Angew Chem Int Ed. 2007;46:7031–7034. doi: 10.1002/anie.200701931. [DOI] [PubMed] [Google Scholar]
- 21.Zhou W, Andrews C, Liu J, Shultz JW, Valley MP, Cali JJ, Hawkins EM, Klaubert DH, Bulleit RF, Wood KV. ChemBioChem. 2008;9:714–718. doi: 10.1002/cbic.200700644. [DOI] [PubMed] [Google Scholar]
- 22.Dragulescu-Andrasi A, Liang G, Rao J. Bioconjugate Chem. 2009;20:1660–1666. doi: 10.1021/bc9002508. [DOI] [PMC free article] [PubMed] [Google Scholar]
- 23.Kindermann M, Roschitzki-Voser H, Caglic D, Repnik U, Miniejew C, Mittl PRE, Kosec G, Grütter MG, Turk B, Wendt KU. Chem Biol. 2010;17:999–1007. doi: 10.1016/j.chembiol.2010.07.011. [DOI] [PubMed] [Google Scholar]
- 24.Rush JS, Beatty KE, Bertozzi CR. ChemBioChem. 2010;11:2096–2099. doi: 10.1002/cbic.201000115. [DOI] [PMC free article] [PubMed] [Google Scholar]
- 25.Van de Bittner GC, Dubikovskaya EA, Bertozzi CR, Chang CJ. Proc Natl Acad Sci USA. 2010;107:21316–21321. doi: 10.1073/pnas.1012864107. [DOI] [PMC free article] [PubMed] [Google Scholar]
- 26.Cohen AS, Dubikovskaya EA, Rush JS, Bertozzi CR. J Am Chem Soc. 2010;132:8563–8565. doi: 10.1021/ja101766r. [DOI] [PMC free article] [PubMed] [Google Scholar]
- 27.White EH, Worther H, Seliger HH, McElroy WD. J Am Chem Soc. 1966;88:2015–2019. [Google Scholar]
- 28.Branchini BR, Hayward MM, Bamford S, Brennan PM, Lajiness EJ. Photochem Photobiol. 1989;49:689–95. doi: 10.1111/j.1751-1097.1989.tb08442.x. [DOI] [PubMed] [Google Scholar]
- 29.Branchini BR, Magyar RA, Murtiashaw MH, Anderson SM, Helgerson LC, Zimmer M. Biochemistry. 1999;38:13223–13230. doi: 10.1021/bi991181o. [DOI] [PubMed] [Google Scholar]
- 30.Shapiro E, Lu C, Baneyx F. Protein Eng, Des Sel. 2005;18:581–587. doi: 10.1093/protein/gzi066. [DOI] [PubMed] [Google Scholar]
- 31.Shinde R, Perkins J, Contag CH. Biochemistry. 2006;45:11103–11112. doi: 10.1021/bi060475o. [DOI] [PubMed] [Google Scholar]
- 32.Caysa H, Jacob R, Müther N, Branchini B, Messerle M, Söling A. Photochem Photobiol Sci. 2008;8:52–56. doi: 10.1039/b814566k. [DOI] [PubMed] [Google Scholar]
- 33.Takakura H, Sasakura K, Ueno T, Urano Y, Terai T, Hanaoka K, Tsuboi T, Nagano T. Chem Asian J. 2010;5:2053–2061. doi: 10.1002/asia.201000219. [DOI] [PubMed] [Google Scholar]
- 34.Reddy GR, Thompson WC, Miller SC. J Am Chem Soc. 2010;132:13586–13587. doi: 10.1021/ja104525m. [DOI] [PMC free article] [PubMed] [Google Scholar]
- 35.Mezzanotte L, Que I, Kaijzel E, Branchini B, Roda A, Löwik C. PLoS One. 2011;6:e19277. doi: 10.1371/journal.pone.0019277. [DOI] [PMC free article] [PubMed] [Google Scholar]
- 36.Harwood KR, Mofford DM, Reddy GR, Miller SC. Chem Biol. 2011;18:1649–1657. doi: 10.1016/j.chembiol.2011.09.019. [DOI] [PMC free article] [PubMed] [Google Scholar]
- 37.Conley NR, Dragulescu-Andrasi A, Rao J, Moerner WE. Angew Chem Int Ed. 2012;51:3350–3353. doi: 10.1002/anie.201105653. [DOI] [PMC free article] [PubMed] [Google Scholar]
- 38.McCutcheon DC, Paley MA, Steinhardt RC, Prescher JA. J Am Chem Soc. 2012;134:7604–7607. doi: 10.1021/ja301493d. [DOI] [PMC free article] [PubMed] [Google Scholar]
- 39.Liang Y, Walczak P, Bulte JWM. J Biomed Opt. 2012;17:016004. doi: 10.1117/1.JBO.17.1.016004. [DOI] [PMC free article] [PubMed] [Google Scholar]
- 40.Sun Y-Q, Liu J, Wang P, Zhang J, Guo W. Angew Chem Int Ed. 2012;51:8428–8430. doi: 10.1002/anie.201203565. [DOI] [PubMed] [Google Scholar]
- 41.Ren H, Xiao F, Zhan F, Kim Y-P, Xie H, Xia Z, Rao J. Angew Chem Int Ed. 2009;48:9658–9662. doi: 10.1002/anie.200903627. [DOI] [PMC free article] [PubMed] [Google Scholar]
- 42.Nguyen DP, Elliott T, Holt M, Muir TW, Chin JW. J Am Chem Soc. 2011;133:11418–11421. doi: 10.1021/ja203111c. [DOI] [PubMed] [Google Scholar]
- 43.Wang X, Li Q, Yuan Y, Mei B, Huang R, Tian Y, Sun J, Cao C, Lu G, Liang G. Org Biomol Chem. 2012;10:8082–8086. doi: 10.1039/c2ob26279g. [DOI] [PubMed] [Google Scholar]
- 44.Jeon J, Shen B, Xiong L, Miao Z, Lee KH, Rao J, Chin FT. Bioconjugate Chem. 2012;23:1902–1908. doi: 10.1021/bc300273m. [DOI] [PMC free article] [PubMed] [Google Scholar]
- 45.Barnham KJ, Masters CL, Bush AI. Nat Rev Drug Discov. 2004;3:205–214. doi: 10.1038/nrd1330. [DOI] [PubMed] [Google Scholar]
- 46.Hotchkiss RS, Nicholson DW. Nat Rev Immunol. 2006;6:813–822. doi: 10.1038/nri1943. [DOI] [PubMed] [Google Scholar]
- 47.Houstis N, Rosen ED, Lander ES. Nature. 2006;440:944–948. doi: 10.1038/nature04634. [DOI] [PubMed] [Google Scholar]
- 48.Jay D, Hitomi H, Griendling KK. Free Radical Biol Med. 2006;40:183–192. doi: 10.1016/j.freeradbiomed.2005.06.018. [DOI] [PubMed] [Google Scholar]
- 49.Lin MT, Beal MF. Nature. 2006;443:787–795. doi: 10.1038/nature05292. [DOI] [PubMed] [Google Scholar]
- 50.Finkel T, Serrano M, Blasco MA. Nature. 2007;448:767–774. doi: 10.1038/nature05985. [DOI] [PubMed] [Google Scholar]
- 51.Rossi DJ, Jamieson CHM, Weissman IL. Cell. 2008;132:681–696. doi: 10.1016/j.cell.2008.01.036. [DOI] [PubMed] [Google Scholar]
- 52.Looi YH, Grieve DJ, Siva A, Walker SJ, Anilkumar N, Cave AC, Marber M, Monaghan MJ, Shah AM. Hypertension. 2008;51:319–325. doi: 10.1161/HYPERTENSIONAHA.107.101980. [DOI] [PubMed] [Google Scholar]
- 53.Ushio-Fukai M, Urao N. Antioxid Redox Signaling. 2009;11:2517–2533. doi: 10.1089/ars.2009.2582. [DOI] [PMC free article] [PubMed] [Google Scholar]
- 54.Venero JL, Burguillos MA, Brundin P, Joseph B. Cell Death Differ. 2011;18:1679–1691. doi: 10.1038/cdd.2011.107. [DOI] [PMC free article] [PubMed] [Google Scholar]
- 55.White EH, McCapra F, Field GF. J Am Chem Soc. 1963;85:337–343. [Google Scholar]
- 56.Day JC, Tisi LC, Bailey MJ. Luminescence. 2004;19:8–20. doi: 10.1002/bio.749. [DOI] [PubMed] [Google Scholar]
- 57.Niwa K, Nakamura M, Ohmiya Y. FEBS Lett. 2006;580:5283–5287. doi: 10.1016/j.febslet.2006.08.073. [DOI] [PubMed] [Google Scholar]
- 58.Forman HJ, Torres M. Am J Respir Crit Care Med. 2002;166:S4–S8. doi: 10.1164/rccm.2206007. [DOI] [PubMed] [Google Scholar]
- 59.Lambeth JD. Nat Rev Immunol. 2004;4:181–189. doi: 10.1038/nri1312. [DOI] [PubMed] [Google Scholar]
- 60.Segal AW. Annu Rev Immunol. 2005;23:197–223. doi: 10.1146/annurev.immunol.23.021704.115653. [DOI] [PMC free article] [PubMed] [Google Scholar]
- 61.Savina A, Amigorena S. Immunol Rev. 2007;219:143–156. doi: 10.1111/j.1600-065X.2007.00552.x. [DOI] [PubMed] [Google Scholar]
- 62.Michalek RD, Nelson KJ, Holbrook BC, Yi JS, Stridiron D, Daniel LW, Fetrow JS, King SB, Poole LB, Grayson JM. J Immunol. 2007;179:6456–6467. doi: 10.4049/jimmunol.179.10.6456. [DOI] [PubMed] [Google Scholar]
- 63.Brown DI, Griendling KK. Free Radical Biol Med. 2009;47:1239–1253. doi: 10.1016/j.freeradbiomed.2009.07.023. [DOI] [PMC free article] [PubMed] [Google Scholar]
- 64.Jaeschke H. J Gastroenterol Hepatol. 2011;26:173–179. doi: 10.1111/j.1440-1746.2010.06592.x. [DOI] [PubMed] [Google Scholar]
- 65.Bannerman DD, Goldblum SE. Am J Physiol Lung Cell Mol Physiol. 2003;284:L899–L914. doi: 10.1152/ajplung.00338.2002. [DOI] [PubMed] [Google Scholar]
- 66.Ma Y, Temkin V, Liu H, Pope RM. J Biol Chem. 2005;280:41827–41834. doi: 10.1074/jbc.M510849200. [DOI] [PubMed] [Google Scholar]
- 67.Chang MCY, Pralle A, Isacoff EY, Chang CJ. J Am Chem Soc. 2004;126:15392–15393. doi: 10.1021/ja0441716. [DOI] [PMC free article] [PubMed] [Google Scholar]
- 68.Miller EW, Albers AE, Pralle A, Isacoff EY, Chang CJ. J Am Chem Soc. 2005;127:16652–16659. doi: 10.1021/ja054474f. [DOI] [PMC free article] [PubMed] [Google Scholar]
- 69.Miller EW, Tulyathan O, Isacoff EY, Chang CJ. Nat Chem Biol. 2007;3:263–267. doi: 10.1038/nchembio871. [DOI] [PubMed] [Google Scholar]
- 70.Srikun D, Miller EW, Domaille DW, Chang CJ. J Am Chem Soc. 2008;130:4596–4597. doi: 10.1021/ja711480f. [DOI] [PubMed] [Google Scholar]
- 71.Dickinson BC, Chang CJ. J Am Chem Soc. 2008;130:9638–9639. doi: 10.1021/ja802355u. [DOI] [PMC free article] [PubMed] [Google Scholar]
- 72.Srikun D, Albers AE, Nam CI, Iavarone AT, Chang CJ. J Am Chem Soc. 2010;132:4455–4465. doi: 10.1021/ja100117u. [DOI] [PMC free article] [PubMed] [Google Scholar]
- 73.Dickinson BC, Huynh C, Chang CJ. J Am Chem Soc. 2010;132:5906–5915. doi: 10.1021/ja1014103. [DOI] [PMC free article] [PubMed] [Google Scholar]
- 74.Miller EW, Dickinson BC, Chang CJ. Proc Natl Acad Sci USA. 2010;107:15681–15686. doi: 10.1073/pnas.1005776107. [DOI] [PMC free article] [PubMed] [Google Scholar]
- 75.Lippert AR, Gschneidtner T, Chang CJ. Chem Commun. 2010;46:7510–7512. doi: 10.1039/c0cc01560a. [DOI] [PubMed] [Google Scholar]
- 76.Dickinson BC, Peltier J, Stone D, Schaffer DV, Chang CJ. Nat Chem Biol. 2011;7:106–112. doi: 10.1038/nchembio.497. [DOI] [PMC free article] [PubMed] [Google Scholar]
- 77.Srikun D, Albers AE, Chang CJ. Chem Sci. 2011;2:1156–1165. [Google Scholar]
- 78.Dickinson BC, Tang Y, Chang Z, Chang CJ. Chem Biol. 2011;18:943–948. doi: 10.1016/j.chembiol.2011.07.005. [DOI] [PMC free article] [PubMed] [Google Scholar]
- 79.Lo L-C, Chu C-Y. Chem Commun. 2003:2728–2729. doi: 10.1039/b309393j. [DOI] [PubMed] [Google Scholar]
- 80.Du L, Li M, Zheng S, Wang B. Tetrahedron Lett. 2008;49:3045–3048. doi: 10.1016/j.tetlet.2008.03.063. [DOI] [PMC free article] [PubMed] [Google Scholar]
- 81.Du L, Ni N, Li M, Wang B. Tetrahedron Lett. 2010;51:1152–1154. doi: 10.1016/j.tetlet.2009.12.049. [DOI] [PMC free article] [PubMed] [Google Scholar]
- 82.Quin C, Robertson L, McQuaker SJ, Price NC, Brand MD, Hartley RC. Tetrahedron. 2010;66:2384–2389. doi: 10.1016/j.tet.2010.01.103. [DOI] [PMC free article] [PubMed] [Google Scholar]
- 83.Cochemé HM, Quin C, McQuaker SJ, Cabreiro F, Logan A, Prime TA, Abakumova I, Patel JV, Fearnley IM, James AM, Porteous CM, Smith RAJ, Saeed S, Carré JE, Singer M, Gems D, Hartley RC, Partridge L, Murphy MP. Cell Metab. 2011;13:340–350. doi: 10.1016/j.cmet.2011.02.003. [DOI] [PMC free article] [PubMed] [Google Scholar]
- 84.Karton-Lifshin N, Segal E, Omer L, Portnoy M, Satchi-Fainaro R, Shabat D. J Am Chem Soc. 2011;133:10960–10965. doi: 10.1021/ja203145v. [DOI] [PubMed] [Google Scholar]
- 85.Yuan L, Lin W, Xie Y, Chen B, Zhu S. J Am Chem Soc. 2012;134:1305–1315. doi: 10.1021/ja2100577. [DOI] [PubMed] [Google Scholar]
- 86.Yuan L, Lin W, Zhao S, Gao W, Chen B, He L, Zhu S. J Am Chem Soc. 2012;134:13510–13523. doi: 10.1021/ja305802v. [DOI] [PubMed] [Google Scholar]
- 87.Thornberry NA, Lazebnik Y. Science. 1998;281:1312–1316. doi: 10.1126/science.281.5381.1312. [DOI] [PubMed] [Google Scholar]
- 88.Granville DJ, Carthy CM, Jiang H, Shore GC, McManus BM, Hunt DW. FEBS Lett. 1998;437:5–10. doi: 10.1016/s0014-5793(98)01193-4. [DOI] [PubMed] [Google Scholar]
- 89.Gregoli PA, Bondurant MC. J Cell Physiol. 1999;178:133–143. doi: 10.1002/(SICI)1097-4652(199902)178:2<133::AID-JCP2>3.0.CO;2-5. [DOI] [PubMed] [Google Scholar]
- 90.Deaciuc IV, D’Souza NB, de Villiers WJ, Burikhanov R, Sarphie TG, Hill DB, McClain CJ. Alcohol Clin Exp Res. 2001;25:935–943. [PubMed] [Google Scholar]
- 91.Alikhani M, Alikhani Z, He H, Liu R, Popek BI, Graves DT. J Biol Chem. 2003;278:52901–52908. doi: 10.1074/jbc.M307638200. [DOI] [PubMed] [Google Scholar]
- 92.Cao YA, Wagers AJ, Beilhack A, Dusich J, Bachmann MH, Negrin RS, Weissman IL, Contag CH. Proc Natl Acad Sci USA. 2004;101:221–226. doi: 10.1073/pnas.2637010100. [DOI] [PMC free article] [PubMed] [Google Scholar]
- 93.Caserta TM, Smith AN, Gultice AD, Reedy MA, Brown TL. Apoptosis. 2003;8:345–352. doi: 10.1023/a:1024116916932. [DOI] [PubMed] [Google Scholar]
- 94.Cai SX, Guan L, Jia S, Wang Y, Yang W, Tseng B, Drewe J. Bioorg Med Chem Lett. 2004;14:5295–5300. doi: 10.1016/j.bmcl.2004.08.027. [DOI] [PubMed] [Google Scholar]
- 95.Winterbourn CC, Metodiewa D. Free Radical Biol Med. 1999;27:322–328. doi: 10.1016/s0891-5849(99)00051-9. [DOI] [PubMed] [Google Scholar]
- 96.Djaldetti M, Salman H, Bergman M, Djaldetti R, Bessler H. Microsc Res Tech. 2002;57:421–431. doi: 10.1002/jemt.10096. [DOI] [PubMed] [Google Scholar]
- 97.Parrillo JE. N Engl J Med. 1993;328:1471–1477. doi: 10.1056/NEJM199305203282008. [DOI] [PubMed] [Google Scholar]
- 98.Rietschel ET, Kirikae T, Schade FU, Mamat U, Schmidt G, Loppnow H, Ulmer AJ, Zahringer U, Seydel U, di Padova F, Schreier M, Brade H. FASEB J. 1994;8:217–225. doi: 10.1096/fasebj.8.2.8119492. [DOI] [PubMed] [Google Scholar]
- 99.Raetz CRH, Whitfield C. Annu Rev Biochem. 2002;71:635–700. doi: 10.1146/annurev.biochem.71.110601.135414. [DOI] [PMC free article] [PubMed] [Google Scholar]
- 100.Trent MS, Stead CM, Tran AX, Hankins JA. J Endotoxin Res. 2006;12:205–223. doi: 10.1179/096805106X118825. [DOI] [PubMed] [Google Scholar]
- 101.Wang W, Suzuki Y, Tanigaki T, Rank DR, Raffin TA. Am J Respir Crit Care Med. 1994;150:1449–1452. doi: 10.1164/ajrccm.150.5.7952574. [DOI] [PubMed] [Google Scholar]
- 102.Zhang ZH, Yu Y, Wei SG, Felder RB. J Hypertens. 2010;28:806–816. doi: 10.1097/HJH.0b013e3283358b6e. [DOI] [PMC free article] [PubMed] [Google Scholar]
- 103.Choi SH, Aid S, Kim HW, Jackson SH, Bosetti F. J Neurochem. 2012;120:292–301. doi: 10.1111/j.1471-4159.2011.07572.x. [DOI] [PMC free article] [PubMed] [Google Scholar]
- 104.Nauseef WM. J Biol Chem. 2008;283:16961–16965. doi: 10.1074/jbc.R700045200. [DOI] [PMC free article] [PubMed] [Google Scholar]
- 105.Victor VM, Rocha M, de la Fuente M. Free Radical Res. 2003;37:919–929. doi: 10.1080/1071576031000148727. [DOI] [PubMed] [Google Scholar]
- 106.Goraca A, Piechota A, Huk-Kolega H. J Physiol Pharmacol. 2009;60:61–68. [PubMed] [Google Scholar]
- 107.Singh N, Li L. Mol Immunol. 2012;50:244–252. doi: 10.1016/j.molimm.2012.01.011. [DOI] [PMC free article] [PubMed] [Google Scholar]
- 108.Alikhani M, Alikhani Z, Graves DT. J Dent Res. 2004;83:671–676. doi: 10.1177/154405910408300903. [DOI] [PubMed] [Google Scholar]
- 109.Supinski GS, Ji X, Callahan LA. Am J Physiol Regul Integr Comp Physiol. 2009;297:R825–R834. doi: 10.1152/ajpregu.90849.2008. [DOI] [PMC free article] [PubMed] [Google Scholar]
- 110.Pleiner J, Mittermayer F, Schaller G, MacAllister RJ, Wolzt M. Circulation. 2002;106:1460–1464. doi: 10.1161/01.cir.0000030184.70207.ff. [DOI] [PubMed] [Google Scholar]
- 111.Wilson JX. Biofactors. 2009;35:5–13. doi: 10.1002/biof.7. [DOI] [PMC free article] [PubMed] [Google Scholar]
- 112.Fisher BJ, Seropian IM, Kraskauskas D, Thakkar JN, Voelkel NF, Fowler AA, Natarajan R. Crit Care Med. 2011;39:1454–1460. doi: 10.1097/CCM.0b013e3182120cb8. [DOI] [PubMed] [Google Scholar]
Associated Data
This section collects any data citations, data availability statements, or supplementary materials included in this article.