

Abstract
Diabetes-associated complications in the microvasculature of the brain are caused by oxidative stress, generated by overproduction of reactive oxygen species from hyperglycemia-induced accelerated oxidative metabolism of glucose. Pericytes, essential for the viability of the microvasculature, are especially susceptible to oxidative stress. Mitochondrial carbonic anhydrases, regulators of the oxidative metabolism of glucose, determine the rate of reactive oxygen species production and inhibition of mitochondrial carbonic anhydrases rescues glucose-induced pericyte loss in the diabetic mouse brain. We hypothesized that high glucose induces intracellular oxidative stress and pericyte apoptosis and that inhibition of mitochondrial carbonic anhydrases protects pericytes from oxidative stress-induced apoptosis. To validate our hypothesis, conditionally immortalized cerebral pericyte (IPC) cultures were established from Immortomice to investigate the effect of high glucose on oxidative stress and pericyte apoptosis. The IPCs expressed pericyte markers and induced high transendothelial electrical resistance and low permeability in brain endothelial cell monolayers comparable with pericytes in primary cultures. The IPCs also secreted cytokines constitutively and in response to lipopolysaccharide similar to pericytes. High glucose caused oxidative stress and apoptosis of these cells, with both oxidative stress and apoptosis significantly reduced after mitochondrial carbonic anhydrase inhibition. These results provide the first evidence that pharmacological inhibition of mitochondrial carbonic anhydrases attenuates pericyte apoptosis caused by high glucose-induced oxidative stress. Carbonic anhydrase inhibitors have a long history of safe clinical use and can be immediately evaluated for this new indication in translational research. Thus, mitochondrial carbonic anhydrases may provide a new therapeutic target for oxidative stress-related illnesses of the brain.
Introduction
Diabetes mellitus is associated with chronic hyperglycemia, oxidative stress (OxSt), and diabetes-specific microvascular pathology in a variety of tissues, including the brain (Giugliano et al., 1996; Kowluru, 2001; Kowluru et al., 2004). The microvasculature of the brain comprises the vascular blood–brain barrier (BBB), a regulatory interface that prevents the unrestricted leakage of plasma proteins into the central nervous system and has nutritive, homeostatic, and communication roles. The brain endothelial cells (ECs) comprising the BBB are in immediate contact with the pericytes (PCs). The PCs play an important role in the maintenance and homeostasis of the BBB (Dore-Duffy et al., 2006; Dore-Duffy, 2008) and are especially susceptible to OxSt (Price et al., 2012).
OxSt is caused by overproduction of reactive oxygen species (ROS) primarily during mitochondrial oxidative metabolism of glucose (Du et al., 2000; Nishikawa et al., 2000). ROS are produced as byproducts (Liu et al., 2002; Chen et al., 2003) of electron transport chain (ETC) reactions during production of ATP as glucose is metabolized to H2O and CO2. In diabetes, the hyperglycemic state provides more glucose to the Krebs cycle, especially in insulin-insensitive tissues, thus increasing the rate of production of electron donors, FADH2 and NADH. These electron donors generate a proton gradient across the inner mitochondrial membrane during ETC reactions. When the electrochemical potential difference generated by the proton gradient is high, the lifetime of the superoxide-generating electron-transport intermediates is prolonged (Brownlee, 2001). Beyond a threshold, superoxide production is markedly increased (Korshunov et al., 1997), thereby causing OxSt. Therefore, a reduction in the rate of production of ROS should reduce OxSt. We recently reported reduction of OxSt in the brain of diabetic mice by pharmacological inhibition of mitochondrial carbonic anhydrases (mCAs) (Price et al., 2012).
Carbonic anhydrases (CAs) catalyze a simple yet fundamental biologic reaction, CO2 hydration to produce bicarbonate (HCO3−) and protons (Shah et al., 2000). This reaction forms the basis for the regulation of acid–base balance in organisms. In addition, CAs participate in a number of other physiologic processes such as CO2 and HCO3− transport, bone resorption, production of body fluids, gluconeogenesis, ureagenesis, and lipogenesis (Sly and Hu, 1995). During evolution, at least 13 active CA isoenzymes have emerged in both rodents and humans. These isozymes have differences in their tissue distribution, kinetic properties, and subcellular localizations (Hilvo et al., 2005). Only two of the known isozymes, designated as CA VA and CA VB, are expressed in the mitochondria (Shah et al., 2000). These mCAs play an important role in the regulation of oxidative metabolism of glucose (Price et al., 2012).
We previously reported rescue of OxSt-induced cerebral PC loss in diabetic mice with topiramate (Price et al., 2012), a mCA inhibitor (Nishimori et al., 2005). The purpose of this study was to investigate the mechanism by which high glucose-induced OxSt causes PC death and to determine whether inhibition of mCA protects PCs from OxSt-induced apoptosis. To address these questions, we established conditionally immortalized cerebral pericytes (IPCs) from the Immortomouse (Scheef et al., 2009). The IPCs can be rapidly expanded under permissive conditions [33°C in the presence of interferon-γ (IFN-γ)] and can be readily passaged, frozen, and thawed. We show here that similar to PCs in primary culture, these cells expressed α-smooth muscle actin (α-SMA), neuron-glial 2 (NG2) proteoglycan, platelet-derived growth factor receptor-β (PDGFR-β), and aminopeptidase N (CD13) markers in both the early and the late passages. In addition, IPCs enhanced the transendothelial electric resistance (TEER) and reduced the permeability coefficient of brain EC monolayers in triple cocultures (Nakagawa et al., 2009) similar to PCs. The IPC had an expression pattern for CAs similar to PCs: presence of mCA VA and VB, but lack of cytosolic CA II, two transmembrane CAs (CA XII and CA XIV), and lack of the glycosylphosphatidylinositol (GPI)–anchored CA IV.
We now report, for the first time, that high glucose causes intracellular OxSt and PC death by apoptosis. We also provide evidence that high glucose-induced intracellular OxSt and PC apoptosis are significantly reduced upon pharmacological inhibition of mCA.
Materials and Methods
Animals
Immortomice expressing a temperature-sensitive Simian virus 40 large T antigen and male CD-1 mice were obtained from Charles River Laboratories (Charles River, Wilmington, MA). Male C57BL/6 mice were from Jackson Laboratories (Bar Harbor, ME). All animal experiments were conducted under protocols approved by the Institutional Animal Care and Use Committee.
Preparation of PCs
IPCs were isolated from Immortomice back-crossed to C57BL/6 mice (Scheef et al., 2009) according to the method of Hayashi et al. (2004) with modification. Briefly, brains from 5 to 10 mice (both female and male), ubiquitously expressing a thermolabile strain of tsA58 of the SV40 large T antigen (tsA58 Tag), were removed and placed in Dulbecco’s modified Eagle’s medium (DMEM) (low glucose; Sigma-Aldrich, St. Louis, MO) on ice. The meninges were removed by gently rolling half of a brain on a sterile filter. The white matter and choroid plexus were removed and the remaining tissue was cut into small pieces and incubated in 25 ml DMEM containing collagenase type II (1 mg/ml; Worthington, Lakewood, NJ) and DNase I (30 U/ml; Sigma-Aldrich) for 40 minutes at 37°C. After incubation, the digest was centrifuged at 500g for 10 minutes at 4°C. The supernatant was carefully removed by aspiration, and the pellet was mixed with 25 ml of 20% bovine serum albumin (BSA) prepared in DMEM, mixed well, and centrifuged at 1000g for 20 minutes at 4°C. The lipid layer on the top was carefully removed, and the pellet that contains the blood vessels was resuspended in 5 ml collagenase/dispase (1 mg/ml in serum-free DMEM containing 0.1% BSA) and DNase I (30 U/ml), and incubated at 37°C for 30 minutes. The digestion was resuspended by pipetting, centrifuged, and the cell pellet was washed once with 5 ml DMEM containing 10% fetal bovine serum (FBS). The pellet was resuspended in 1 ml growth medium consisting of DMEM with 10% FBS, 2 mM l-glutamine, penicillin/streptomycin (Sigma-Aldrich), and murine recombinant IFN-γ at 44 U/ml (R&D Systems, Minneapolis, MN), and plated into a well of 24-well plate. The cells were fed every 3–4 days, maintained at 33°C with 5% CO2, and expanded to larger tissue culture plates when confluent. Because microvessel fragments contain 2–3% PCs, the pure culture of cerebral PCs was obtained by prolonged culture of isolated brain microvessel fragments. Pericyte survival and proliferation was favored by selective culture conditions (Kis et al., 2002). Pericytes were characterized by their large size and rhomboid morphology, positive immunostaining for α-SMA and NG2 (Balabanov and Dore-Duffy, 1998), and the absence of platelet endothelial cell adhesion molecule (PECAM-1) and glial fibrillary acidic protein staining. By flow cytometry, 95% of the cells were positive for both NG2 and α-SMA. Less than 5% of the cells were either positive for NG2 or for α-SMA.
Characterization of IPCs
Fluorescence Activated Cell Sorting Analysis.
Mouse IPCs were dissociated with Trypsin-EDTA (T3924; Sigma-Aldrich). For immunostaining with anti-mouse PDGFR-β (eBioscience, San Diego, CA) and rat anti-mouse PECAM-1 (Mec13.3; BD Pharmingen, San Diego, CA), the cells were blocked with 5% FBS in phosphate-buffered saline (PBS) and incubated with an appropriate antibody for 30 minutes. After washing twice with 5% FBS in PBS, the cells were analyzed by fluorescence-activated cell sorter (FACS) analysis using a FACScanCalibur flow cytometer (Becton-Dickinson, Franklin Lakes, NJ). For anti-NG2 (MAB5384; Millipore, Temecula, CA), anti-human α-SMA (MAB1420; R&D Systems), and rabbit anti-CD13 (Abcam, Cambridge, MA) immunostaining, dissociated IPCs were fixed with 2% paraformaldehyde in PBS for 30 minutes and incubated with appropriate primary antibodies in permeabilization and blocking solution (0.1% BSA and 0.1% Triton X-100 in PBS) for 30 minutes. Cells were washed and incubated with the appropriate secondary antibody for 30 minutes, washed, and analyzed by flow cytometry, as described above. All incubations were at 4°C, and all antibodies were used at the dilutions recommended by the supplier. Cells incubated with secondary antibodies only were used as controls.
There are currently no specific markers for PCs. Staining with α-SMA, PDGFR-β, and NG2 is good, but not specific. Therefore, we considered biologic functions such as improvement of BBB function and IPC response to lipopolysaccharide (LPS) to further characterize these cells (see below).
TEER Analysis
Preparation of Cells.
Mouse brain ECs and PCs were isolated from 8-week-old male CD-1 mice according to published protocols by Coisne et al. (2005), Jacob et al. (2010), and Nakagawa et al. (2009), respectively. The glial cells were obtained from neonatal CD-1 mice, by published procedures (Coisne et al., 2005; Nakagawa et al., 2009). The purity of ECs was checked by positive immunostaining for factor VIII (Millipore), zona occludens-1 (Invitrogen, Carlsbad, CA), and claudin-5 (Abcam); of PCs for α-SMA, CD13, PDGFR-β; and of glial cells for glial fibrillary acidic protein (Abcam).
Construction of In Vitro BBB.
The triple culture Transwell model was set up according to published methods (Nakagawa et al., 2009). Briefly, glial cells (1 × 10⁵ cells/cm2) were seeded in the wells of Transwell plate and allowed to grow for 3 weeks. PCs or IPCs (1.5 × 10⁴ cells/cm2) were seeded on the bottom of the collagen-coated polyester membrane (0.33 cm2, 0.4 μm pore size) of the Transwell inserts (24-well type; Corning Costar, Corning, NY) and allowed to adhere firmly overnight. On the next day, brain ECs (1.5 × 10⁵ cells/cm2) were seeded on the inside of the inserts and incubated with glial cell cultures. The BBB models were maintained in an EC medium [DMEM/F12 supplemented with 10% plasma derived serum (Animal Technologies Inc., Tyler, TX), 1% GlutaMAX supplement (Invitrogen), basic fibroblast growth factor (1 ng/ml; Roche Applied Science, Indianapolis, IN), heparin (100μg/ml), insulin (5 μg/ml), transferrin (5 μg/ml), sodium selenite (5 ng/ml), and gentamicin (50 μg/ml)] supplemented with 500 nM hydrocortisone at 37°C in a humidified atmosphere of 5% CO2. TEER (in Ω × cm2) was measured using an EVOM resistance meter (World Precision Instruments, Sarasota, FL). The TEER of cell-free Transwell-Clear inserts were subtracted from the obtained values.
Transendothelial Permeability
For the transport experiments, brain ECs were washed with physiologic buffer (141 mM NaCl, 4.0 mM KCl, 2.8 mM CaCl2, 1.0 mM MgSO4, 1.0 mM NaH2PO4, 10 mM HEPES, 10 mM d-glucose, and 1% BSA, pH 7.4). The same buffer was added to the outside (abluminal chamber; 0.6 ml) of the Transwell insert. To initiate the transport experiments, 125I-albumin (5 × 10⁶ cpm/ml) and 14C-sucrose (1.5 × 10⁶ cpm/ml) were loaded on the luminal chamber. Samples (0.5 ml) were removed from the abluminal chamber at 10, 20, 30, and 45 minutes and immediately replaced with an equal volume of fresh physiologic buffer. 125I-Albumin samples were mixed with 30% trichloroacetic acid (TCA) (final concentration 15%) and centrifuged at 5400g for 10 minutes at 4°C. Radioactivity in the TCA precipitate was determined by a gamma counter, and radioactivity of 14C-sucrose in the collector compartments was measured by a liquid scintillation counter (Tri Carb 1900; Packard Instrument Company, PerkinElmer Life Sciences, Courtaboeuf, France). The permeability coefficient and clearance of TCA-precipitable 125I-albumin and 14C-sucrose were calculated as described (Dehouck et al., 1992).
Cytokines and Chemokines in IPCs
The IPCs seeded on 24-well culture plates (Corning Costar) were washed with serum-free DMEM/F12, and exposed to culture media with or without LPS from Salmonella typhimurium (L6511; Sigma-Aldrich) at 1 μg/ml for 24 hours, as described previously (Kovac et al., 2011). Culture supernatants were collected and stored at −80°C. The cytokines and chemokines were measured by a commercial magnetic bead multiple enzyme-linked immunosorbent assay kit (Bioplex; Bio-Rad, Hercules, CA) according to the manufacturer’s instructions.
Mitochondrial CA VA and CA VB in IPCs
Immunoblotting of the whole brain and IPC lysates and reverse-transcription polymerase chain reaction (RT-PCR) of total RNA from the whole brain and IPCs was as previously described (Price et al., 2012). Briefly, proteins (50 µg) were separated on 4–12% Bis-Tris (2-[bis(2-hydroxyethyl)amino]-2-(hydroxymethyl)propane-1,3-diol) reducing gels (NuPAGE Novex; Life Technologies, Carlsbad, CA) and transferred to nitrocellulose membranes for immunoblotting. Polypeptides were identified by probing with mCA VA and mCA VB primary antibodies (Price et al., 2012) and horseradish peroxidase-conjugated secondary antibodies and visualized by chemiluminescent substrate (Pierce, Rockford, IL). For RT-PCR, RNA (1 µg) was reverse transcribed with SuperScript III First Strand Synthesis System for RT-PCR (Invitrogen). The double-stranded DNA thus produced was used as a template for PCR amplification with specific primers for either CA VA or CA VB as described (Price et al., 2012).
Measurement of OxSt and Oxidative Damage
The IPCs were seeded in 60-mm petri dishes at 5 × 10⁴ cells/plate. Cells were treated for 5 days with normal glucose (5.7 mM), high glucose (40.7 mM), and high glucose with mCA inhibitors ethoxyzolamide (6-ethoxy-2-benzothiazolesulfonamide) or topiramate (10 or 100 µM). The cells were dissociated by trypsinization, resuspended in fresh media, and centrifuged. The pellets were analyzed for reduced glutathione (GSH), a measure of OxSt, and 4-hydroxy-trans-2-nonenal (HNE), a measure of oxidative damage caused by lipid peroxidation. The IPCs cultured in l-glucose (d-glucose 5.7 mM + l-glucose 35 mM) were used for osmolarity control.
To measure GSH, the cell pellets were resuspended in a serine–borate buffer (100 mM Tris–HCl, 10 mM borate, 5 mM serine, 1 mM diethylenetriaminepentaacetic acid, pH 7.0). GSH concentrations were determined by reverse-phase high-performance liquid chromatography as previously described (Price et al., 2012).
For lipid peroxidation determination, the cell pellets were resuspended in lysis buffer [0.5% Triton X-100, 20 mM Tris (pH 7.4), 0.15 M NaCl, 2 mM EDTA, 1 mM EGTA, and a protease inhibitor cocktail (#78429; Thermo Scientific)], sonicated, and centrifuged at 14,000g for 15 minutes: final supernatants were used for detection of HNE by immunoblotting as previously described (Price et al., 2012).
Measurement of Mitochondrial ROS
Mitochondrial ROS in the IPC were measured using MitoSOX Red (Invitrogen), a fluorogenic live-cell permeant dye that is chemically and selectively targeted to mitochondria. Once in the mitochondria, MitoSOX is oxidized by superoxide and exhibits red fluorescence (excitation 510 nm/emission 580 nm). The IPCs were plated on coverslips at a density of 2000 cells/coverslip and allowed to adhere overnight. The cells were then treated with normal glucose (5.7 mM) or normal glucose with or without ethoxyzolamide or topiramate at 100 µM, overnight. After incubation, the cells were washed with Hank’s balanced salt solution (with Ca/Mg) and exposed to normal glucose or high glucose (40.7 mM) for 30 minutes. At the end of the incubation, cells were washed as before and incubated for 5 minutes with 2.5 µM MitoSOX, prepared in dimethylsulfoxide immediately prior to the experiment. The cells were thereafter washed with Hank’s balanced salt solution and counterstained with Hoechst (1:5000). The digital images were taken by a microscope Olympus BX60 (Olympus Corporation, Tokyo, Japan) with fluorescence equipment. Images were captured using 40× oil immersion objective lens.
Programmed Cell Death Analysis
Apoptotic cell death was determined by terminal deoxynucleotidyl transferase–mediated digoxigenin-deoxyuridine nick-end labeling (TUNEL) staining. The IPCs were grown for 5 days on the fibronectin-coated (2 μg/ml) 4-well Nunc chamber slides (Thermo Fisher Scientific) under normal glucose, high glucose, or high glucose containing 10 or 100 μM of either ethoxyzolamide or topiramate. After incubation, cells were fixed with 4% paraformaldehyde for 15 minutes at room temperature and washed with PBS twice. TUNEL staining was performed using Click-iT TUNEL Alexa Fluor 594, as recommended by the supplier (Invitrogen). Cells were counterstained with Hoechst dye for the nuclei and photographed using a Zeiss fluorescence microscope (Axiophot; Carl Zeiss, Oberkochen, Germany) equipped with a digital camera. TUNEL-positive cells were counted and calculated as a percentage of the total cell number. The results are from three independent experiments.
Statistical Analysis
All means are reported with their n and S.E.M. Two means were compared by the unpaired two-tailed Student’s t test. For more than two means, analysis of variance was used, followed by Newman–Keuls multiple comparison test. P < 0.05 was considered significant. Statistical analyses were made using the GraphPad Prism 5.0 software package (GraphPad Software Inc., La Jolla, CA).
Results
Characterization of IPCs
Morphologic Characterization of IPCs.
The IPCs exhibited the same irregular and stellate morphology as the PC (Fig. 1A). To further assess similarities between IPCs and PCs, we analyzed IPCs for the expression of PC markers by FACS analysis. The PC markers PDGFR-β (Fig. 1B), α-SMA (Fig. 1C), NG2 (Fig. 1D), and CD13 (Fig. 1E) were all expressed by IPCs in both early and late passages. PECAM-1, an EC marker, was not detected in IPCs (Fig. 1F).
Fig. 1.

Characterization of IPCs. (A) Morphology of IPCs cultured on uncoated plates (10x magnification). IPCs were stained for PDGFR-β (B), α-SMA (C), NG2 (D), and CD13 (E), all of which were expressed in IPCs. (F) PECAM-1, an EC marker, is not detected in IPCs. Histogram data are presented as cell numbers versus log fluorescence intensity of individual cell markers. The controls, shaded histograms, were either cells without antibody (B and F) or treated with a secondary antibody (C–E) only. These experiments were performed three times with similar results.
Physiologic Relevance of IPCs.
To ascertain the physiologic relevance of IPCs, triple culture Transwell BBB models were set up with brain EC, glial cells, and either PCs or IPCs. Double coculture BBB models, without PCs (Fig. 2A) were used as controls. Both PCs and IPCs (Fig. 2A) caused statistically higher TEER compared with the double coculture model (P < 0.001). 14C-Sucrose permeability of brain EC was significantly decreased in the models constructed with either PCs or IPCs compared with the BBB model without PCs (P < 0.01; Fig. 2B). A slight decrease in permeability to 125I-albumin (Fig. 2C) observed in the presence of PCs or IPCs, did not reach statistical significance (Fig. 2C).
Fig. 2.

Comparison of TEER and transendothelial permeability of BBB models. The triple models constructed with IPCs imposed the same TEER (A) and transendothelial permeability (B and C) as the ones constructed with PCs compared with the double models without PCs. The TEER (expressed as Ω × cm2) was higher (A) and transendothelial permeability coefficient (Pe) [expressed as (cm/min) × 10−3] was lower for paracellular markers, 14C-sucrose (B) and 125I-albumin (C), in the presence of either PCs or IPCs. All data are presented as mean ± S.E.M. (n = 4). **P < 0.01; ***P < 0.001.
LPS Stimulated Release of Cytokines and Chemokines by IPCs
To further ascertain the functional similarity between PCs and IPCs, cytokine and chemokine release in response to LPS treatment was assessed. Of 22 cytokines and chemokines, 10 were secreted constitutively by IPCs and 16 of 22 were secreted with stimulation by LPS (Table 1).
TABLE 1.
Effect of LPS on the release of cytokines and chemokines by IPCs
IPCs were exposed to LPS (1 µg/ml) for 24 hours. Values are mean ± S.E.M. n = 5.
| Cytokine/Chemokine | Control | Treated |
|---|---|---|
| pg/ml | pg/ml | |
| IL-1α | 0.26 ± 0.05 | 0.42 ± 0.03* |
| IL-1β | N.D. | 5.54 ± 0.56 |
| IL-4 | 0.55 ± 0.06 | 1.42 ± 0.02** |
| IL-5 | 1.66 ± 0.09 | 2.58 ± 0.11** |
| IL-6 | 2.34 ± 0.49 | 522.55 ± 50.06** |
| IL-12 (p40) | N.D. | 0.73 ± 0.29 |
| IL-12 (p70) | N.D. | 5.24 ± 0.70 |
| IL-13 | N.D. | 20.08 ± 2.30 |
| IL-17 | 1.47 ± 0.07 | 2.44 ± 0.14** |
| GM-CSF | 1.12 ± 0.06 | 22.65 ± 1.64** |
| KC | 306.56 ± 22.91 | 37,631.75 ± 16,842.57 |
| MCP-1 | 3544.39 ± 209.10 | 11,930.87 ± 386.03** |
| MIP-1α | 1.38 ± 0.14 | 15.50 ± 1.32** |
| MIP-1β | N.D. | 3.04 ± 0.25 |
| RANTES | 147.46 ± 13.88 | 844.01 ± 122.29** |
| TNF-α | N.D. | 5.85 ± 0.09 |
GM-CSF, granulocyte macrophage colony-stimulating factor; IL, interleukin; IPC, conditionally immortalized cerebral pericyte; KC, keratinocyte-derived chemokine; LPS, lipopolysaccharide; MCP-1, monocyte chemo-attractant protein-1; MIP, macrophage inflammatory protein; N.D., not detected; RANTES, regulated on activation normal T cell expressed and secreted; TNF-α, tumor necrosis factor.
P < 0.05; **P < 0.01 for difference from controls.
Together, these results showed that IPCs have morphologic and physiologic characteristics similar to those of cerebral PCs.
Mitochondrial CA in IPCs
Previously, we showed by RT-PCR and immunoblotting that cerebral PCs express mCA (Price et al., 2012). Using the same techniques, we now confirm the expression of both mCA mCA VA and VB (Fig. 3) in IPCs. Also similar to PCs, CA II (cytosolic), CA XII and CA XIV (two transmembrane), and CA IV (GPI-anchored) were not detected in IPCs.
Fig. 3.
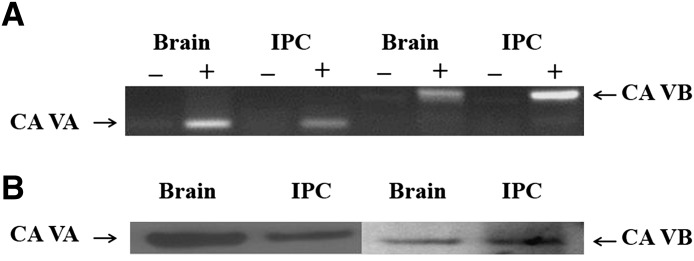
Mitochondrial CA VA and VB in IPCs. (A) Transcripts of CA VA and CA VB in IPCs and the brain. Plus and minus signs indicate with and without reverse transcriptase, respectively. (B) Polypeptides of CA VA and CA VB in IPCs and the brain.
Effect of Inhibition of mCA on OxSt in IPCs
The cells were incubated under normal glucose (5.7 mM) or high glucose (40.7 mM) conditions for 5 days. Mitochondrial CA (mCA) inhibitors, ethoxyzolamide or topiramate (10 µM and 100 µM), were added to the high glucose media at the start of the experiment. Compared with normal glucose, high glucose caused significant OxSt in IPCs, as indicated by a decrease in intracellular GSH (Fig. 4, A and B). Treatment with ethoxyzolamide significantly increased GSH at 10 μM (P < 0.001) and at 100 µM (P < 0.0001) compared with high glucose alone (Fig. 4A). Similarly, topiramate treatment reduced high glucose-induced OxSt (Fig. 4B) by significantly increasing GSH at both 10 μM (P < 0.01) and 100 μM (P < 0.001).
Fig. 4.

Effect of pharmacological inhibition of mCA on high glucose-induced GSH levels in IPCs. The IPCs were exposed to normal glucose (5.7 mM), high glucose (40.7 mM), or high glucose with mCA inhibitors ethoxyzolamide or topiramate for 5 days. The GSH levels were measured by high-performance liquid chromatography. High glucose-induced significant reduction in GSH levels (A and B) was restored upon treatment with ethoxyzolamide (A) and topiramate (B) at both concentrations (10 and 100 µM) of the inhibitors used. The values are expressed as mean ± S.E.M. (n = 3). The graph is representative of three independent experiments. *P < 0.01; **P < 0.001; ***P < 0.0001. ETZ, ethoxyzolamide; HG, high glucose; NG, normal glucose; TOP, topiramate.
Lipid peroxidation, an indicator of oxidative damage, was assessed by the levels of protein-bound HNE, a stable byproduct of lipid peroxidation. The protein-bound HNE levels were significantly increased in IPCs exposed to high glucose (Fig. 5, A and B). The treatment with ethoxyzolamide significantly reduced high glucose-induced protein-bound HNE (Fig. 5A) at both concentrations used (P < 0.01 and P < 0.0001 at 10 μM and 100 μM, respectively). Topiramate treatment significantly reduced high glucose-induced protein-bound HNE at 100 µM (P < 0.0001; Fig. 5C).
Fig. 5.

Effect of pharmacological inhibition of mCA on high glucose-induced lipid peroxidation in IPCs. After exposure to normal glucose (NG, 5.7 mM), high glucose (HG, 40.7 mM), or high glucose with mCA inhibitors ethoxyzolamide or topiramate for 5 days. The HNE levels in IPCs were measured by immunoblotting. High glucose-induced significant increase in HNE (A and C) was almost completely reversed upon treatment with ethoxyzolamide (A) and topiramate (C) at both concentrations (10 and 100 µM) of the inhibitors used. (B) and (D) are the representative immunoblots of protein-bound HNE. The values are expressed as mean ± S.E.M. (n = 3). The graph is representative of three independent experiments. *P < 0.01; **P < 0.001; ***P < 0.0001. ETZ, ethoxyzolamide; HG, high glucose; NG, normal glucose; TOP, topiramate.
Effect of Inhibition of mCA on High Glucose-Induced Mitochondrial ROS in IPCs
The IPCs were grown overnight in normal glucose (5.7 mM) with or without ethoxyzolamide or topiramate and then treated with high glucose (40.7 mM) for 30 minutes. The cells treated with high glucose showed an increase in mitochondrial ROS as indicated by the intensity of the signal as well as by the number of cells exhibiting the signal (Supplemental Fig. 1). Treatment with both ethoxyzolamide and topiramate attenuated high glucose-induced mitochondrial ROS in these cells (Supplemental Fig. 1).
Effect of Pharmacological Inhibition of mCA on High Glucose-Induced IPC Apoptosis
For TUNEL assays, cells were incubated under normal glucose, high glucose, and high glucose with or without mCA inhibitors conditions, as described above. The percent of TUNEL-positive IPCs grown in normal glucose, high glucose, and high glucose with ethoxyzolamide or with topiramate are shown in Fig. 6, A and B, respectively. Exposure (5 days) to high glucose caused a significant increase in the percentage of apoptotic cells (Fig. 6, A and B) compared with normal glucose. Ethoxyzolamide treatment significantly reduced the number of high glucose-induced apoptotic cells (Fig. 6A) at both concentrations (P < 0.01). Similarly, topiramate treatment resulted in a significant decrease in the percentage of apoptotic IPCs (P < 0.0001) compared with high glucose (Fig. 6B). Representative TUNEL images of IPCs in normal glucose, high glucose, and high glucose with 10 and 100 µM ethoxyzolamide or topiramate are presented in Supplemental Fig. 2. The cells cultured in l-glucose (osmolarity control d-glucose 5.7 mM + l-glucose 35mM) for 5 days did not show OxSt or apoptosis.
Fig. 6.

Effect of pharmacological inhibition of mCA on high glucose-induced apoptosis of IPCs. The cells plated on chamber slides were treated with normal glucose (5.7 mM), high glucose (40.7 mM), or high glucose with 10 and 100 μM of either ethoxyzolamide or topiramate for 5 days and stained for TUNEL. A significant increase in TUNEL-positive IPCs (A and B) was reversed by ethoxyzolamide (A) and topiramate (B) treatment at both concentrations. The nuclei were counterstained with Hoechst. The TUNEL-positive cells are presented as a percentage of total cell numbers. The values are expressed as mean ± S.E.M. (n = 3). *P < 0.01; **P < 0.001; ***P < 0.0001. ETZ, ethoxyzolamide; HG, high glucose; NG, normal glucose; TOP, topiramate.
Discussion
The main findings of this study showed that the PCs exhibit OxSt and apoptosis responses when exposed to high glucose. Both high glucose-induced OxSt and apoptosis of PCs were rescued by pharmacological inhibition of mCA.
The PCs in immediate contact with the specialized EC of cerebral microvasculature comprising the BBB are vital for integrity of the latter and are especially susceptible to OxSt. Loss of PCs results in a focal increase in BBB permeability (Bonkowski et al., 2011). A close correlation between PC density and BBB permeability has been reported in PC-deficient adult mice (Armulik et al., 2010). Recently, we reported hyperglycemia-induced OxSt in the brain and cerebral PC loss in diabetic mice (Price et al., 2012). Clinical evidence suggests that diabetes-induced changes in the BBB may be a predisposing factor for Alzheimer’s disease (Ristow, 2004) and people suffering from both types of diabetes have an increased risk of cognitive impairment (Whitmer, 2007; Bruce et al., 2008; Tiehuis et al., 2008). Thus, determining the pathophysiological role of hyperglycemia in PCs is an important step toward understanding the altered neuronal function and increased susceptibility to cerebrovascular diseases.
Hyperglycemia causes OxSt by generating pathologic levels of ROS during accelerated oxidative metabolism of glucose (Du et al., 2000; Nishikawa et al., 2000). ROS are produced as a byproduct of oxidative metabolism of glucose and play important physiologic functions (Dröge, 2002). The following is a brief description of the mechanism of production of ROS in the mitochondria during oxidative metabolism. Glucose is metabolized to pyruvate in the cytosol by glycolysis. Pyruvate enters mitochondria and is carboxylated to oxaloacetate, a key intermediate in the Krebs cycle/ETC pathways. The carboxylation of pyruvate to oxaloacetate requires HCO3−. Because mitochondria are impermeant to HCO3− (Dodgson et al., 1980; Hazen et al., 1997; Parkkila et al., 1998) the latter must be produced inside the mitochondria. mCAs provide HCO3− inside the mitochondria by catalyzing reversible hydration of CO2 (CO2 + H2O ↔ HCO3− + H+). Pharmacological inhibition of mCA slows down the production of HCO3−, limits Krebs cycle/ETC, and thus slows down the production of ROS and subsequent OxSt. We recently showed that pharmacological inhibition of mCA rescues OxSt-induced PC loss in diabetic mouse brain (Price et al., 2012). These findings provide evidence that mCA inhibition may protect BBB from the damage caused by OxSt, thus making mCA a new therapeutic target for OxSt-related illnesses of the brain. Pyruvate that builds up in the process is shuttled through anaerobic metabolism (aerobic glycolysis) to produce ATP without producing superoxide. Aerobic glycolysis is not harmful and indeed is preferred by fast-growing cells (Vander Heiden et al., 2009).
To facilitate the determination of the effect of high glucose on intracellular OxSt in PCs and to investigate a mechanism for PC death, we prepared IPC cultures from Immortomice (Fig. 1A). Unlike PCs, the IPCs can be readily expanded and manipulated in culture for numerous passages without loss of their characteristics. The Immortomouse expresses a thermolabile strain (tsA58) of the SV40 large T antigen (tsA58 Tag) driven by an inducible major histocompatibility complex H-2K promoter, thus eliminating many intrinsic problems with immortalized lines (Lidington et al., 2002). T antigen expression is functionally evident at the reduced temperature of 33°C and was enhanced in the presence of IFN-γ. Generally, incubation at 37°C in the absence of IFN-γ results in a loss of large T antigen within 48 hours (Lidington et al., 2002). Recently, Dore-Duffy et al., (Dore-Duffy et al., 2011) reported a conditionally immortalized cerebral PC cell line established from Immortomice. However, unlike IPCs, these cells are α-SMA negative and proliferate slowly under permissive conditions (33°C, in the presence of IFN-γ) and are largely quiescent.
The IPCs share the morphologic (Fig. 1) and physiologic (Fig. 2) characteristics of PCs. The IPCs were also capable of secreting cytokines and chemokines both constitutively and in response to LPS (Table 1), a characteristic similar to that recently reported by us in PCs (Kovac et al., 2011). When grown in high glucose media, IPCs showed significant OxSt (Figs. 4 and 5) and apoptosis (Fig. 6). Both high glucose-induced OxSt (Figs. 4 and 5) and apoptosis (Fig. 6) were rescued by the pharmacological inhibition of mCA with either ethoxyzolamide or topiramate.
We previously used topiramate (Nishimori et al., 2005) to reduce OxSt and PC loss in vivo in the mouse brain (Price et al., 2012). However, topiramate, in addition to its CA inhibitory activity, has effects on Na+-independent Cl−/HCO3− channels, sodium channels, and calcium channels (Leniger et al., 2004). Therefore, in this study, we included ethoxyzolamide (Hazen et al., 1997), which is viewed as a relatively pure CA inhibitor. Use of both of these clinically available drugs increases the assurance that effects found are attributable to CA inhibition. The significant reduction of intracellular OxSt (Figs. 4 and 5), mitochondrial ROS (Supplemental Fig. 1) and apoptosis (Fig. 6; Supplemental Fig. 2) of IPCs is most likely from the ability of ethoxyzolamide and topiramate to inhibit mCAs rather than their discordant mechanisms.
Both ethoxyzolamide and topiramate also inhibit isozymes of CAs other than mCA. Previously, we published that a cytosolic CA (CA II), two transmembrane CAs (CA XII and CA XIV), and a GPI-anchored CA (CA IV) are not expressed in cerebral PCs (Price et al., 2012). We now report the absence of these same CA isoforms in IPCs. Lack of CA II, CA XII, CA XIV, and CA IV expression in IPCs gives credence to our hypothesis that the effects of ethoxyzolamide and topiramate on the reduction of OxSt and apoptosis are due to the inhibition of mCA, amply expressed in IPCs (Fig. 3). Studies are underway in our laboratories to investigate the effect of high glucose on OxSt and apoptosis in cerebral IPCs that are null for both mCA VA and mCA VB.
Topiramate, in combination with phentermine, has recently been approved for the treatment of obesity. We suggest that an additional benefit of such treatment will be protection from the glucotoxicity of diabetes, such as diabetic retinopathy and other central nervous system manifestation, beyond that accountable from changes in blood glucose levels.
In addition to providing important mechanistic information about diabetic neuropathy, our studies define mCA as a novel molecular pathway that could be targeted in OxSt-related illnesses of the central nervous system. CA inhibitors are commercially available, are in clinical use for other conditions, and are relatively well tolerated (Gadde et al., 2011). The therapeutic use of CA inhibitors in conditions in which glucose-induced OxSt contributes to pathology, such as the damage to microvasculature of the brain seen in diabetes mellitus, deserves further study.
Supplementary Material
Acknowledgments
The authors thank Ping Patrick (Saint Louis University) and Xinsheng Zhang (Missouri University of Science and Technology) for technical assistance, and Barbara Harris (Missouri University of Science and Technology) for editorial assistance.
Abbreviations
- α-SMA
smooth muscle actin α-subunit
- BBB
blood–brain barrier
- Bis-Tris
2-[bis(2-hydroxyethyl)amino]-2-(hydroxymethyl)propane-1,3-diol
- BSA
bovine serum albumin
- CA
carbonic anhydrase
- CD13
aminopeptidase N
- DMEM
Dulbecco’s modified Eagle’s medium
- EC
endothelial cell
- ETC
electron transport chain
- FACS
fluorescence-activated cell sorter
- FBS
fetal bovine serum
- GPI
glycosylphosphatidylinositol
- GSH
reduced glutathione
- HCO3−
bicarbonate
- HNE
4-hydroxy-2-trans-nonenal
- IFN-γ
interferon gamma
- IPC
conditionally immortalized cerebral pericyte
- LPS
lipopolysaccharide
- mCA
mitochondrial carbonic anhydrase
- NG2
neuron-glial 2
- OxSt
oxidative stress
- PBS
phosphate-buffered saline
- PC
pericyte
- PDGFR-β
platelet-derived growth factor receptor β
- PECAM-1
platelet endothelial cell adhesion molecule-1
- ROS
reactive oxygen species
- RT-PCR
reverse-transcription polymerase chain reaction
- SV40
Simian virus 40
- TCA
trichloroacetic acid
- TEER
transendothelial electric resistance
- TUNEL
terminal deoxynucleotidyl transferase–mediated digoxigenin-deoxyuridine nick-end labeling
Authorship Contributions
Participated in research design: Shah, Banks, Sheibani.
Conducted experiments: Price, Morofuji, Kovac, Shin.
Contributed new reagents or analytic tools: Sorenson, Sheibani.
Performed data analysis: Shah, Price, Morofuji, Kovac, Shin.
Wrote or contributed to the writing of the manuscript: Shah, Price, Banks, Kovac, Ercal, Sheibani.
Footnotes
This study was supported by the National Institutes of Health [Grants R01-DK083485, RC4-EY021357, EY016695, P30-EY016665, and P30-CA014520].
 This article has supplemental material available at jpet.aspetjournals.org.
References
- Armulik A, Genové G, Mäe M, Nisancioglu MH, Wallgard E, Niaudet C, He L, Norlin J, Lindblom P, Strittmatter K, et al. (2010) Pericytes regulate the blood-brain barrier. Nature 468:557–561 [DOI] [PubMed] [Google Scholar]
- Balabanov R, Dore-Duffy P. (1998) Role of the CNS microvascular pericyte in the blood-brain barrier. J Neurosci Res 53:637–644 [DOI] [PubMed] [Google Scholar]
- Bonkowski D, Katyshev V, Balabanov RD, Borisov A, Dore-Duffy P. (2011) The CNS microvascular pericyte: pericyte-astrocyte crosstalk in the regulation of tissue survival. Fluids Barriers CNS 8:8. [DOI] [PMC free article] [PubMed] [Google Scholar]
- Brownlee M. (2001) Biochemistry and molecular cell biology of diabetic complications. Nature 414:813–820 [DOI] [PubMed] [Google Scholar]
- Bruce DG, Davis WA, Casey GP, Starkstein SE, Clarnette RM, Almeida OP, Davis TM. (2008) Predictors of cognitive decline in older individuals with diabetes. Diabetes Care 31:2103–2107 [DOI] [PMC free article] [PubMed] [Google Scholar]
- Chen Q, Vazquez EJ, Moghaddas S, Hoppel CL, Lesnefsky EJ. (2003) Production of reactive oxygen species by mitochondria: central role of complex III. J Biol Chem 278:36027–36031 [DOI] [PubMed] [Google Scholar]
- Coisne C, Dehouck L, Faveeuw C, Delplace Y, Miller F, Landry C, Morissette C, Fenart L, Cecchelli R, Tremblay P, et al. (2005) Mouse syngenic in vitro blood-brain barrier model: a new tool to examine inflammatory events in cerebral endothelium. Lab Invest 85:734–746 [DOI] [PubMed] [Google Scholar]
- Dehouck MP, Jolliet-Riant P, Brée F, Fruchart JC, Cecchelli R, Tillement JP. (1992) Drug transfer across the blood-brain barrier: correlation between in vitro and in vivo models. J Neurochem 58:1790–1797 [DOI] [PubMed] [Google Scholar]
- Dodgson SJ, Forster RE, 2nd, Storey BT, Mela L. (1980) Mitochondrial carbonic anhydrase. Proc Natl Acad Sci USA 77:5562–5566 [DOI] [PMC free article] [PubMed] [Google Scholar]
- Dore-Duffy P, Mehedi A, Wang X, Bradley M, Trotter R, Gow A. (2011) Immortalized CNS pericytes are quiescent smooth muscle actin-negative and pluripotent. Microvasc Res 82:18–27 [DOI] [PMC free article] [PubMed] [Google Scholar]
- Dore-Duffy P. (2008) Pericytes: pluripotent cells of the blood brain barrier. Curr Pharm Des 14:1581–1593 [DOI] [PubMed] [Google Scholar]
- Dore-Duffy P, Katychev A, Wang X, Van Buren E. (2006) CNS microvascular pericytes exhibit multipotential stem cell activity. J Cereb Blood Flow Metab 26:613–624 [DOI] [PubMed] [Google Scholar]
- Dröge W. (2002) Free radicals in the physiological control of cell function. Physiol Rev 82:47–95 [DOI] [PubMed] [Google Scholar]
- Du XL, Edelstein D, Rossetti L, Fantus IG, Goldberg H, Ziyadeh F, Wu J, Brownlee M. (2000) Hyperglycemia-induced mitochondrial superoxide overproduction activates the hexosamine pathway and induces plasminogen activator inhibitor-1 expression by increasing Sp1 glycosylation. Proc Natl Acad Sci USA 97:12222–12226 [DOI] [PMC free article] [PubMed] [Google Scholar]
- Gadde KM, Allison DB, Ryan DH, Peterson CA, Troupin B, Schwiers ML, Day WW. (2011) Effects of low-dose, controlled-release, phentermine plus topiramate combination on weight and associated comorbidities in overweight and obese adults (CONQUER): a randomised, placebo-controlled, phase 3 trial. Lancet 377:1341–1352 [DOI] [PubMed] [Google Scholar]
- Giugliano D, Ceriello A, Paolisso G. (1996) Oxidative stress and diabetic vascular complications. Diabetes Care 19:257–267 [DOI] [PubMed] [Google Scholar]
- Hayashi K, Nakao S, Nakaoke R, Nakagawa S, Kitagawa N, Niwa M. (2004) Effects of hypoxia on endothelial/pericytic co-culture model of the blood-brain barrier. Regul Pept 123:77–83 [DOI] [PubMed] [Google Scholar]
- Hazen SA, Waheed A, Sly WS, LaNoue KF, Lynch CJ. (1997) Effect of carbonic anhydrase inhibition and acetoacetate on anaplerotic pyruvate carboxylase activity in cultured rat astrocytes. Dev Neurosci 19:162–171 [DOI] [PubMed] [Google Scholar]
- Hilvo M, Tolvanen M, Clark A, Shen B, Shah GN, Waheed A, Halmi P, Hänninen M, Hämäläinen JM, Vihinen M, et al. (2005) Characterization of CA XV, a new GPI-anchored form of carbonic anhydrase. Biochem J 392:83–92 [DOI] [PMC free article] [PubMed] [Google Scholar]
- Jacob A, Hack B, Chiang E, Garcia JG, Quigg RJ, Alexander JJ. (2010) C5a alters blood-brain barrier integrity in experimental lupus. FASEB J 24:1682–1688 [DOI] [PMC free article] [PubMed] [Google Scholar]
- Kis B, Kaiya H, Nishi R, Deli MA, Abrahám CS, Yanagita T, Isse T, Gotoh S, Kobayashi H, Wada A, et al. (2002) Cerebral endothelial cells are a major source of adrenomedullin. J Neuroendocrinol 14:283–293 [DOI] [PubMed] [Google Scholar]
- Korshunov SS, Skulachev VP, Starkov AA. (1997) High protonic potential actuates a mechanism of production of reactive oxygen species in mitochondria. FEBS Lett 416:15–18 [DOI] [PubMed] [Google Scholar]
- Kovac A, Erickson MA, Banks WA. (2011) Brain microvascular pericytes are immunoactive in culture: cytokine, chemokine, nitric oxide, and LRP-1 expression in response to lipopolysaccharide. J Neuroinflammation 8:139. [DOI] [PMC free article] [PubMed] [Google Scholar]
- Kowluru RA. (2001) Diabetes-induced elevations in retinal oxidative stress, protein kinase C and nitric oxide are interrelated. Acta Diabetol 38:179–185 [DOI] [PubMed] [Google Scholar]
- Kowluru RA, Abbas SN, Odenbach S. (2004) Reversal of hyperglycemia and diabetic nephropathy: effect of reinstitution of good metabolic control on oxidative stress in the kidney of diabetic rats. J Diabetes Complications 18:282–288 [DOI] [PubMed] [Google Scholar]
- Leniger T, Thöne J, Wiemann M. (2004) Topiramate modulates pH of hippocampal CA3 neurons by combined effects on carbonic anhydrase and Cl-/HCO3- exchange. Br J Pharmacol 142:831–842 [DOI] [PMC free article] [PubMed] [Google Scholar]
- Lidington EA, Rao RM, Marelli-Berg FM, Jat PS, Haskard DO, Mason JC. (2002) Conditional immortalization of growth factor-responsive cardiac endothelial cells from H-2K(b)-tsA58 mice. Am J Physiol Cell Physiol 282:C67–C74 [DOI] [PubMed] [Google Scholar]
- Liu Y, Fiskum G, Schubert D. (2002) Generation of reactive oxygen species by the mitochondrial electron transport chain. J Neurochem 80:780–787 [DOI] [PubMed] [Google Scholar]
- Nakagawa S, Deli MA, Kawaguchi H, Shimizudani T, Shimono T, Kittel A, Tanaka K, and Niwa M (2009) A new blood-brain barrier model using primary rat brain endothelial cells, pericytes and astrocytes. Neurochem Int 54:253–263. [DOI] [PubMed]
- Nishikawa T, Edelstein D, Du XL, Yamagishi S, Matsumura T, Kaneda Y, Yorek MA, Beebe D, Oates PJ, Hammes HP, et al. (2000) Normalizing mitochondrial superoxide production blocks three pathways of hyperglycaemic damage. Nature 404:787–790 [DOI] [PubMed] [Google Scholar]
- Nishimori I, Vullo D, Innocenti A, Scozzafava A, Mastrolorenzo A, Supuran CT. (2005) Carbonic anhydrase inhibitors. The mitochondrial isozyme VB as a new target for sulfonamide and sulfamate inhibitors. J Med Chem 48:7860–7866 [DOI] [PubMed] [Google Scholar]
- Parkkila AK, Scarim AL, Parkkila S, Waheed A, Corbett JA, Sly WS. (1998) Expression of carbonic anhydrase V in pancreatic beta cells suggests role for mitochondrial carbonic anhydrase in insulin secretion. J Biol Chem 273:24620–24623 [DOI] [PubMed] [Google Scholar]
- Price TO, Eranki V, Banks WA, Ercal N, Shah GN. (2012) Topiramate treatment protects blood-brain barrier pericytes from hyperglycemia-induced oxidative damage in diabetic mice. Endocrinology 153:362–372 [DOI] [PMC free article] [PubMed] [Google Scholar]
- Ristow M. (2004) Neurodegenerative disorders associated with diabetes mellitus. J Mol Med (Berl) 82:510–529 [DOI] [PubMed] [Google Scholar]
- Scheef EA, Sorenson CM, Sheibani N. (2009) Attenuation of proliferation and migration of retinal pericytes in the absence of thrombospondin-1. Am J Physiol Cell Physiol 296:C724–C734 [DOI] [PMC free article] [PubMed] [Google Scholar]
- Shah GN, Hewett-Emmett D, Grubb JH, Migas MC, Fleming RE, Waheed A, Sly WS. (2000) Mitochondrial carbonic anhydrase CA VB: differences in tissue distribution and pattern of evolution from those of CA VA suggest distinct physiological roles. Proc Natl Acad Sci USA 97:1677–1682 [DOI] [PMC free article] [PubMed] [Google Scholar]
- Sly WS, Hu PY. (1995) Human carbonic anhydrases and carbonic anhydrase deficiencies. Annu Rev Biochem 64:375–401 [DOI] [PubMed] [Google Scholar]
- Tiehuis AM, van der Graaf Y, Visseren FL, Vincken KL, Biessels GJ, Appelman AP, Kappelle LJ, Mali WP, SMART Study Group (2008) Diabetes increases atrophy and vascular lesions on brain MRI in patients with symptomatic arterial disease. Stroke 39:1600–1603 [DOI] [PubMed] [Google Scholar]
- Vander Heiden MG, Cantley LC, Thompson CB. (2009) Understanding the Warburg effect: the metabolic requirements of cell proliferation. Science 324:1029–1033 [DOI] [PMC free article] [PubMed] [Google Scholar]
- Whitmer RA. (2007) Type 2 diabetes and risk of cognitive impairment and dementia. Curr Neurol Neurosci Rep 7:373–380 [DOI] [PubMed] [Google Scholar]
Associated Data
This section collects any data citations, data availability statements, or supplementary materials included in this article.