Abstract
Accurate protein identification and quantitation are critical when interpreting the biological relevance of large-scale shotgun proteomics datasets. Although significant technical advances in peptide and protein identification have been made, accurate quantitation of high throughput datasets remains a key challenge in mass spectrometry data analysis and is a labor intensive process for many proteomics laboratories. Here, we report a new SILAC-based proteomics quantitation software tool, named IsoQuant, which is used to process high mass accuracy mass spectrometry data. IsoQuant offers a convenient quantitation framework to calculate peptide/protein relative abundance ratios. At the same time, it also includes a visualization platform that permits users to validate the quality of SILAC peptide and protein ratios. The program is written in the C# programming language under the Microsoft .NET framework version 4.0 and has been tested to be compatible with both 32-bit and 64-bit Windows 7. It is freely available to non-commercial users at http://www.proteomeumb.org/MZw.html.
Keywords: Quantitative proteomics, mass spectrometry, SILAC, bioinformatics
INTRODUCTION
Mass spectrometry-based proteomics approaches can provide valuable qualitative and quantitative information regarding not only protein identification, but also protein-protein interaction, and the dynamics of protein expression levels 1. Accurate protein quantitation is required in order to make meaningful biological inferences from mass spectrometry data. In proteomics experiments, qualitative data is obtained by identifying candidate proteins with an acceptable false positive identification rate. Several commercially available database search programs, such as SEQUEST 2 and Mascot 3, and open-source database search programs including X!Tandem 4, Protein Prospector 5, ProbID 6, OMSSA 7, ProSight 8 and InsPecT 9 are available for this purpose. Although many software programs have been developed for quantitative proteomic analysis, certain challenges pertaining to reliable and accurate quantitation still remain 10.
Several methodologies are currently available for mass spectrometry-based protein quantitation including stable isotope labeling (chemical, enzymatic, or metabolic) and label-free strategies. SILAC (stable isotope labeling by amino acids in cell culture) 11,12 is a metabolic labeling method whereby stable isotope-labeled amino acids (typically Lys and Arg) are incorporated into proteins as they are synthesized, thereby resulting in robust peptide and protein quantitation ratios. SILAC has significant advantages as compared to chemical labeling strategies, such as iTRAQ and TMT, since the labeling event occurs at the beginning of the sample preparation procedure. Consequently, less confounding factors influence the calculation of peptide and protein ratios. Additionally, SILAC yields more robust quantitation ratios than label-free strategies since the lack of reproducibility in certain label-free strategies can negatively impact the generation of consistent ratio reports. In general, SILAC based proteomic analyses are limited to only those cells or animals that can metabolically incorporate stable isotope labeled amino acids. Although it has not been widely adopted by most clinical proteomic analyses, recently the SILAC method has been modified and extended to the analysis of clinical biopsy samples that have not traditionally been amenable to this type of approach 13 14.
Several methods have been developed for the mass spectrometry-based determination of SILAC ratios. One method is based on peak area integration of Extracted Ion Chromatograms (XIC) using software programs such as Xpress 15, ASAPRatio 16 and MSQuant 17. In general, XIC peak area is calculated by integrating peak intensity over retention time for a specified m/z value. However, it is often difficult to objectively determine the boundaries of a peak corresponding to a specific peptide, especially when the XIC peak or elution profile of a peptide is not well defined. Another method for determining SILAC-labeled peptide ratios is based on ratios generated from MS1 scans surrounding the MS/MS spectrum of an identified peptide. The programs Census 18 and RelEx 19 use a linear regression approach to calculate quantitation ratios. MaxQuant 20,21 determines SILAC pairs based on peptide features and subsequently uses the database search results from Andromeda 22, a novel peptide search engine using a probabilistic scoring model, to calculate ratios. A newly developed software program, UNiquant 23, provides a quantitation method based on overall peak intensity ratio and has been shown to significantly increase the number of quantified peptides in the analysis of quantitative proteomics data using stable isotope labeling.
A critical issue commonly associated with the processing of quantitative SILAC-based proteomic data is the validation of the accuracy of the large number of SILAC peptide ratios generated from a shotgun proteomics experiment. Since every software program uses a different algorithm and computational method to calculate SILAC peptide ratios, we and others have observed a rather large discrepancy among the SILAC peptide ratios reported by different programs for the same peptides, especially for low abundant peptides. Therefore, the manual validation of SILAC peptide ratios at both the protein and peptide levels is often required for each analysis. Currently, the Qurate 24 graphical tool can be used to manually validate isotopically labeled peptide quantitation events. The Rover 25 tool can be used to validate the quantitation reports from several different software packages such as MaxQuant and Census.
In this paper we describe the framework and quantitation accuracy of IsoQuant, a software tool we developed for SILAC-based mass spectrometry quantitation. IsoQuant uses unique peak selection and absolute peak intensity integration algorithms combined with high mass accuracy and dynamic chromatographic retention time filters in order to maximize the accuracy of peptide and protein quantitation. To improve the efficiency of manual validation, we have included a graphic user interface in IsoQuant, which allows end users to visualize original MS1 spectra and examine how each individual SILAC peptide ratio was calculated in order to improve the confidence of protein quantitation. IsoQuant is freely available to non-commercial users at http://www.proteomeumb.org/MZw.html.
MATERIALS AND METHODS
SILAC labeling and hippocampal slice culture
Hippocampal slice cultures were prepared and maintained as described previously 26. Briefly, hippocampi were dissected from 5- to 7-day-old rat pups. Slices of 400 µm thickness were cut with a tissue chopper and attached to glass coverslips in a chicken plasma clot. The coverslips and slices were placed in individual sealed test tubes containing semi-synthetic medium and maintained on a roller drum in an incubator for 14 days. On day 15, the cultures were transferred to DMEM-based SILAC medium (Pierce/Thermo Fisher Scientific) supplemented with D4 l-Lysine-HCl (100 µg/ml) (purity 96–98%, Cambridge Isotope Laboratories), 13C6 l-Arginine-HCl (100 µg/ml) (purity 99%, Cambridge Isotope Laboratories), 10% dialyzed fetal bovine serum (Invitrogen) and 1% penicillin/streptomycin. Slices were harvested on the 14th day of being cultured in SILAC DMEM.
Preparation of cell lysates and protein digestion
SILAC-labeled cultured hippocampal slices were homogenized in a buffer containing 8 M urea, 75 mM NaCl, 50 mM Tris-HCl, pH 8.2, protease inhibitor cocktail (Roche), 1 mM NaF, 1 mM ß-glycerophosphate, 1 mM sodium orthovanadate, 10 mM sodium pyrophosphate, and 1 mM PMSF using a microtube pellet pestle rod and motor (Kontes). Insoluble material was pelleted by centrifugation at 10,000 × g for 10 min at 4 °C. The concentration of the soluble proteins was determined by the BCA protein assay (Pierce/Thermo Fisher Scientific). Reducing Laemmli sample buffer was added to three aliquots of 25 µg protein prior to a 5 min incubation at 95 °C and protein separation via SDS-PAGE. Gel bands were visualized by Coomassie blue staining. Each gel lane was divided into 15 regions and the corresponding gel regions from each lane were combined and subjected to in-gel tryptic digestion as described previously 27.
The complex cell lysate sample used to prepare standard mixtures and evaluate the reproducibility of peptide quantitation by IsoQuant was derived from SKBR3 cells cultured in SILAC DMEM supplemented with 10% dialyzed fetal bovine serum (Invitrogen) and 1% penicillin/streptomycin. Five 15-cm dishes of SKBR3 cells were cultured in supplemented SILAC DMEM to which 12C6 l-Lysine-HCl (100 µg/ml) (Cambridge Isotope Laboratories) and 12C6 l-Arginine-HCl (100 µg/ml) (Cambridge Isotope Laboratories) were added; this medium is referred to as SILAC “light”: Lys0, Arg0. Five 15-cm dishes of SKBR3 cells were cultured in supplemented SILAC DMEM to which 13C6 l-Lysine-HCl (100 µg/ml) (purity 99%, Cambridge Isotope Laboratories) and 13C6 l-Arginine-HCl (100 µg/ml) (purity 99%, Cambridge Isotope Laboratories) were added; this medium is referred to as SILAC “heavy”: Lys6, Arg6. Cells were lysed by sonication in the same buffer as described for the hippocampal slices. The concentration of the soluble proteins was determined by the BCA protein assay and 1 mg of total proteins from the SILAC “light” and “heavy” labeled proteins were combined at the following ratios: 1:1, 1:2, 1:5, 1:10, 1:25, 1:50 and 1:100. The standard mixtures in triplicates were then fractionated by SDS-PAGE. Following SDS-PAGE, protein bands were excised and subjected to in-gel trypsin digestion and LC-MS/MS analysis as described below.
Liquid chromatography-tandem mass spectrometry
Peptides were separated by nanoscale reverse-phase liquid chromatography using an Xtreme Simple nanoLC system (CVC/Micro-Tech). The analytical column was prepared by packing 1.7µm 200Å C18 resin (Prospereon Life Sciences) into a laser-pulled fused silica capillary (75 µm inner diameter, 10.5 cm length, 10µm tip; Sutter Instruments) using a pressure injection cell (Next Advance). Peptides were injected into the sample loop using an Endurance autosampler (Spark Holland, Brick, NJ) and were loaded onto the column with 95% solvent A (0.5% acetic acid in water). A 120 min LC gradient method from 5 – 35% B (80% acetonitrile, 0.5% acetic acid) with a post-split flow rate of 0.3 µl/min was used to elute the peptides into the mass spectrometer. The LTQ-Orbitrap mass spectrometer (Thermo Electron) was equipped with a nanospray ionization source. The spray voltage was 1.5 kV and the heated capillary temperature was 180 °C. MS1 data were acquired in the profile mode in the Orbitrap with a resolution of 60,000 at 400 m/z and the top ten most intense ions in each MS1 scan were selected for collision induced dissociation in the linear ion trap. Dynamic exclusion was enabled with repeat count 1, repeat duration 30 sec, and exclusion duration 180 sec. Other mass spectrometry data generation parameters were as follows: collision energy 35%, ion selection threshold for MS/MS 500 counts, isolation width 3 m/z, default charge state 3, and charge state screening enabled.
Database searching and data processing
MS/MS spectra were searched against a UniProtKB human protein database (version Oct 5, 2010; 20,259 reviewed sequences; 75,498 nonreviewed sequences) using Bioworks 3.3.1 SP1 with the SEQUEST algorithm. Search parameters included 20 ppm peptide mass tolerance, 1.0 Da fragment tolerance, static Cys + 57.02510 (carbamidomethylation) modification and the following differential modifications: Met + 15.99492 (oxidation), Lys + 6.02013 (13C6) and Arg + 6.02013 (13C6). Fully tryptic peptides with up to two missed cleavages and charge-state-dependent cross-correlation scores ≥ 2.5, 3.0, and 3.5 for 2+, 3+, and 4+ peptides, respectively, were considered as positive identifications for further quantitative analyses. The same raw data were processed by Proteome Discoverer (version 1.2, Thermo Scientific) using SEQUEST. The protein database, database search parameters and peptide filters were the same as indicated for the workflow using Bioworks.
RESULTS and DISCUSSION
1) Overview of IsoQuant SILAC-based quantitation
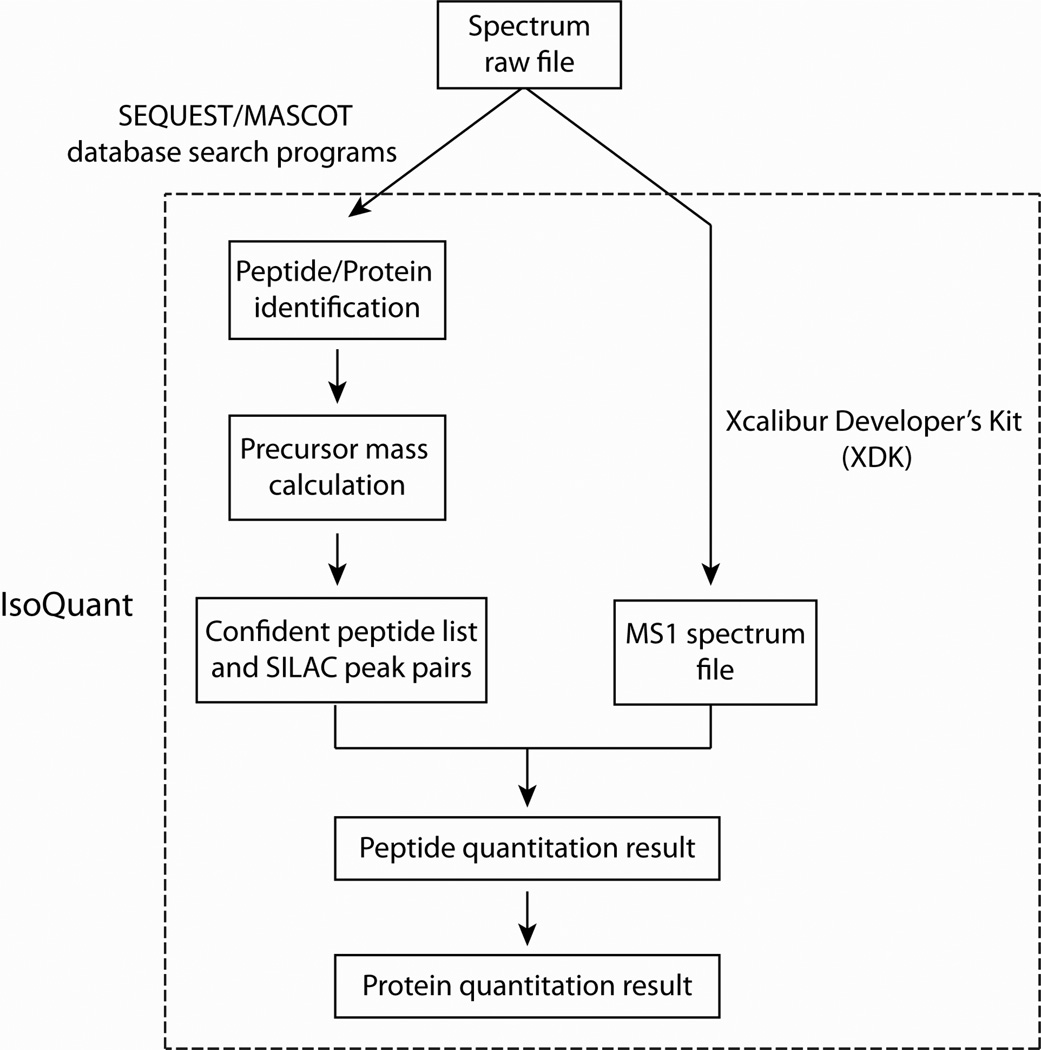
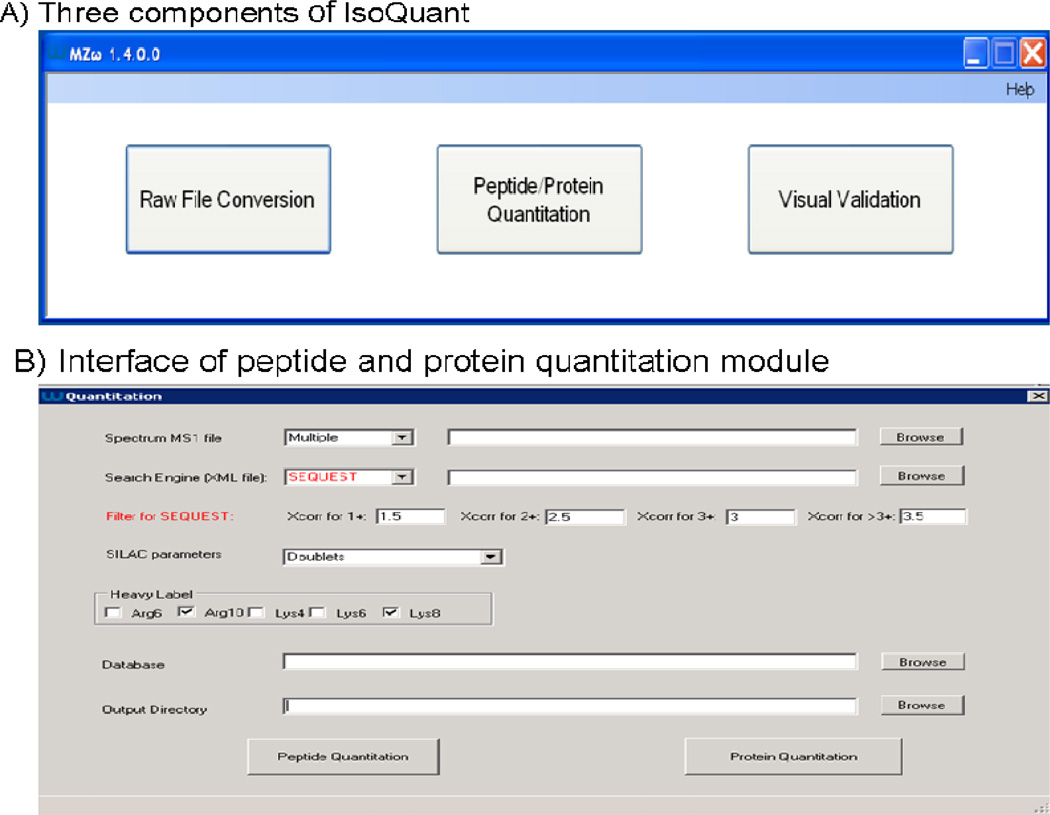
In this report, we have developed a new SILAC-based proteomics quantitation method, named IsoQuant. Figure 1 illustrates the framework of IsoQuant for calculating SILAC peptide quantitation ratios. Briefly, IsoQuant consists of three major components: .raw file extraction, Peptide/Protein Quantitation, and Data Validation and Visualization. Figure 2A is a screen shot of the three major IsoQuant user modules. To automate and streamline the data processing, IsoQuant takes original .raw files generated from an Orbitrap mass spectrometer as input and extracts MS1 spectra using the Xcalibur Developer’s Kit (XDK, Thermo Electron, San Jose CA). This .raw file conversion program selects all of the MS1 scans in the .raw binary file and exports them to a single ASCII format text file. The built-in IsoQuant .raw file conversion program is convenient for users since it does not require any third party software tools for mass spectrometry data conversion. Next, a summary report of peptide quantitation ratios is generated. Since IsoQuant performs its peptide quantitation after the database search, the filtering and selection of peptides based on their false discovery rates can be readily defined by the user. The third step is protein identification whereby IsoQuant checks the database search results and groups proteins with homologous peptides into protein clusters. Lastly, IsoQuant calculates protein quantitation ratios and compiles protein quantitation reports based on the peptide quantitation ratios in each protein cluster. The graphical user interface of IsoQuant’s peptide and protein quantitation module is presented in Figure 2B.
Figure 1. Framework of IsoQuant.
Figure 2. User interface of IsoQuant.
A) IsoQuant consists of three major components: Raw file conversion, Peptide/ Protein Quantitation and Visual Validation. B) Interface of the peptide and protein quantitation module. Currently, IsoQuant supports the following quantitation features: 1. double and triple label SILAC experiments; 2. Single or multiple .raw files; and 3. SEQUEST and Mascot peptide identification results (only SEQUEST search result is shown here).
2) IsoQuant minimizes under-sampling problem when a data-dependent method is used to acquire MS2 spectra
Mass spectrometer data acquisition methods with dynamic exclusion enabled are commonly used in most proteomic experiments. Mass spectrometers operated in a data-dependent data acquisition mode have a bias toward selecting the most abundant peaks for MSn fragmentation. As a result, the use of a dynamic exclusion method often reduces the number of times a given peptide is selected for MSn fragmentation, thereby increasing the likelihood that lesser abundant peaks will be selected for fragmentation.
In this study, we found that data-dependent data acquisition methods often result in the lack of fragmentation of both the heavy- and light-labeled versions of each SILAC peptide pair in cases where the intensity of one of the peptides is below the threshold used to trigger MS/MS fragmentation. To compensate for the loss of potentially valuable quantitation data in cases such as these, many current software packages, such as RelEx 19 and ProRata 28, only require either the heavy or light peptide to be selected for MS/MS fragmentation and identified by database search in order for a SILAC peptide ratio to be calculated. Once the peptide is correctly identified, corresponding SILAC-labeled heavy and light peptide MS1 isotopic envelopes will be extracted. IsoQuant has adopted this important feature and can automatically extract the XICs of heavy and light peptides when one of these variants is identified. We found this feature has significantly increased the number of peptide pairs that can be quantified by IsoQuant.
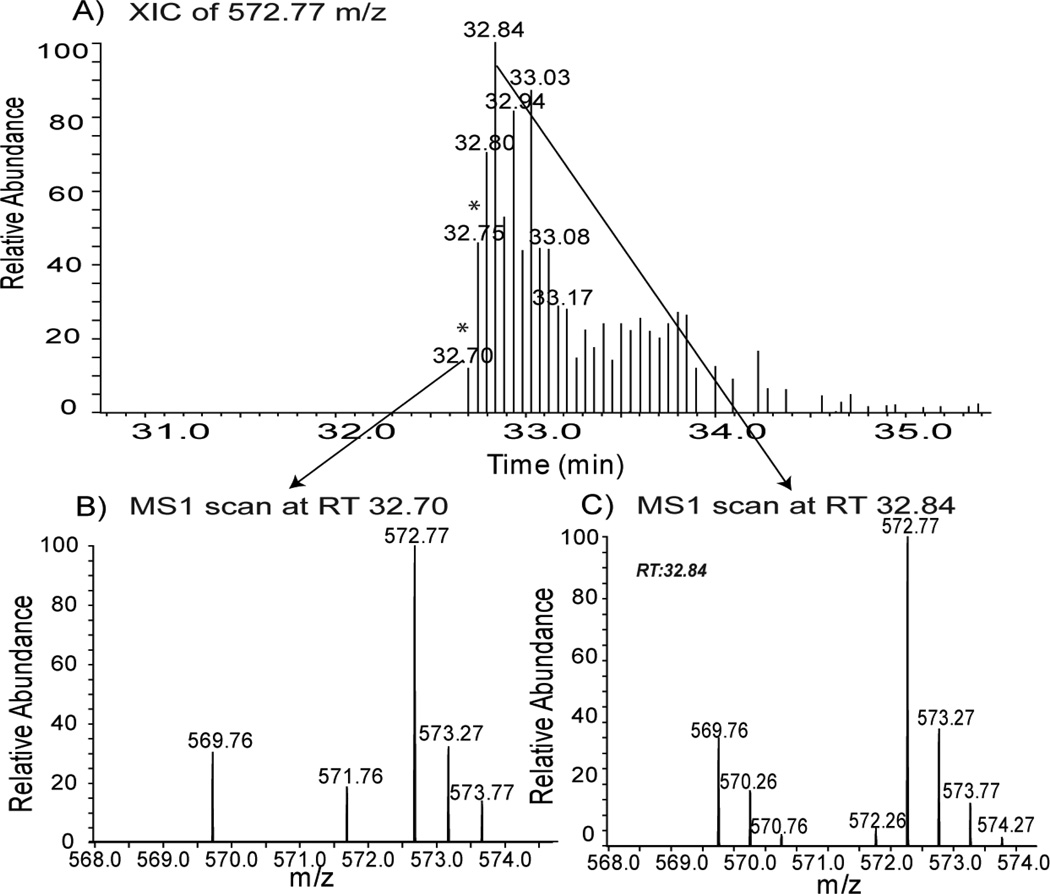
Figure 3 illustrates one of the limitations of data-dependent acquisition instrument methods and indicates that MS1 peaks selected for MS/MS fragmentation do not always have clear isotope distributions for accurate SILAC-pair quantitation. As shown in Figure 3A, an MS1 peak corresponding to 572.77 m/z at retention time (RT) 32.70 min and RT 32.75 min (indicated by *) was selected for MS/MS fragmentation. The MS1 scan of RT 32.70 min has a distinct isotopic peak envelope at 572.77 m/z (heavy SILAC peptide), whereas 569.76 m/z (light SILAC peptide) has an incomplete isotopic peak envelope (Figure 3B). The use of dynamic exclusion in this instrument method precluded the selection of the 572.77 m/z (heavy SILAC peptide) and 569.76 m/z (light SILAC peptide) peaks for MS/MS fragmentation after RT 32.75 min, as indicated in Figure 3A. On the other hand, at RT 32.84 min, which coincides with the apex of the peak in the extracted ion chromatogram of 572.77 m/z, complete isotopic peak envelopes were obtained for both the light and heavy SILAC peptides (Figure 3C). However, these two peaks at RT 32.84 min were never selected for MS/MS fragmentation since they had already been added to the dynamic exclusion list. To overcome this issue, IsoQuant uses both high mass accuracy and retention time filters to determine candidate SILAC peptide pairs for quantitation if either the heavy or light peptide was identified by the database search engine. Therefore, IsoQuant can overcome the limitations of dynamic exclusion-based data-dependent acquisition methods that affect the accuracy of other quantitation programs.
Figure 3. IsoQuant overcomes the limitation of under-sampling in data-dependent instrument methods, thereby increasing the accuracy of SILAC-based quantitation.
A) Extracted ion chromatogram (XIC) of 572.77 m/z (SILAC heavy-labeled peptide). 572.77 m/z was selected for MS2 fragmentation and was identified by SEQUEST in the first two scans (indicated by *; retention time (RT) 32.70 min and 32.75 min). B) MS1 scan at RT 32.70 min (568.0 – 575.0 m/z) demonstrating an incomplete isotope envelope of 569.76 m/z (SILAC light-labeled peptide). C) MS1 spectrum from the most intense peak in A) at RT 32.84 min. Although 572.77 m/z was not selected for MS2 fragmentation due to dynamic exclusion, its complete isotopic envelope permitted quantitation by IsoQuant.
3) Summary of IsoQuant Peak Selection Algorithm
Two common challenges associated with the accuracy of peptide quantification in a shotgun proteomic analysis are the co-elution of contaminant isobaric peptides and the lack of a clear distinction between low abundant peptides and background noise. As a result, these two issues often affect the clear identification of the XIC derived from the target peptide because the boundaries, or the starting and ending points, of the XIC can be difficult to discern. To overcome these issues, both Census 18 and RelEx 19 use a least-squares regression method to quantify peptides with poor S/N ratios. Recently another program, Vista 29, also demonstrated that the quantitation accuracy of low abundant SILAC peptide pairs can be significantly improved when both high mass accuracy and signal/noise ratio were included as part of the algorithm.
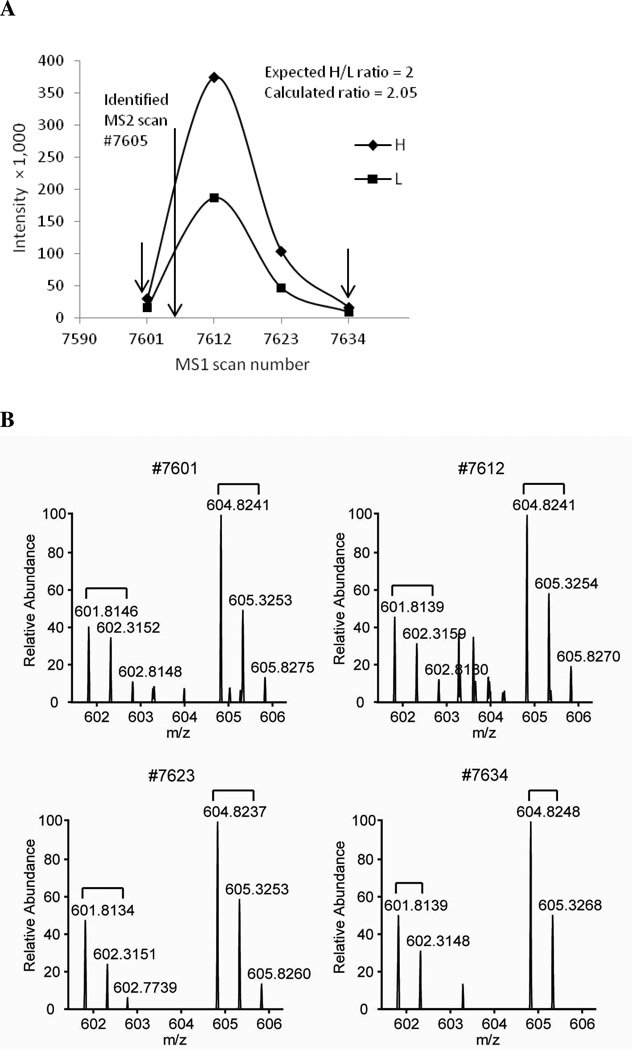
IsoQuant uses the following three filters to identify XIC boundaries: retention time (default setting: 50 MS1 scans preceding and following the MS2 scan of the identified peptide), high mass accuracy (default setting: 5ppm), and detection of complete isotopic envelopes corresponding to both the identified and theoretical SILAC peptides. Figure 4 is a representative example of a SILAC peptide pair quantified by IsoQuant. In this case, the MS2 spectrum of the heavy-labeled SILAC peptide was identified by the SEQUEST search engine at scan #7605. IsoQuant then searches for the MS1 isotopic envelopes corresponding to the parent mass of identified peptides using its high mass accuracy filter (5ppm) and retention time filter. Because of the detection limits of mass spectrometers and the wide dynamic range of most proteomes, it is often difficult to detect the complete isotopic envelopes of low abundant peptides. Therefore, for low abundant peptides or peptides with poor S/N ratios, only monoisotopic peaks are used for XIC construction. In order to discriminate between the true signals derived from low abundant peptides and the signals generated from the background noise, the current version of IsoQuant requires at least two monoisotopic peaks to be identified for each peptide during XIC reconstruction.
Figure 4. Representative extracted ion chromatograms (XIC) of model peptide from a SILAC H/L = 2 mixture.
(A) Nuclear migration protein nudC (NUDC) peptide, LVSSDPEINTK, was identified at scan # 7605, as indicated by the long arrow. The peak intensities of isotopic envelopes corresponding to the heavy and light peptides were then extracted by an IsoQuant MS1 peaks extraction module. Two XICs corresponding to individual heavy (square) and light (diamond) peptides were then reconstructed. The H/L ratio calculated by IsoQuant was 2.05 and close to the expected H/L ratio of 2.0. The beginning (scan # 7601) and ending (scan # 7634) points of the XICs are indicated by the two short arrows. (B) MS1 spectra of peptide LVSSDPEINTK used for ratio calculation.
As indicated in Figure 4B, IsoQuant’s MS1 extraction module will only extract MS1 scans containing at least two monoisotopic peaks from both the heavy and light peptides. XICs corresponding to heavy and light labeled peptides are reconstructed and areas under the curves are then calculated. Since the light labeled peptide was not identified by SEQUEST database search in this case, IsoQuant used the final SEQUEST search result and automatically identified the corresponding MS1 peaks of the light labeled peptide. Using the same high mass accuracy and retention time filters described earlier, the boundaries of XIC corresponding to isotopic envelopes of the light labeled peptide were then defined. We found that an advantage of using isotopic envelopes (or at least two monoisotopic peaks) to define the boundaries of XIC for low abundant peptides is the simultaneous exclusion of contaminant background peaks since most of these background ions do not have a complete isotopic envelope. In addition, we have also found that requiring a complete set of isotopic envelopes to reconstruct the XIC of target peptides automatically allows IsoQuant to eliminate co-eluting low abundant isobaric peptides, which significantly improves the accuracy of SILAC pair quantification.
4) Quantitative accuracy of IsoQuant using sPRG2009 SILAC peptide standards and complex biological sample
In order to evaluate the performance and accuracy of IsoQuant, we used the SILAC-labeled peptide standards provided by the Association of Biomolecular Resource Facility’s (ABRF) Proteomics Standards Research Group (sPRG) 30. The natural and synthetic ([13C6, 15N2]-lysine and [13C6, 15N4]-arginine) peptides from five recombinant human proteins (serum albumin, histidyl-tRNA synthetase, ribosyldihydronicotinamide dehydrogenase, peroxiredoxin-1, and ubiquitin) were combined in three defined ratios and quantities. Two technical LC-MS/MS replicates were performed and IsoQuant was used to determine the peptide and protein ratios. The accuracy of the calculated quantitation ratios was assessed using the following criteria. First, the ratios for all occurrences of the same peptide identified in the same run should be consistent. Second, the ratios for all occurrences of the same peptide identified in both runs should be consistent. Lastly, the ratios for all unique peptides identified from the same protein should be consistent.
Table 1 lists the SILAC ratios calculated by IsoQuant as compared to the published consensus ratios from other laboratories who participated anonymously in the ABRF sPRG09 study. Using IsoQuant, we successfully quantified all 15 peptides and five proteins present in the sample. The average absolute deviation for all protein ratios was 4.99%. Therefore, this study suggests that IsoQuant is an accurate method that can be used to reliably determine peptide and protein ratios.
Table 1.
IsoQuant peptide quantitation results from LC-MS/MS analysis of ABRF sPRG09 quantitative proteomics standard.
| Protein UniProt ID |
Peptide sequence | Expected ratio |
ABRF consensus ratio |
Experimental ratio |
SD | CV (%) |
% of consensus ratio |
Absolute deviation (%) |
|---|---|---|---|---|---|---|---|---|
| ALBU_HUMAN | LVNEVTEFAK | 1 | 1 | 1.01 | 0.02 | 2.4 | 100.92 | 0.92 |
| SLHTLFGDK | 1.06 | 1.09 | 0.03 | 2.4 | 102.37 | 2.37 | ||
| AEFAEVSK | 1.03 | 1.07 | 0.05 | 5.1 | 103.77 | 3.77 | ||
| NQO2_HUMAN | NVAVDELSR | 1 | 0.93 | 0.92 | 0.03 | 3.1 | 99.28 | 0.72 |
| PRDX1_HUMAN | DISLSDYK | 0.1 | 0.1 | 0.10 | 0.01 | 6.5 | 103.24 | 3.24 |
| ADEGISFR | 0.11 | 0.10 | 0.01 | 10.1 | 89.37 | 10.63 | ||
| GLFIIDDK | 0.1 | 0.11 | 0.01 | 4.6 | 113.56 | 13.56 | ||
| PILVQAFQFTDK | 0.12 | 0.11 | 0.01 | 4.9 | 95.36 | 4.64 | ||
| SYHC_HUMAN | AALEELVK | 5 | 3.73 | 3.92 | 0.11 | 2.9 | 104.99 | 4.99 |
| DQGGELLSLR | 3.5 | 3.03 | 0.40 | 13.2 | 86.53 | 13.47 | ||
| GLAPEVADR | 4.01 | 4.23 | 0.09 | 2.1 | 105.45 | 5.45 | ||
| IFSIVEQR | 4.24 | 4.10 | 0.48 | 11.8 | 96.63 | 3.37 | ||
| UBIQ_HUMAN | TITLEVEPSDTIENVK | 10 | 8.28 | 9.09 | 0.99 | 10.9 | 109.74 | 9.74 |
| TLSDYNIQK | 7.81 | 8.37 | 0.24 | 2.9 | 107.11 | 7.11 | ||
| ESTLHLVLR | 10.7 | 11.96 | 0.82 | 6.8 | 111.77 | 11.77 | ||
| Median | - | - | - | - | - | - | 103.24 | 4.99 |
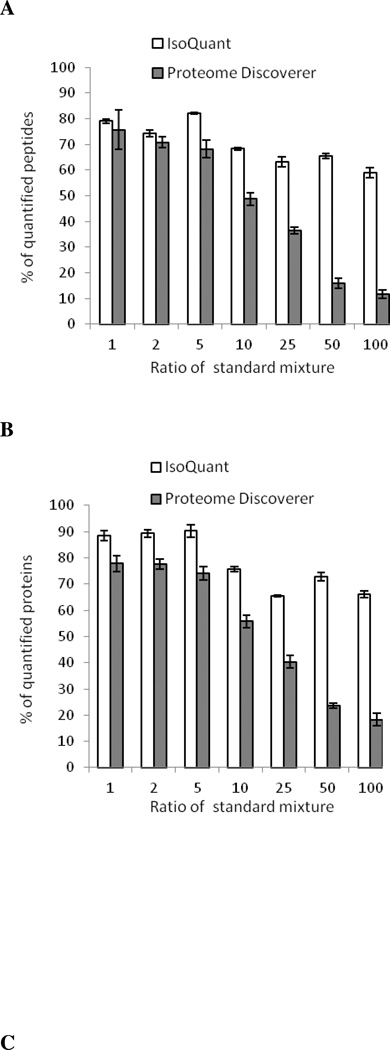
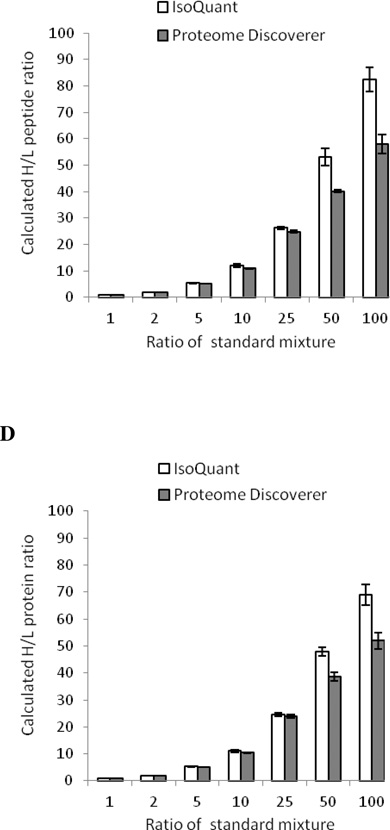
To further demonstrate the accuracy of IsoQuant in quantifying the relative abundance of proteins in a complex sample, heavy 13C-Lys/Arg-labeled cell lysates were mixed with light 12C- Lys/Arg-labeled cell lysates at the following H/L ratios = 1:1, 1:2, 1:5, 1:10, 1:25, 1:50 and 1:100. These standard mixtures were then separated by SDS-PAGE in triplicate and analyzed by trypsin in-gel digestion and LC-MS/MS. After the SEQUEST database search, the accuracy of SILAC peptide ratios was compared between IsoQuant and Proteome Discoverer (Figure 5, see Supplemental Tables 1–4 for the details of peptide and protein quantification). IsoQuant was able to quantify more peptides and proteins in the samples with expected SILAC H/L ratios of 1:25, 1:50 and 1:100 (Figures 5A and B, Supplemental Tables 5 and 6). The accuracy of IsoQuant at the H/L ratios = 1:1, 1:2, 1:5, 1:10 and 1:25 is very comparable to Proteome Discoverer (Figure 5C). However, the ratios of the H/L = 1:50 standard mixture as calculated by IsoQuant and Proteome Discoverer were 53.19 ±3.20 and 40.00 ±0.39, respectively. Because of the less than 100% labeling efficiency of the heavy-labeled cell lysate (99%) and the failure to identify low abundant isotopic envelopes of light labeled peptides, the ratios of the H/L = 1:100 standard mixture as calculated by IsoQuant and Proteome Discoverer were 82.53 ± 4.53 and 58.09 ± 3.57, respectively.
Figure 5. Quantitation accuracy of IsoQuant using standard SILAC mixtures.
SILAC standard mixtures at H/L = 1:1, 1:2, 1:5, 1:10, 1:25, 1:50 and 1:100 were prepared in triplicate by mixing 13C6-lysine and 13C6-arginine labeled SKBR3 cells with 12C6-lysine and 12C6-arginine labeled SKBR3 cells. The same raw data were analyzed by IsoQuant (white) and Proteome Discoverer (gray). The percentage of quantified peptides (A) and proteins (B) from the quantitation results of IsoQuant (white) and Proteome Discoverer (gray) are shown. Error bars represent standard deviations from three technical replicates. Expected ratios and experimental ratios of peptides (C) and proteins (D) are shown. Error bars represent standard deviations from three technical replicates.
IsoQuant uses a weighted average method to calculate the final protein ratio. The following formula is used to calculate protein ratios: , wi is the XIC area of heavy and light peptide, is the ratio of heavy and light pair.
An example of the final assembly of peptide ratios into protein ratios is illustrated in Table 2. It is clear that the weighted average method improves the quantitation of IsoQuant. If many peptides belong to a group of proteins, IsoQuant will group these proteins into a common protein group and use a weighted average method to obtain an average protein group ratio. However, if there is a unique peptide from a specific isoform that can be identified within a protein group, IsoQuant will calculate and record the protein ratio of that specific isoform based on the ratio of the quantified unique peptide pair. Therefore, no outlier removal is used during the process of protein ratio calculation in order to maintain the ratios of the unique peptides for each specific protein isoform. Figure 5D summarizes the accuracy of IsoQuant protein quantitation. The accuracy of IsoQuant protein quantitation at the H/L ratios = 1:1, 1:2, 1:5, 1:10, 1:25 and 1:50 is very close to the ratios of the known standard mixtures. Due to the limitations of the mass spectrometer on the extraction of peptides with low signal/noise ratios, the calculated protein ratio of IsoQuant for the H/L = 100 standard mixture is 68.97 ± 3.77 (Figure 5D, Supplemental Table 6).
Table 2.
Weighted average ratio and the average ratio of Actin (ACTN_HUMAN) from a SILAC H/L = 2 mixture.
| Identified peptide | Peptide ratio |
Peptide XIC area |
|---|---|---|
| AGFAGDDAPR | 1.57 | 19357154 |
| DLTDYLM@K | 2.16 | 2329756 |
| DSYVGDEAQSK | 2.08 | 15486406 |
| EITALAPSTM@K | 1.82 | 21217343 |
| EITALAPSTMK | 1.64 | 3614186 |
| HQGVM@VGM@GQK | 2.14 | 21062278 |
| SYELPDGQVITIGNER | 6.06 | 644852 |
| YPIEHGIITNWDDM@EK | 7.05 | 60656 |
| Average ratio | 3.07 | |
| Weighted average ratio | 1.93 | |
M@: Oxidized methionine residue
5) Validation of IsoQuant quantitation accuracy using SILAC-labeled rat hippocampal slices
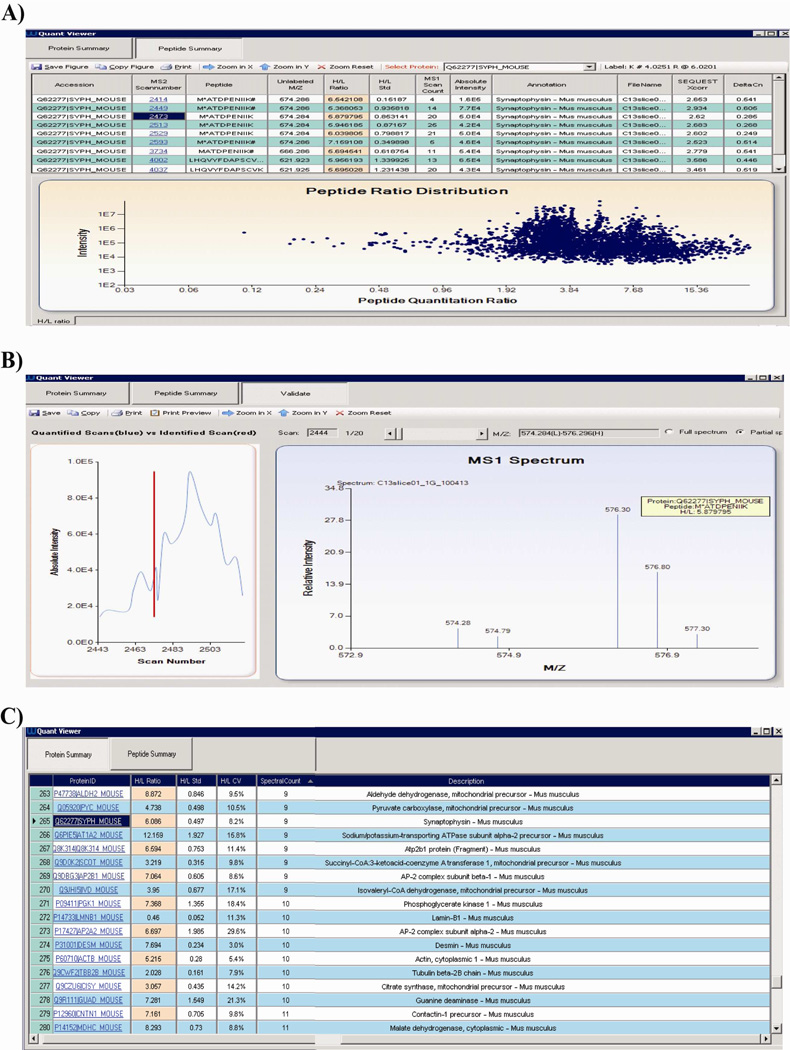
We used IsoQuant to conduct a quantitative analysis of a sample derived from SILAC-labeled rat brain hippocampal slices. A representative table of peptide quantitation results and the overall peptide ratio distribution from this sample are illustrated in Figure 6A. If the quantitation of a specific SILAC peptide pair requires further visual validation, the IsoQuant peptide quantitation viewer/visualization module will display all corresponding SILAC MS1 m/z pairs from the original mass spectrometer .raw file that were used to calculate that specific peptide ratio. For instance, the highlighted SILAC peptide MATDPENIIK (Figure 6A, indicated by MS2 scan# 2473) from synaptophysin was quantified with a SILAC ratio of 5.8 ± 0.85. Figure 6B is a representative spectrum of a MATDPENIIK SILAC peptide pair generated from IsoQuant’s visual validation module. The “light” MATDPENIIK peptide has an isotope envelope at 574.28 m/z (relative intensity 5%) and the “heavy” MATDPENIIK peptide has an isotope envelope at 576.30 m/z (relative intensity 30%); heavy/light = 5.88 ± 0.85. Therefore, this visual validation module allows users to quickly confirm the accuracy of SILAC ratios generated by IsoQuant.
Figure 6. Interface of IsoQuant visualization module permits users to validate quantitation ratios.
A) Screenshot of quantitative SILAC peptide summary report and overall peptide quantitation ratio distribution from a representative double (Lys4, Arg6) SILAC label experiment. B) Screenshot of a representative spectrum from which the peptide ratios were calculated. Users can move a slider at the top of the “MS1 spectrum” view in the “Validate” window to allow the visualization of neighboring MS1 scans used for peptide quantitation. C) Screenshot of protein ratio report
CONCLUSIONS
In summary, we have developed a new SILAC-based mass spectrometry quantitation software tool, named IsoQuant, which provides accurate quantitation ratios and avoids some of the common quantitation limitations related to data-dependent mass spectrometry data acquisition methods. The results using SILAC-labeled hippocampal slice cultures and cell lysate datasets prove that IsoQuant can be used for accurate peptide and protein SILAC-based quantitation of complex samples. Most importantly, IsoQuant offers an easy to use graphic interface peptide/protein quantitation report, and it also includes a visualization platform, which permits users to validate the quality of SILAC peptide and protein ratios.
Supplementary Material
ACKNOWLEDGEMENTS
This work was funded by National Institutes of Health grant R01AG25323 to A.J.Y. We also thank Dr. Scott Thompson and his laboratory for providing SILAC-labeled hippocampal slices. The University of Maryland Greenebaum Cancer Center Proteomics Shared Service is supported by an NIH NCI Cancer Center Support Grant (P30CA134274) and the Maryland Cigarette Restitution Fund.
REFERENCES
- 1.Aebersold R, Mann M. Nature. 2003;422:198–207. doi: 10.1038/nature01511. [DOI] [PubMed] [Google Scholar]
- 2.Yates JR, 3rd, Eng JK, McCormack AL, Schieltz D. Anal Chem. 1995;67:1426–1436. doi: 10.1021/ac00104a020. [DOI] [PubMed] [Google Scholar]
- 3.Perkins DN, Pappin DJ, Creasy DM, Cottrell JS. Electrophoresis. 1999;20:3551–3567. doi: 10.1002/(SICI)1522-2683(19991201)20:18<3551::AID-ELPS3551>3.0.CO;2-2. [DOI] [PubMed] [Google Scholar]
- 4.Craig R, Beavis RC. Bioinformatics. 2004;20:1466–1467. doi: 10.1093/bioinformatics/bth092. [DOI] [PubMed] [Google Scholar]
- 5.Clauser KR, Baker P, Burlingame AL. Anal Chem. 1999;71:2871–2882. doi: 10.1021/ac9810516. [DOI] [PubMed] [Google Scholar]
- 6.Zhang N, Aebersold R, Schwikowski B. Proteomics. 2002;2:1406–1412. doi: 10.1002/1615-9861(200210)2:10<1406::AID-PROT1406>3.0.CO;2-9. [DOI] [PubMed] [Google Scholar]
- 7.Geer LY, Markey SP, Kowalak JA, Wagner L, Xu M, Maynard DM, Yang X, Shi W, Bryant SH. J Proteome Res. 2004;3:958–964. doi: 10.1021/pr0499491. [DOI] [PubMed] [Google Scholar]
- 8.Zamdborg L, LeDuc RD, Glowacz KJ, Kim YB, Viswanathan V, Spaulding IT, Early BP, Bluhm EJ, Babai S, Kelleher NL. Nucleic Acids Res. 2007;35:W701–W706. doi: 10.1093/nar/gkm371. [DOI] [PMC free article] [PubMed] [Google Scholar]
- 9.Tanner S, Shu H, Frank A, Wang LC, Zandi E, Mumby M, Pevzner PA, Bafna V. Anal Chem. 2005;77:4626–4639. doi: 10.1021/ac050102d. [DOI] [PubMed] [Google Scholar]
- 10.Mueller LN, Brusniak MY, Mani DR, Aebersold R. J Proteome Res. 2008;7:51–61. doi: 10.1021/pr700758r. [DOI] [PubMed] [Google Scholar]
- 11.Ong SE, Blagoev B, Kratchmarova I, Kristensen DB, Steen H, Pandey A, Mann M. Mol Cell Proteomics. 2002;1:376–386. doi: 10.1074/mcp.m200025-mcp200. [DOI] [PubMed] [Google Scholar]
- 12.Ong SE, Mann M. Nat Protoc. 2006;1:2650–2660. doi: 10.1038/nprot.2006.427. [DOI] [PubMed] [Google Scholar]
- 13.Geiger T, Cox J, Ostasiewicz P, Wisniewski JR, Mann M. Nat Methods. 2010;7:383–385. doi: 10.1038/nmeth.1446. [DOI] [PubMed] [Google Scholar]
- 14.Geiger T, Wisniewski JR, Cox J, Zanivan S, Kruger M, Ishihama Y, Mann M. Nat Protoc. 2010;6:147–157. doi: 10.1038/nprot.2010.192. [DOI] [PubMed] [Google Scholar]
- 15.Han DK, Eng J, Zhou H, Aebersold R. Nat Biotechnol. 2001;19:946–951. doi: 10.1038/nbt1001-946. [DOI] [PMC free article] [PubMed] [Google Scholar]
- 16.Li XJ, Zhang H, Ranish JA, Aebersold R. Anal Chem. 2003;75:6648–6657. doi: 10.1021/ac034633i. [DOI] [PubMed] [Google Scholar]
- 17.Mortensen P, Gouw JW, Olsen JV, Ong SE, Rigbolt KT, Bunkenborg J, Cox J, Foster LJ, Heck AJ, Blagoev B, Andersen JS, Mann M. J Proteome Res. 2010;9:393–403. doi: 10.1021/pr900721e. [DOI] [PubMed] [Google Scholar]
- 18.Park SK, Venable JD, Xu T, Yates JR., 3rd Nat Methods. 2008;5:319–322. doi: 10.1038/nmeth.1195. [DOI] [PMC free article] [PubMed] [Google Scholar]
- 19.Venable JD, Dong MQ, Wohlschlegel J, Dillin A, Yates JR. Nat Methods. 2004;1:39–45. doi: 10.1038/nmeth705. [DOI] [PubMed] [Google Scholar]
- 20.Cox J, Mann M. Nat Biotechnol. 2008;26:1367–1372. doi: 10.1038/nbt.1511. [DOI] [PubMed] [Google Scholar]
- 21.Cox J, Matic I, Hilger M, Nagaraj N, Selbach M, Olsen JV, Mann M. Nat Protoc. 2009;4:698–705. doi: 10.1038/nprot.2009.36. [DOI] [PubMed] [Google Scholar]
- 22.Cox J, Neuhauser N, Michalski A, Scheltema RA, Olsen JV, Mann M. J Proteome Res. 2011;10:1794–1805. doi: 10.1021/pr101065j. [DOI] [PubMed] [Google Scholar]
- 23.Huang X, Tolmachev AV, Shen Y, Liu M, Huang L, Zhang Z, Anderson GA, Smith RD, Chan WC, Hinrichs SH, Fu K, Ding SJ. J Proteome Res. 2011;10:1228–1237. doi: 10.1021/pr1010058. [DOI] [PMC free article] [PubMed] [Google Scholar]
- 24.May D, Law W, Fitzgibbon M, Fang Q, McIntosh M. J Proteome Res. 2009;8:3212–3217. doi: 10.1021/pr900169w. [DOI] [PMC free article] [PubMed] [Google Scholar]
- 25.Colaert N, Helsens K, Impens F, Vandekerckhove J, Gevaert K. Proteomics. 2010;10:1226–1229. doi: 10.1002/pmic.200900379. [DOI] [PubMed] [Google Scholar]
- 26.Gahwiler BH. J Neurosci Methods. 1981;4:329–342. doi: 10.1016/0165-0270(81)90003-0. [DOI] [PubMed] [Google Scholar]
- 27.Thomas SN, Wan Y, Liao Z, Hanson PI, Yang AJ. Anal Chem. 2011;83:5511–5518. doi: 10.1021/ac200950k. [DOI] [PMC free article] [PubMed] [Google Scholar]
- 28.Pan C, Kora G, McDonald WH, Tabb DL, VerBerkmoes NC, Hurst GB, Pelletier DA, Samatova NF, Hettich RL. Anal Chem. 2006;78:7121–7131. doi: 10.1021/ac060654b. [DOI] [PubMed] [Google Scholar]
- 29.Bakalarski CE, Elias JE, Villen J, Haas W, Gerber SA, Everley PA, Gygi SP. J Proteome Res. 2008;7:4756–4765. doi: 10.1021/pr800333e. [DOI] [PMC free article] [PubMed] [Google Scholar]
- 30.Arnott D, Farmar JG, Ivanov AR, Kowalak JA, Lane WS, Mechtler K, Phinney BS, Raida MR, Weintraub ST. In the 57th ASMS Conference. Philadelphia, PA: 2009. [Google Scholar]
Associated Data
This section collects any data citations, data availability statements, or supplementary materials included in this article.


