

Abstract
Background
The foetal growth standards for Indian children which are available today suffer due to methodological problems. These are, for example, not adhering to the WHO recommendation to base gestational age on the number of completed weeks and secondly, not excluding mothers with risk factors. This study has addressed both the above issues and in addition provides birthweight reference ranges with regard to sex of the baby and maternal parity.
Methods
Data from the labour room register from 1996 to 2010 was obtained. A rotational sampling scheme was used i.e. the 12 months of the year were divided into 4 quadrants. All deliveries in January were considered to represent the first quadrant. Similarly all deliveries in April, July and October were considered to represent 2nd, 3rd and 4th quadrants. In each successive year different months were included in each quadrant. Only those mothers aged 20–39 years and delivered between 24 to 42 weeks gestational age were considered. Those mothers with obstetric risk factors were excluded. The reference standards were fitted using the Generalized Additive Models for Location Scale and Shape (GAMLSS) method for Box – Cox t distribution with cubic spline smoothing.
Results
There were 41,055 deliveries considered. When women with risk factors were excluded 19,501 deliveries could be included in the final analysis. The male babies of term firstborn were found to be 45 g heavier than female babies. The mean birthweights were 2934 g and 2889.5 g respectively. Similarly, among the preterm babies, the first born male babies weighed 152 g more than the female babies. The mean birthweights were 1996 g and 1844 g respectively.
In the case of later born babies, the term male babies weighed 116grams more than the females. The mean birth weights were 3085 grams and 2969 grams respectively. When considering later born preterm babies, the males outweighed the female babies by 111 grams. The mean birthweights were 2089 grams and 1978 grams respectively. There was a substantial agreement range from k=.883, (p<.01) to k=.943, (p<.01) between adjusted and unadjusted percentile classification for the subgroups of male and female babies and first born and later born ones.
Birth weight charts were adjusted for maternal height using regression methods. The birth weight charts for the first born and later born babies were regrouped into 4 categories, including male and female sexes of the babies. Reference ranges were acquired both for term and preterm babies.
With economic reforms, one expects improvement in birthweights. The mean (sd) birthweights of the year 1996 was 2846 (562) as compared to year 2010 (15 years later) which was 2907 (571). There was only a difference of 61 grams in the mean birthweights over one and a half decade.
Conclusion
New standards are presented from a large number of deliveries over 15 years, customised to the maternal height, from a south Indian tertiary hospital. Reference ranges are made available separately for first born or later born babies, for male and female sexes and for term and preterm babies.
Keywords: Reference, Foetal growth, Birth weight, Gestational age, Preterm, Modelling, Box–Cox t, Cubic spline smoothing
Background
Investigators and researchers have used the reference standards which were developed globally due to lack of availability of population or country specific standards. A decline in the use of these standards has been reported [1] as regionally developed standards are made available [2-5]. Mohan et al. (1990) have reported growth curves for North Indian babies from a referral hospital [1]. However, these reference standards have limitations as they failed to exclude mothers and babies with risk factors and the hospital predominantly served mothers with low socioeconomic status. Most of the above studies have not adhered to the World Health Organization (WHO) recommendation to base gestational age on number of completed weeks. The latest report on birth weight standards for South Indian babies was published in 1996, which is nearly one and a half decades old and may no longer be pertinent to infants born in more recent years [2]. The country has gone through economic revolution in the last two decades, which has influenced all sections of society. Therefore, the birth weight of the new born babies is expected to increase. Kramer et al. have reported the validity of the calculation of gestational age from the last menstrual period and therefore the credibility of the birth weight standards which were published earlier [3-6]. The gestational age from 24 weeks to 29 weeks are expected to be small in numbers and therefore likely to have a skewed distribution in birth weight. Some studies have failed to smooth the standard curves using appropriate distribution such as log normal or Box – Cox t distribution with cubic spline smoothing [7,8]. In this study we have overcome the above mentioned limitations by studying children born from 1996 to 2010 in a referral hospital which has a unique medical records system, with appropriate inclusion criteria, foetal sex and mother’s gravidity and gestation specific growth standards for Indian children.
Methods
The Christian Medical College and Hospital is a referral hospital in South India, which caters to 47,110 outpatients and 15,662 inpatients per year. The department of Obstetrics and Gynaecology on an average delivered 20 babies per day in 1996 and 40 babies per day in 2010. The data was obtained from the Labour room register which was maintained by the nursing personnel and supervised by the Head of Obstetrics department. This contains all the information about women who delivered in this institution. Permission was obtained from all the Obstetric departmental Unit Heads. This study was approved by the ethics committee of [IRB Min. No. 7109 dated 10.03.2010] Christian Medical College.
Sampling
The twelve months of the year were divided in to 4 quadrants. In the year 1996, all deliveries which took place in January were considered to represent the first quadrant. In the second quadrant, all deliveries in the month of April were considered. All deliveries in the months of July and October were considered to represent the deliveries in the third and fourth quadrants. In the second year of the study (1997) all deliveries which took place in February, May, August and November were taken to represent the first, second, third and fourth quarter of the year. In the third year of study (1998), all deliveries which took place in March, June, September and December were taken to represent the first, second, third and fourth quarter of the year. The above cycle was repeated for the next 3 years and continued until the year 2010 [9].
Inclusion and exclusion criteria
Mothers aged 20 to 39 years and deliveries of gestational age between 24 weeks to 42 weeks were considered. The mothers, who had hypertensive disorders, gestational diabetes, diabetes mellitus, heart disease, and twin pregnancies, were excluded from the analyses. The gestational age specific birth weights which were above +3SD or below –3SD values were excluded from the analyses. The maternal height was regrouped into tertiles with categories as < 151 cm, 151 – 158 cm and > 158 cm based on the maternal height distribution of the mothers. Linear regression was employed to get the estimate of birthweight in relation to the maternal height. It showed a significant increase in birthweight of 135 grams. These 135 grams were added to the birthweight for shorter women and for taller women 135 grams were subtracted. Women with normal height (151–158 cm) did not have any adjustments in birthweight. These corrections yielded us the birthweights adjusted for maternal height.
The modified birthweights were adjusted with gestational ages to produce the birthweight centiles for each of the four groups in the term as well as the preterm groups. (Male & Female first born, Male & Female later born).
Distribution and smoothing
The birth weights adjusted for maternal height for babies born from gestational age 24 weeks to 30 weeks had skewed distribution to the right side. However, as the number of deliveries increased in the subsequent gestational weeks, the birth weight distribution followed normal distribution. In the modelling we have assumed Box-Cox t distribution in order to get over this skewness. Cubic Spline smoothing has been applied using the Generalized Additive Models for Location Scale and Shape (GAMLSS) method using R software (Stasinopoulos and Rigby 2007) [10]. The GAMLSS models are semi parametric regression type models. However, the response variable needs to follow parametric distribution. The 3rd, 10th, 25th, 50th, 75th, 90th and 97th percentiles and mean and standard deviations were computed using R software. These centiles for birthweight adjusted for maternal height were done separately for firstborn males, females and later born males and females.
Data from the labour room register was entered using EPIINFO software. Completed weeks gestational age was considered for nomograms. The best estimate of gestation based on reliable menstrual history, early antenatal clinical examination and sonographic fetal biometry was used. Birth weights were measured to the nearest 50 g on a Braun electronic weighing scale within one hour of birth.
Results
In total, there were 41,055 deliveries considered. Of these, complete data were available for 25,090 deliveries. When women with risk factors were excluded (mild and severe PIH, Chronic hypertension, GDM, Pregestational diabetics, cardiac disease, twins, teenaged primigravidas and mothers more than 40 years of age), 19,501 deliveries could be included for analyses. Most of the women were in the age group 25 – 29 years 41.7% (8133). Close to this is the 20 to 24 years age group which constituted 40.1% (7817). Mothers more than 30 years constituted only 18.2% (3551).
The maximum number of mothers who delivered belonged to the Hindu religion, and formed 82% (15933). Muslims formed 11.1% (2164), and Christians constituted 6.9% (1343).
Most (91.8%) of the mothers were housewives. Professionals were a minority, 4.3% (844), and mothers trained for skilled work were only 1.4% (241). When considering education of the mothers, 28.6% (4961) were graduates or more highly educated. A small percent was illiterate 5.1% (895). Those who had primary education formed 6.2% (1085) and those with secondary education 13.6% (2367). Those who had high school and higher secondary education constituted 8099 (46.5%) of the mothers.
When sub grouped into 3, based on the heights of the mothers, 24%, 48% and 28% of the mothers fell into the 3 groups ,whose height was <151 cm; 151-158 cm and >158 cm respectively.
There were 2379 firstborn and 17,092 later born. There were 1236 (6.3%) male babies in the first born group and the first born females were 1143 (5.9%) in number. Among the later born babies, male babies were 8739 (44.9%) in number and females 8353 (42.9%).
Term and preterm first born babies
The male babies of term first born mothers were found to be 45 grams heavier than female babies. The mean birthweights were 2934 grams and 2889.5 grams respectively. Similarly, among the preterms, male babies weighed 152 grams more than the female babies. The mean birthweights were 1996 grams and 1844 grams respectively.
Term and preterm later born babies
In the case of later born babies, term male babies weighed 116 grams more than the females. The mean birth weights were 3085 grams and 2969 grams respectively. When considering preterm babies among the later born, the males outweighed the female babies by 111 grams. The mean birthweights were 2089 grams and 1978 grams respectively.
Table 1 shows the 3rd, 10th, 25th, 50th, 75th, 90th, 97th percentile, mean and SD birth weights for male and female babies of primigravidae. Figures 1 and 2 shows the smoothed percentile curves for male and female babies of first born separately. The growth curves for various percentiles are smooth and increasing steadily as gestational age increases.
Table 1.
Smoothed percentiles for birth weight (grams) of first born male and female babies
|
First born male babies smoothed percentiles |
First born female babies smoothed percentiles |
|||||||||||||||||||
|---|---|---|---|---|---|---|---|---|---|---|---|---|---|---|---|---|---|---|---|---|
| GA | N | C3 | C10 | C25 | C50 | C75 | C90 | C97 | Mean | SD | N | C3 | C10 | C25 | C50 | C75 | C90 | C97 | Mean | SD |
|
31 |
8 |
590 |
871 |
1131 |
1394 |
1637 |
1842 |
2035 |
1427 |
261 |
6 |
601 |
773 |
953 |
1159 |
1369 |
1562 |
1755 |
1146 |
310 |
|
32 |
13 |
744 |
1055 |
1340 |
1630 |
1899 |
2126 |
2340 |
1513 |
496 |
8 |
774 |
976 |
1187 |
1426 |
1670 |
1894 |
2119 |
1400 |
395 |
|
33 |
13 |
939 |
1262 |
1558 |
1861 |
2142 |
2381 |
2606 |
1820 |
529 |
10 |
961 |
1186 |
1421 |
1687 |
1958 |
2207 |
2456 |
1733 |
397 |
|
34 |
23 |
1164 |
1482 |
1777 |
2079 |
2362 |
2604 |
2833 |
2112 |
358 |
11 |
1157 |
1399 |
1649 |
1934 |
2223 |
2488 |
2754 |
2076 |
422 |
|
35 |
33 |
1379 |
1691 |
1981 |
2282 |
2566 |
2809 |
3039 |
2300 |
450 |
16 |
1366 |
1616 |
1874 |
2166 |
2464 |
2735 |
3007 |
1941 |
417 |
|
36 |
53 |
1591 |
1892 |
2176 |
2472 |
2752 |
2993 |
3222 |
2353 |
486 |
43 |
1598 |
1847 |
2104 |
2393 |
2688 |
2957 |
3225 |
2410 |
433 |
|
37 |
124 |
1806 |
2092 |
2365 |
2652 |
2925 |
3160 |
3385 |
2687 |
384 |
81 |
1821 |
2063 |
2311 |
2591 |
2875 |
3134 |
3392 |
2637 |
424 |
|
38 |
196 |
1982 |
2259 |
2524 |
2804 |
3072 |
3304 |
3525 |
2774 |
429 |
184 |
2004 |
2236 |
2474 |
2741 |
3012 |
3259 |
3505 |
2742 |
397 |
|
39 |
269 |
2152 |
2417 |
2673 |
2944 |
3204 |
3429 |
3645 |
2912 |
388 |
265 |
2142 |
2370 |
2604 |
2866 |
3132 |
3374 |
3615 |
2856 |
384 |
|
40 |
308 |
2287 |
2547 |
2798 |
3065 |
3321 |
3544 |
3758 |
3083 |
391 |
321 |
2250 |
2479 |
2714 |
2977 |
3244 |
3487 |
3729 |
2994 |
404 |
|
41 |
82 |
2366 |
2614 |
2855 |
3112 |
3359 |
3575 |
3781 |
3078 |
383 |
91 |
2353 |
2570 |
2792 |
3042 |
3294 |
3523 |
3751 |
3038 |
365 |
| 42 | 7 | 2419 | 2652 | 2877 | 3119 | 3352 | 3555 | 3751 | 2887 | 245 | 11 | 2448 | 2647 | 2851 | 3079 | 3310 | 3520 | 3728 | 3005 | 322 |
GA = Gestational Age (weeks), N = Number of babies in each group, C3 – C97 = Predicted Smoothed percentiles from GAMLSS model Mean & SD = Arithmetic Mean and standard deviation in each group.
Figure 1.
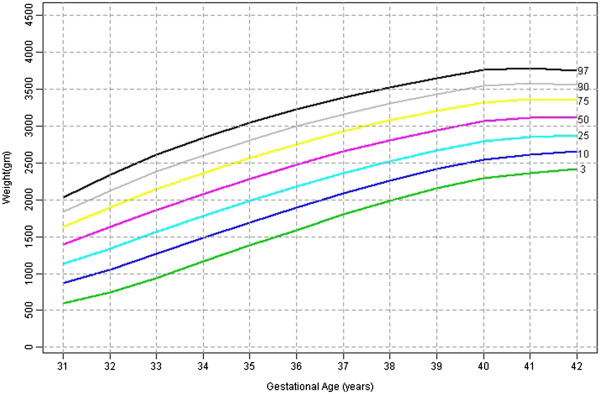
First born male babies smoothed centiles graph for Weight (gms) by gestational age (weeks).
Figure 2.
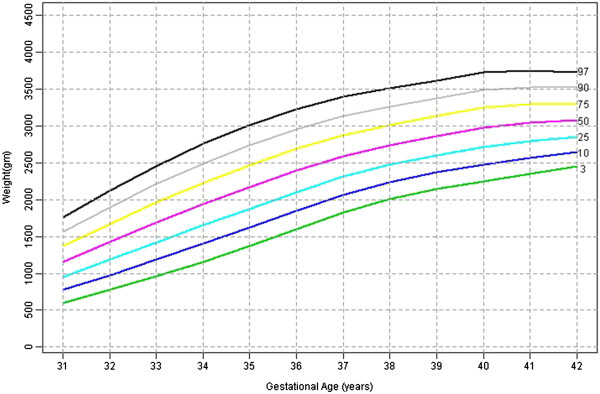
First born female babies smoothed centiles graph for weight (gms) by gestational age (weeks).
Table 2 shows the 3rd, 10th, 25th, 50th, 75th, 90th, 97th percentile, mean and SD birth weights for male and female babies of later born babies. Figures 3 and 4 shows the smoothed percentile curves for male and female babies of later born babies separately.
Table 2.
Smoothed percentiles for birth weight (grams) of later born male and female babies
|
Later born male babies smoothed percentiles |
Later born female babies smoothed percentiles |
|||||||||||||||||||
|---|---|---|---|---|---|---|---|---|---|---|---|---|---|---|---|---|---|---|---|---|
| GA | N | C3 | C10 | C25 | C50 | C75 | C90 | C97 | Mean | SD | N | C3 | C10 | C25 | C50 | C75 | C90 | C97 | Mean | SD |
|
24 |
11 |
73 |
199 |
392 |
645 |
916 |
1172 |
1440 |
663 |
102 |
5 |
55 |
176 |
383 |
679 |
1018 |
1353 |
1714 |
792 |
133 |
|
25 |
9 |
99 |
259 |
491 |
785 |
1096 |
1388 |
1692 |
1099 |
645 |
8 |
75 |
226 |
464 |
787 |
1149 |
1503 |
1882 |
1136 |
833 |
|
26 |
14 |
131 |
328 |
594 |
920 |
1260 |
1578 |
1907 |
914 |
282 |
9 |
104 |
287 |
552 |
895 |
1270 |
1634 |
2021 |
893 |
490 |
|
27 |
16 |
175 |
409 |
704 |
1053 |
1412 |
1745 |
2090 |
1408 |
909 |
13 |
147 |
365 |
652 |
1007 |
1388 |
1753 |
2142 |
1217 |
836 |
|
28 |
22 |
237 |
508 |
824 |
1185 |
1552 |
1892 |
2242 |
1071 |
316 |
18 |
211 |
463 |
766 |
1126 |
1506 |
1869 |
2253 |
1208 |
500 |
|
29 |
14 |
327 |
629 |
958 |
1324 |
1691 |
2031 |
2381 |
1141 |
416 |
24 |
302 |
582 |
894 |
1256 |
1633 |
1991 |
2369 |
1195 |
480 |
|
30 |
45 |
450 |
775 |
1107 |
1470 |
1834 |
2168 |
2513 |
1595 |
721 |
41 |
421 |
720 |
1038 |
1399 |
1772 |
2126 |
2498 |
1470 |
695 |
|
31 |
39 |
610 |
943 |
1271 |
1626 |
1980 |
2306 |
2642 |
1567 |
387 |
51 |
567 |
878 |
1197 |
1557 |
1926 |
2275 |
2642 |
1479 |
451 |
|
32 |
60 |
795 |
1127 |
1449 |
1795 |
2140 |
2457 |
2785 |
1820 |
496 |
51 |
735 |
1052 |
1373 |
1731 |
2099 |
2444 |
2807 |
1621 |
469 |
|
33 |
97 |
997 |
1324 |
1639 |
1978 |
2316 |
2627 |
2947 |
1928 |
461 |
60 |
924 |
1244 |
1564 |
1920 |
2284 |
2626 |
2984 |
1956 |
578 |
|
34 |
104 |
1214 |
1536 |
1844 |
2176 |
2507 |
2812 |
3126 |
2137 |
556 |
116 |
1140 |
1455 |
1769 |
2117 |
2472 |
2804 |
3152 |
2116 |
570 |
|
35 |
187 |
1453 |
1765 |
2064 |
2386 |
2707 |
3002 |
3307 |
2314 |
479 |
160 |
1380 |
1684 |
1984 |
2316 |
2653 |
2968 |
3298 |
2307 |
519 |
|
36 |
323 |
1712 |
2008 |
2293 |
2600 |
2906 |
3188 |
3479 |
2552 |
506 |
232 |
1637 |
1922 |
2202 |
2511 |
2824 |
3117 |
3422 |
2468 |
506 |
|
37 |
745 |
1977 |
2253 |
2518 |
2805 |
3090 |
3353 |
3625 |
2808 |
453 |
599 |
1891 |
2154 |
2412 |
2696 |
2983 |
3251 |
3530 |
2692 |
433 |
|
38 |
1518 |
2210 |
2466 |
2713 |
2979 |
3244 |
3489 |
3741 |
2983 |
395 |
1399 |
2111 |
2355 |
2595 |
2857 |
3122 |
3369 |
3626 |
2867 |
396 |
|
39 |
2145 |
2369 |
2615 |
2852 |
3108 |
3363 |
3598 |
3841 |
3119 |
382 |
2164 |
2273 |
2505 |
2732 |
2980 |
3231 |
3465 |
3707 |
2981 |
377 |
|
40 |
2140 |
2445 |
2692 |
2930 |
3187 |
3443 |
3680 |
3924 |
3187 |
390 |
2160 |
2369 |
2595 |
2816 |
3058 |
3302 |
3529 |
3765 |
3078 |
366 |
|
41 |
475 |
2471 |
2725 |
2969 |
3233 |
3496 |
3739 |
3990 |
3205 |
421 |
507 |
2409 |
2632 |
2850 |
3090 |
3331 |
3555 |
3788 |
3040 |
370 |
| 42 | 53 | 2480 | 2742 | 2994 | 3266 | 3537 | 3788 | 4046 | 3080 | 391 | 57 | 2429 | 2651 | 2869 | 3106 | 3346 | 3569 | 3801 | 3019 | 404 |
GA = Gestational Age (weeks), N = Number of babies in each group, C3 – C97 = Predicted Smoothed percentiles from GAMLSS model Mean & SD = Arithmetic Mean and standard deviation in each group.
Figure 3.
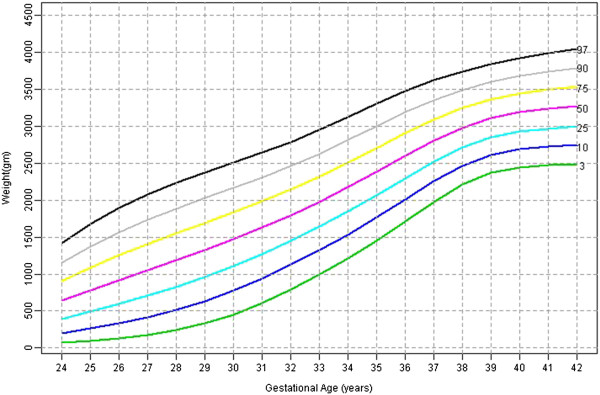
Later born male babies smoothed centiles graph for weight (gms) by gestational age (weeks).
Figure 4.
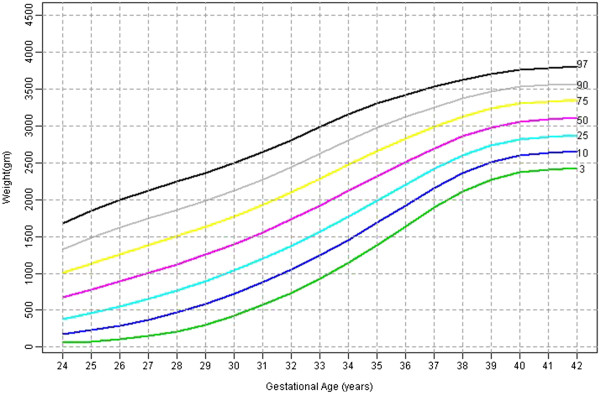
Later born female babies smoothed centiles graph for weight (gms) by gestational age (weeks).
Table 3 presents the agreement between the model (adjusted) and actual data (unadjusted) percentiles for first born and later born male and female babies.
Table 3.
Agreement between unadjusted and adjusted centiles
| |
|
Adjusted centiles |
|
|
|
|
|---|---|---|---|---|---|---|
| < 10th | 10 – 90th | > 90th | Weighted kappa | P value | ||
|
First born male babies: (N = 1217) |
|
|
|
|
|
|
|
Unadjusted centiles |
< 10th |
105 |
8 |
0 |
|
|
|
10 – 90th |
20 |
943 |
18 |
0.883 |
< 0.001 |
|
|
> 90th |
0 |
6 |
117 |
|
|
|
|
Later born male babies: (N = 8739) |
|
|
|
|
|
|
|
Unadjusted centiles |
< 10th |
810 |
43 |
0 |
|
|
|
10 – 90th |
102 |
6791 |
101 |
0.917 |
< 0.001 |
|
|
> 90th |
0 |
25 |
867 |
|
|
|
|
First born female babies: (N = 1121) |
|
|
|
|
|
|
|
Unadjusted centiles |
< 10th |
98 |
8 |
0 |
|
|
|
10 – 90th |
12 |
874 |
16 |
0.897 |
< 0.001 |
|
|
> 90th |
0 |
6 |
107 |
|
|
|
|
Later born female babies: (N = 8353) |
|
|
|
|
|
|
|
Unadjusted centiles |
< 10th |
787 |
10 |
0 |
|
|
|
10 – 90th |
89 |
6551 |
65 |
0.934 |
< 0.001 |
|
| > 90th | 0 | 37 | 814 |
Agreement of centiles for male & female babies among the first born babies
When considering first born male babies, there is significant agreement between adjusted and unadjusted percentile classification (k=.883, p<.001). However, 7% of the male babies in <10th percentile category was misclassified as 10–90th percentile category. Nearly 2% of the babies from 10–90th percentile category was misclassified as <10th and >90th percentile. Nearly 5% of the babies >90th percentile category was misclassified as 10–90th percentile. When considering female babies, there is a significant substantial agreement between the adjusted and unadjusted classifications (k=.897, p<.001). The misclassifications to the next category percentiles rates were the same as in the male babies.
Agreement of centiles for male & female babies within the later born group
There is a significant agreement between adjusted and unadjusted percentile classification (k=.917, p<.01) in later born male babies. However, 5% of the male babies in < 10th percentile category was misclassified as 10–90th percentile category and 1.5% from 10–90th percentile category was misclassified as <10th and >90th percentile category. 2.8% of the >90th percentile category was misclassified as 10–90th percentile category. Similarly, among the later born female babies, there is a significant agreement between adjusted and unadjusted percentile classification (k=.934, p<.01). The misclassifications to the next category percentiles rates were nearly the same as among the male babies.
The mean (sd) of birthweights of the year 1996 was 2846 g (562) as compared to year 2010 (15 years later) which was 2907 (571), there was only a difference of 61 grams in the mean birthweights over one and half decades.
Discussion
This is the biggest study ever from India, dealing with nearly 20,000 deliveries, including normal mothers with no antenatal risk factors from the same hospital covering 15 years. In addition to this, a major advantage is the reliance on early ultrasound-based estimates of gestational ages and appropriate statistical modelling using Box-Cox t distribution to get over the skewness of birth weight distribution and cubic spline smoothing. Therefore, we have established standards for first born and later born mothers for male and female babies separately. Some of the earlier standards have not done these adjustments [1,11] and some of the standards are very old [12,13]. The absence of downturn trend in the curves in the post term period is similar to curves reported [14] and are consistent with evidence based on early ultrasound-based gestational ages [15,16].
This study also compared the unadjusted centiles to adjusted and smoothed centiles. With male babies of first born, 7% of the adjusted <10th percentile was misclassified as 10–90th percentile and nearly each 2% of 10–90th category was misclassified as <10th or >90th percentile category. A similar trend was obtained in female babies of first born and male and female babies of later born babies. Though there is very good agreement in general the highest misclassification rate was nearly 7.5%. Therefore the use of unadjusted percentiles may lead to unnecessary intervention and anxiety for the parents of babies whose weight fall in the range of lower and upper centiles according to adjusted centiles.
The limitation of the study is that the observations are cross-sectional. That is, birth weights of different babies were observed at different gestational ages at delivery. Ideally this has to be longitudinal in nature, that is, the same number of pregnancies and their birth weights have to be observed. Anthropometric measurements during gestation are feasible only using ultra-sound. However, the ultra-sound measurements have not been proved to be valid and reliable [17,18]. Temporal trends toward increasing maternal weight, weight gain during pregnancy due to various socio economic changes that have been taking place in the country in the last one and half decade needs to be studied.
With economic reforms, one expects improvement in birthweights. The mean (sd) of birthweights of the year 1996 was 2846 g (562) as compared to year 2010 (15 years later) which was 2907 (571), there was a difference of only 61 grams in the mean birthweights over one and half decades.
Conclusion
New standards for birth weights of Indian newborns, both term and preterm have been established. In addition, birth weight standards based on the sex of the baby and maternal parity have also been brought out. These new standards will allow interventions to be based on Indian standards.
Consent
Written informed consent was obtained from the patient for publication of this report.
Competing interests
The authors declare that they have no competing interests.
Authors’ contributions
All authors (VS, LJ, TS, AR, JM, RJ) contributed to the design of the study and interpretation of data. (VS, LJ, TS) performed the data analysis. (LJ, RJ) drafted the manuscript. All authors (VS, LJ, TS, AR, JM, RJ) critically revised the manuscript and have approved the final version.
Publishing datasets
The dataset will not be available for publishing online since further research has been planned.
Pre-publication history
The pre-publication history for this paper can be accessed here:
Contributor Information
Velusamy Saravana Kumar, Email: saravanan.biostat1985@gmail.com.
Lakshmanan Jeyaseelan, Email: ljey@cmcvellore.ac.in.
Tunny Sebastian, Email: tuna957@gmail.com.
Annie Regi, Email: annieregi@cmcvellore.ac.in.
Jiji Mathew, Email: jiji_mathew@yahoo.co.in.
Ruby Jose, Email: rubyjose1@gmail.com.
Acknowledgements
I acknowledge Dr. Denny Fleming’s, (Clinical Pharmacologist Christian Medical College Vellore) help in correcting the English of main manuscript.
References
- Mohan M, Prasad SR, Chellani HK, Kapani V. Intrauterine growth curves in north Indian babies: weight, length, head circumference and ponderal index. Indian Pediatr. 1990;27:43–51. [PubMed] [Google Scholar]
- Mathai M, Jacob S, Karthikeyan NG. Birthweight standards for south Indian babies. Indian Pediatr. 1996;33:203–209. [PubMed] [Google Scholar]
- Kramer MS, McLean FH, Boyd ME, Usher RH. The Validity of Gestational Age Estimation by Menstrual Dating in Term, Preterm, and Postterm Gestations. JAMA. 1988;260:3306–3308. doi: 10.1001/jama.1988.03410220090034. [DOI] [PubMed] [Google Scholar]
- Rj D. Population-based intrauterine growth curves from computerized birth certificates. South Med J. 1983;76:1401. doi: 10.1097/00007611-198311000-00020. [DOI] [PubMed] [Google Scholar]
- Gardosi J, Chang A, Kalyan B, Sahota D, Symonds EM. Customised antenatal growth charts. Lancet. 1992;339:283–287. doi: 10.1016/0140-6736(92)91342-6. [DOI] [PubMed] [Google Scholar]
- Zhang J, Bowes J. Birth-weight-for-gestational-age patterns by race, sex, and parity in the United States population. Obstet Gynecol. 1995;86:200–208. doi: 10.1016/0029-7844(95)00142-E. [DOI] [PubMed] [Google Scholar]
- Arbuckle TE, Wilkins R, Sherman GJ. Birth weight percentiles by gestational age in Canada. Obstet Gynecol. 1993;81:39–48. [PubMed] [Google Scholar]
- Roberts C, Mueller L, Hadler J. Birth-weight percentiles by gestational age, Connecticut 1988–1993. Conn Med. 1996;60:131. [PubMed] [Google Scholar]
- Eckler AR. Rotation sampling. Ann Math Stat. 1955;26:664–685. doi: 10.1214/aoms/1177728427. [DOI] [Google Scholar]
- Stasinopoulos DM, Rigby RA. Generalized additive models for location scale and shape (GAMLSS) in R. J Stat Softw. 2007;23:1–46. [Google Scholar]
- Bhatia BD, Bhargava V, Chatterjee M, Kota VL, Singh LI, Jain NP. Studies on fetal growth patterns: intrauterine growth percentiles for singleton live born babies. Indian Pediatr. 1981;18:647–653. [PubMed] [Google Scholar]
- Ghosh S, Bhargava SK, Madhavan S, Taskar AD, Bhargava V, Nigam SK. Intra-uterine growth of North Indian babies. Pediatrics. 1971;47:826–830. [PubMed] [Google Scholar]
- Mittal SK, Singh PA, Gupta RC. Intrauterine growth and low birth weight criteria in Punjabi infants. Indian Pediatr. 1976;13:679–682. [PubMed] [Google Scholar]
- Kramer MS, Platt RW, Wen SW, Joseph KS, Allen A, Abrahamowicz M, Blondel B, Bréart G. A new and improved population-based Canadian reference for birth weight for gestational age. Pediatrics. 2001;108:E35. doi: 10.1542/peds.108.2.e35. [DOI] [PubMed] [Google Scholar]
- McLean FH, Boyd ME, Usher RH, Kramer MS. Postterm infants: too big or too small? Am J Obstet Gynecol. 1991;164:619–624. doi: 10.1016/s0002-9378(11)80035-9. [DOI] [PubMed] [Google Scholar]
- Wilcox M, Gardosi J, Mongelli M, Ray C, Johnson I. Birth weight from pregnancies dated by ultrasonography in a multicultural British population. BMJ. 1993;307:588–591. doi: 10.1136/bmj.307.6904.588. [DOI] [PMC free article] [PubMed] [Google Scholar]
- Secher NJ, Kern Hansen P, Thomsen BL, Keiding N. Growth retardation in preterm infants. Br J Obstet Gynaecol. 1987;94:115–120. doi: 10.1111/j.1471-0528.1987.tb02336.x. [DOI] [PubMed] [Google Scholar]
- Hediger ML, Scholl TO, Schall JI, Miller LW, Fischer RL. Fetal growth and the etiology of preterm delivery. Obstet Gynecol. 1995;85:175–182. doi: 10.1016/0029-7844(94)00365-K. [DOI] [PubMed] [Google Scholar]