Abstract
We explored the rapid qualitative analysis of wheat cultivars with good lodging resistances by Fourier transform infrared resonance (FTIR) spectroscopy and multivariate statistical analysis. FTIR imaging showing that wheat stem cell walls were mainly composed of cellulose, pectin, protein, and lignin. Principal components analysis (PCA) was used to eliminate multicollinearity among multiple peak absorptions. PCA revealed the developmental internodes of wheat stems could be distributed from low to high along the load of the second principal component, which was consistent with the corresponding bands of cellulose in the FTIR spectra of the cell walls. Furthermore, four distinct stem populations could also be identified by spectral features related to their corresponding mechanical properties via PCA and cluster analysis. Histochemical staining of four types of wheat stems with various abilities to resist lodging revealed that cellulose contributed more than lignin to the ability to resist lodging. These results strongly suggested that the main cell wall component responsible for these differences was cellulose. Therefore, the combination of multivariate analysis and FTIR could rapidly screen wheat cultivars with good lodging resistance. Furthermore, the application of these methods to a much wider range of cultivars of unknown mechanical properties promises to be of interest.
Keywords: FTIR, PCA, cell wall, composition, lodging resistance, stem, wheat
Wheat (Triticum aestivum L.) flattening, known as lodging, can reduce the yield, production quality, and mechanical harvesting efficiency of a crop.1 The main method by which growers minimize lodging is by selecting lodging resistant cultivars based on the principle of highest yield elevation.2 However, this method is usually labor-intensive. Thus, we searched for methods that rapidly screen the best cultivars among a large numbers of offspring.
In monocotyledons, the nature and extent of lodging are closely related to stem characteristics, such as stem morphology traits,3,4 anatomical features,4 and chemical components of the stem cell wall.5,6 The plant cell wall is a highly organized composite that contains many different polysaccharides, aromatic substances, and proteins.6 The structure and composition of plant cell walls are ideally suited for the functions they perform. However, the relationship between cell wall components and stem strength is still not clear in terms of the significance of cellulose or lignin.5-8 Kokubo et al.5 and Li et al.6 reported that stem strength was significantly correlated with the content of cellulose in cell walls. However, some investigations have suggested that lignin may also contribute to cell wall strength.6,7 Now this controversy can be further examined with the application of the Fourier transform infrared resonance (FTIR) technique.
A key problem in the study of plant cell wall components has been the methodologies used. The use of probes and gas chromatography-mass spectroscopy (GC-MS) is insufficient for intricating manipulate procedures.9,10 Recently, a fast, effective, and non-destructive method employing FTIR was adopted in the non-targeted analysis of cell wall components. However, the majority of previous studies using FTIR have either focused on cell or tissue differences between treatments and controls or have examined a variety of mutants and wild-types.11 Few studies have compared different species of the same genera,12 and so far none has systematically compared various cultivars of the same species, an important application for screening cultivars from multiple phenotypes.
Possible stress-induced changes in the levels of cell wall-bound phenolics, carbohydrates, and proteins at specific locations along the root elongation zone and beyond have also been investigated by FTIR spectroscopy.11,13 The localized accumulation of cell wall-bound phenolics was visualized in cross-sections from equivalent root regions using UV-fluorescence microscopy14,15 and by in situ staining for lignins.15,16 Here, we used a surgical approach to determine whether the localized accumulation of wall cellulose or lignin occurred in stem tissues that provide stem strength.
To achieve the screening cultivars with high stem strength and lodging resistance, we applied FTIR imaging, principal components analysis (PCA), and cluster analysis. PCA based on FTIR spectra was used as a multivariate method of statistical analysis that has been proven adequate in the identification of structural and architectural changes in cell-wall mutants of plants16 and also in revealing the compositional and architectural heterogeneity related to different regions or varieties of grains.17 The more subtle differences encountered within the spectra of samples would highlight those differences. In this study, we focused on the application of FTIR spectroscopy to analyze stems of wheat cultivars via the spectral fingerprinting of cell walls and identification of chemical differences between different lodging resistance samples. In addition, we developed a rapid method for screening lodging resistant cultivars by using FTIR and PCA.
Results
Common characteristics of FTIR spectra in stems
To establish the segmental distribution of stress-induced cell wall changes, FTIR spectra were collected in the mid-IR range for separate batches of cell wall material. Figure 1 showed the average FTIR spectra at 1,800 to 800 cm−1 for cell wall materials from Xiaoyan81 stems. A typical absorbance was obserbved at 1,738 cm−1 (C = O stretching of the alkyl ester), which is related to pectin. Furthermore, the amide linkage in the protein contributed to a positive band of 1,657 cm−1 in the FTIR spectra, althouth, it was always seen at about 1,650 cm−1 (amide I). In contrast, we found the protein characters of amide III band at 1,257 cm−1 (Fig. 1). Bands at 1,600 and 1,500 cm−1 were also typical of the vibrations of C atom in the aromatic ring, as they were in fact present at 1,614 and 1,518 cm−1 in Xiaoyan81 stem cell walls, together with a slightly positive ratio of the intensities of the bands at 1,431 cm−1 and 1,319 cm−1. The 1,614 cm−1 band appeared to be associated with the α-β double bond on the propanoid side group in the lignin-like structures, and the bands at 1,518 cm−1 corresponded to lignin alone. Also, two bands at 1,319 cm−1 and 1,431 cm−1 could be found in the references. A series of typical spectrum (Fig. 1) showed a main broad absorbance band centered at 1,057 cm−1, with shoulders at 1,109 cm−1 and 1,165 cm−1 related to the polysaccharide components, the band at 901 cm−1 generally represented cellulose. Therefore, the FTIR spectra of the wheat Xiaoyan81 stem cell wall were dominated by absorption bands of polysaccharides, while minor constituents such as protein, ferulic acid, and lignin were also detected (Fig. 1).
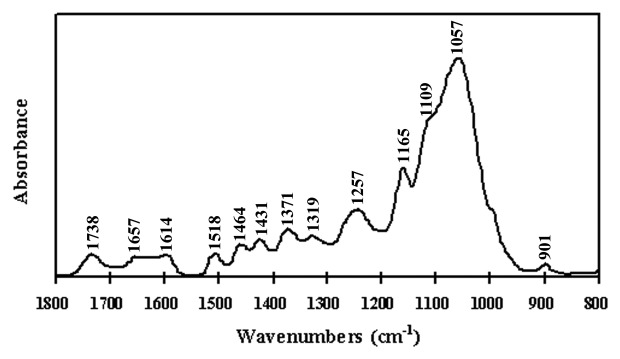
Figure 1. Area-normalized and baseline-corrected FTIR spectra of stem cell walls from Xiaoyan81, one of the most lodging resistant cultivars.
In Figure 1, the spectrum represents the typical trend of observed cell wall components in Xiaoyan81, a pattern that can be extended to other cultivars that were planted in the same experimental plot.
Variation of FTIR spectra between different internodes
For each individual cultivar, there were variations in the components among the five internodes. Although the variations showed slightly similar trends, they were not significant. For example, there were variations in the quantitative values of the representative features among the three cultivars, but they showed a similar trend for the representative components from the lower to the higher internodes. The FTIR spectra did not differ much among the developmental internodes (data not shown). Therefore, it was not possible to use single peak intensity as a predictor of spatial heterogeneity. All the data contained in one spectrum were used in the next investigations.
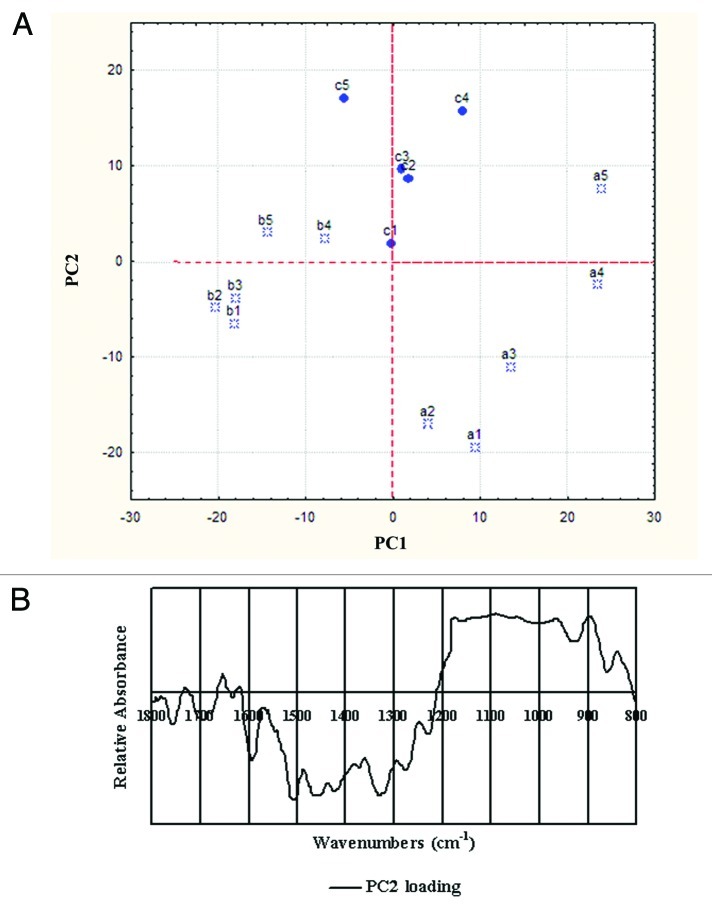
To obtain precise information on the spectral differences among the developmental internodes, the higher lodging resistance parts (lower internodes, a4 and a5, b4 and b5, c4 and c5) and the lower lodging resistance parts (higher internodes, a1–a3, b1–b3, c1–c3) of the three cultivars stems, were chosen for PCA. The principal component (PC) loadings associated with the best spatial separation were not the same for each variety, but by using the entire data set, it was possible to show a location effect (Fig. 2A). Thus, the lower internodes were characterized by having both a higher PC2 score than the higher internodes, though no satisfactory clustering could be obtained through the distribution of the 15 samples along PC1 and PC2 from lower to higher internodes. PC2 accounted for 22.69% of the total variability, indicative of differences in the spectra. The loading showed significant positive peaks in the polysaccharide fingerprint region (1,200–900 cm−1) (Fig. 2B). These data suggest that the higher lodging resistance internode cell walls had a higher cellulose content than the lower internodes. However, these key assignments are insufficient for the investigation of the differences in extractability and hence the composition of the cell walls. The implications resulting from the subtle spectral details should be investigated.
Figure 2. The location effect in the wheat stem internodes, obtained from PCA from the whole data set. (A) Results of the PCA applied to the mean spectra extracted from developmental internodes in the stems. Lower internodes were characterized by a higher PC score 2 than the higher internodes. (B) Second PC loading, which clustered according to location.
PCA of different cultivars
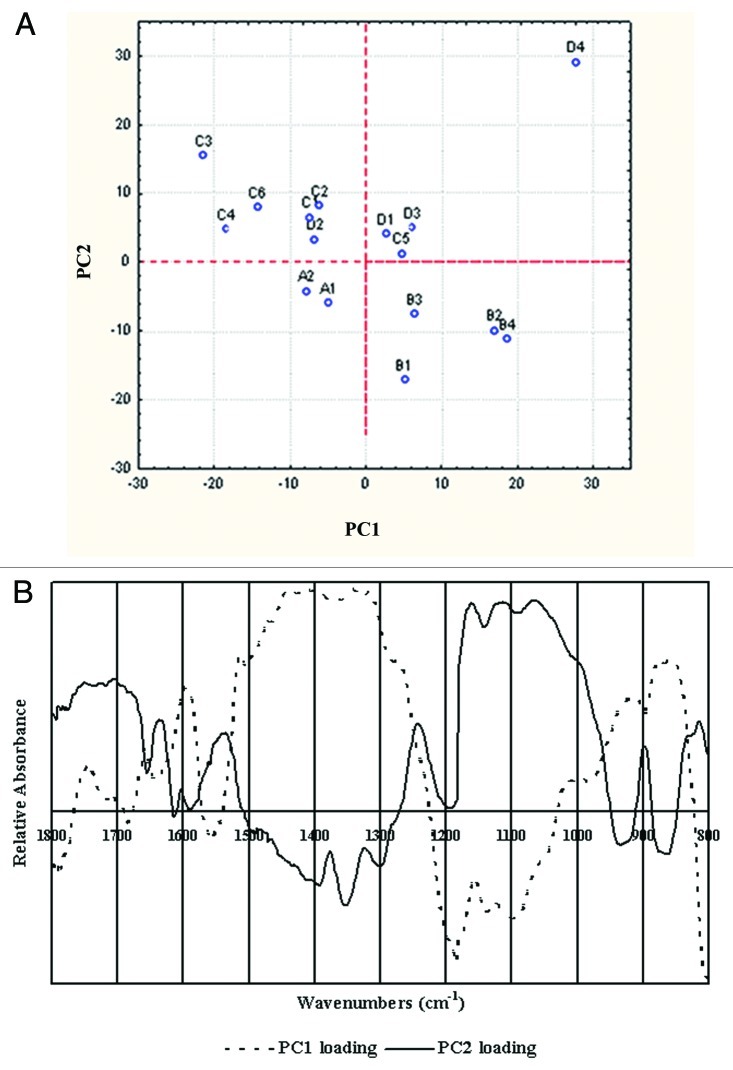
PCA analysis were performed on all immature cultivars (about 15 d after anthesis). Surprisingly, despite the above cultivars with different cell wall defects showing very little variation in FTIR spectroscopy results, the exploratory PCA results could distinguish groups of spectra. PC1 and PC2 could be used to separate the four groups of spectra. The above four groups of spectra were able to be distinguished based on their PC1 and PC2 loadings (Fig. 3A). When the loadings of PC1 and PC2 loadings were analyzed (Fig. 3B), several wave numbers appeared as negative or positive peaks in the both PCs. The PC1 loadings reflected a higher concentrations of aromatic and carbohydrate substances and accounted for 35.30% of spectral variability. Unlike the “lignin” loading (PC1), loading for PC2, which explained 26.80% of the variation, was complex and could not be interpreted as a simple change in components, which were mainly polysaccharides (1,200–900 cm−1). However, in this set of known stem strength cultivars, the exploratory PCA showed that the cultivars could be separated into lodging resistance and lodging properities by PC2. PCA clearly distinguished between the immature cell walls from the high bending stress cultivars and the low bending stress cultivars, as shown in Figure 5.
Figure 3. (A) Typical score plots obtained from PCA applied to the mean cell-wall spectra for the lodging (A1–B4) and lodging resistant (C1–D4) wheats. The best separation was obtained with the second PC score. The more lodging wheats (A, B types) and less lodging wheats (C, D types) could be successfully separated with PC1. (B) First and second PC loadings, which clustered according to the stem mechanical properties.
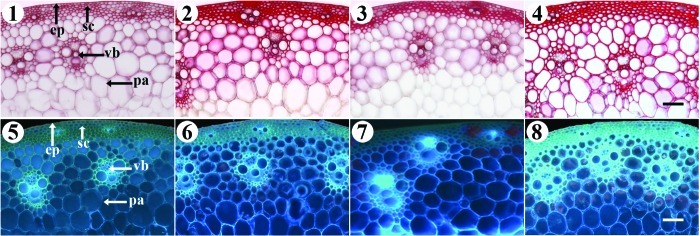
Figure 5. Wiesner’s and calcofluor stainings of lignin and cellulose in A1 (1 and %), B4 (2 and 6), C1 (3 and 7), and D3 (4 and 8) cultivars. 1--4, Wiesner’s staining showing that the maximum lignin content existed in B and D. 5--8, Calcofluor staining showing that the maximum cellulose content was present in C and D. ep, epidermis; sc, sclerenchyma; pa, parenchyma; vb, vascular bundle. Bars = 100 μm.
Cluster analysis of different cultivars
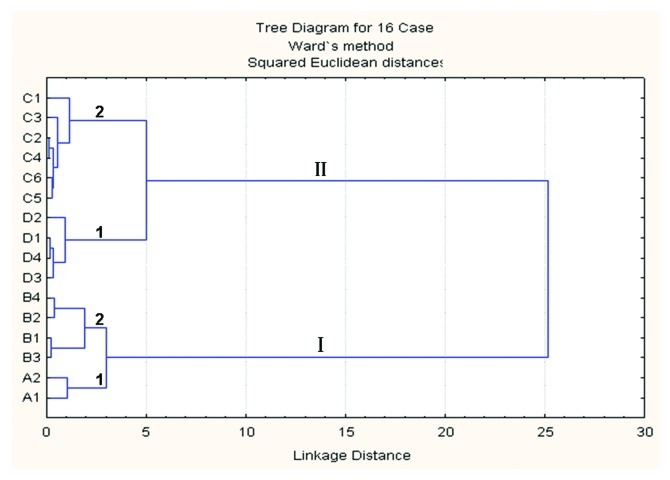
We next investigated whether a classification procedure could provide more information about the chemical differences between the various hierarchies of mechanical properites of wheat stems. To carry out such a classification, we used cluster analysis. The cluster analysis based on the cell wall spectra from all types of wheat displayed two main branches, designated as branches I and II (Fig. 4). The cultivars within branch I were mainly the lodging cultivars. Branch II was separated from branch I by 6 units (squared Euclidean distance), and was comprised of spectra corresponding to stem cell walls of 10 cultivars with lodging resistance. Thus, two groups of wheat stem could be established, corresponding to lodging (I) or lodging resistant (II) stems. Each main branch was split into two sub-branches, named 1 and 2, which were separated by about 3.5 units each. In clusters I and II, the sub-branches (1 and 2) grouped stems according to their lodging resistance level (I1 > I2 and II1 < II2).
Figure 4. Dendrogram obtained from the cluster analysis of lodging resistant (C1-D4) and lodging (A1–B4) cultivars based on their FTIR spectra.
Chemical analysis
To visualize how ligin and cellulose concentration varied among cultivar stems, the cultivars used in this study were stained with Wiesner reagents and calcoflour (Fig. 5). Transverse sections of stems of four kinds of various bending stress cultivars of wheat were histochemically with Wiesner reagents. The difference in lignin compounds of the various bending stress cultivars was easily distinguished by the Wiesner reaction (Fig. 5, 1--4). The color differences occurred in mechanical tissues, particularly in sclerenchyma below the epidermis and the large vascular bandle among the parenchyma, although all the mechanical tissues showed a positive reaction with phloroglucinol-HCl. In comparison with the different bending stress of stems, a noticeable red staining appeared in B and D. Furthermore, as shown in Figure 5 (5--8), the cellulose fluorescence intensity of C and D was significantly stronger than that observed in A and B (among them, rank order of the lodging resistance ability in four kinds of wheat stem was A < B < C < D).
Discussion
Many methods, such as histochemical staining, immunolocalization, and GC-MS have been used to analyze cell wall components.9,10,14,15 These methods, however, are mostly suited for use on bulk samples and are labor-intensive in terms of screening one phenotype from large numbers of cultivars. Efficient analysis methods would probe cell wall features without modifying cell wall architecture by preparative treatments, to rapidly detect cell walls polymer heterogeneity in situ. FTIR microspectroscopy is a powerful and extremely rapid assay for cell wall components and putative cross-links in muro.16 In this study, we found that the absorbance intensities at different wave numbers are related to the concentrations of different molecules such as cellulose, protein and lignin in one cell wall sample. Moreover, cellulose is a major structural component of wheat cell walls, whereas the cell wall is poor in pectin and protein, the result is strongly supported by the findings of Séné et al.11 in Gramineae species. Howerer, a significant amount of aromatic phenolic compounds is also present in these extracted fractions (as shown by the presence of the IR peaks), further confirming the view that FTIR is an effective means to invesigate the chemical components of plant cell walls. However, the FTIR technology applied here is necessary to highlight the subtle compositional or architectural differencs in cell walls. Even so, changes in the spectra are difficult to interpret and require statistical analyses to achieve bulk analysis.
The combination of analytical techniques such as FTIR spectroscopy together with a multivariate analysis by PCA and cluster analysis methods has the potential to provide the possibility of correlating spectral features with chemical or biophysical properties of cell walls in instances where assignments for specific peaks are difficult to make, and can thus begin to generate predictive models. Because the vibrational spectra not only contain qualitative and quantitative information on the chemical structure, but also offer information on molecular conformation and interactions between neighboring molecules, using such data may be appropriate as a new method for numerical identification. Chemometric approaches such as PCA16,17 and cluster analysis12,18,19 can extract the main information from raw data. By applying PCA to the spectra, mutants deficient in different cell wall sugars could be distinguished assuming that the compositional and architectural heterogeneities of cell walls related to grain hardness in wheat endosperm could be distinguished using FTIR imaging coupled with PCA,17 the gap between the different developmental stages can also be observed. In the present study, the derived PC2 loadings were most specific to the carbohydrate fingerprint region of the spectra, unfortunately, we could not assign specific changes at any frequency to a specific type of polysaccharide. Despite this shortcoming, the feasibility of FTIR spectroscopy coupled with PCA as a primary screen for alterations in structure and architecture is clear. Our studies using PCA and cluster analysis indicated that cellulose content may affect the bending strength more than lignin content (Figs. 2–4). Furthermore, peaks diagnostic of polysaccharide were well-resolved in the spectrum, making it possible to screen the wide variety of cultivars that required (even using a curtailed spectral region to minimize spectral variability from cytoplasmic proteins, the 1,420 cm−1 stretch from pectin carboxylate band is a suitable diagnostic peak). Therefore, we concluded that FTIR could provide a convenient method to measure cell wall components when coupled with PCA and cluster analysis.
Plant cell wall strength is affected by a number of parameters, such as thickness, density, and a complex architecture at the molecular level cell wall.3,17,20 This last factor is dependent on the chemical composition of the walls and on the distribution and interactions of components within them.21,22 Cellulose usually constitutes 20–30% and 40–90% of the dry weight of primary and secondary walls, respectively depending on the cell type.8 In some cells, lignin may be incorporated into the cell wall enhancing its mechanical strength.6 However, Köhler and Spatz21 suggested that not all the lignin is mechanically relevant, thus, the overall amount is not necessarily a direct indication of mechanical properties. In addition, in brittle stems, cell wall mutants with decreased stem strength were caused by deficiency in cellulose deposition.5,6 Also, chemical analysis of the basal, middle, and top region of a 10-cm-long internode of maize revealed that the lignin content gradually increases upward, with increased distance from the intercalary meristem.23 However, several studies have reported that cellulose was more directly correlated with stem bending stress than lignin.6 In the present investigation, we found that the main chemical components changing among the developmental internodes of one cultivar were lignin and to a lesser extent cellulose. Hence, it is reasonable to propose that the main cell wall component responsible for wall strength is cellulose.
In summary, our investigation of using FTIR combined with PCA and cluster analysis to detect heterogeneity in stem lodging resistance is feasible. This study provided two novel findings: first, FTIR spectra can be used to identify different classes of stem mechanical properties, and second, cellulose in the cell wall may attribute more to stem lodging resistance than lignin or other components. Taken together, our data from a combination of FTIR, PCA and cluster analysis substantiate the feasibility of characterizing stem lodging resistance at the microscopic level in known cultivars. Future investigations in research method will help evaluate which specific type of polysaccharide of cell wall support stem strength may be.
Materials and Methods
Plant materials
Sixteen wheat (Triticum aestivum L.) cultivars which were supported by Institute of Genetics and Developmental Biology, Chinese Academy of Sciences (CAS) were studied (Table 1), including two highly lodging A (A1 and A2), four lodging B(B1–B4), six lodging resistant C(C1–C6), and four highly lodging resistant D(D1–D4) cultivars. All were sown and harvested from the experimental field of the Institute of Genetics and Development, at CAS, in Changping, Beijing, China. Each internode of the mature stems from different developmental stages of wheat cultivars were collected and fixed in 70% ethanol.
Table 1. Comparison of the bending stresses of 16 wheat stem cultivars.
| No. | Cultivar | The ability of lodging resistance |
|---|---|---|
| A1 |
Bima1 |
- - |
| A2 |
Fengchang3 |
- - |
| B1 |
Xiaoyan6 |
– |
| B2 |
Xiaoyan54 |
– |
| B3 |
Jing411 |
– |
| B4 |
8602 |
– |
| C1 |
Xiaoyan41 |
+ |
| C2 |
1201 |
+ |
| C3 |
140731 |
+ |
| C4 |
Nongda3159 |
+ |
| C5 |
Jinan17 |
+ |
| C6 |
Jinan20 |
+ |
| D1 |
Solid |
++ |
| D2 |
Solid-F1 |
++ |
| D3 |
Xiaoyan81 |
++ |
| D4 | Xiaoyan812454 | ++ |
The ability to resist lodging is indicated by + (more lodging resistant) or – (less lodging resistant).
Preparation of stem cell walls
The material extraction procedure followed the method of Zhong.20 For FTIR analysis, mature stems were ground into fine power in liquid nitrogen. The powder was washed in cold phosphate buffer (50 mM, pH 7.2) five times and extracted twice with 70% ethanol at 70°C for 1 h. After vacuum drying, cell wall materials were assayed by FTIR.
FTIR spectra of stem cell walls
The cell wall materials from the previous step were placed on a barium fluoride window which was supported on the stage of a Nicolet NicPlan IR Microscope accessory of a Nicolet Magna-IR 750 FTIR spectrometer equipped with a liquid nitrogen-cooled mercury cadmium telluride detector. An area of the cell wall (100 × 100 μm) was selected for spectral collection. Sixty-four interferograms were collected in transmission mode with a 4 cm−1 resolution and were co-added together to improve the signal-to-noise ratio for each stem internode. Three spectra were collected from each stem internode, and then averaged and baseline-corrected. The triplicate-averaged spectra were then used in the multivariate analysis. For the wheat stem cell wall screen, a single spectrum was collected in the same way from each of three fractions from each internode.
Data analysis
Exploratory PCA and cluster analysis of the area-normalized spectra in the region 1800- to 800 cm−1 were performed using STATISTICA 6.0 software (StatSoft Co.). Cluster analysis was performed using the Ward method, and the squared Euclidean distance coefficient was selected as the distance measurement.19
Cell wall microscopy
Internodes of four kinds of stems with varying abilities to resist lodging were selected. Transverse sections of 20 μm were cut from the middle of each internode by hand and examined under a light microscope (Olympus, BH2 REC) equipped with a digital camera (JVC, TK1280E, Japan) and an image analyzing system (Leica).
For histochemical lignin localization, Wiesner reactions were performed according to a standard protocol.24 Fresh hand-cut sections (~20 μm thick) from wheat stems were incubated for 2 min in phloroglucin solution (2% in ethanol: water [95:5, v/v]; Sigma), and mounted in 50% HCl. For cellulose staining, free-hand sections were stained with a 0.005% aqueous solution of calcofluor (fluorescent brightener 28; Sigma) for 2 min6 and observed under a fluorescence microscope with the excitation filter BP 365, the chromatic beam splitter FT 395 and the barrier filter LP 420 for calcofluor staining and with bright-field illumination for phloroglucin-HCl staining (Zeiss Axioskop 40). Digital images were recorded using an Axiocam MRC camera.
Acknowledgments
This work was financially supported by the Natural Science Foundation of Fujian Province of China (2010J01140) and the Fujian Province research special funds for public welfare projects (2011R1037-6). We are grateful to Dr Shi-Fu Weng (Peking University) for his technical assistance in FTIR microspectroscopy.
Glossary
Abbreviations:
- FTIR
fourier transform infrared resonance
- PCA
principal components analysis
- PC
principal component
- UV
ultraviolet
- CAS
Chinese Academy of Sciences
- VB
vascular bandle
Disclosure of Potential Conflicts of Interest
No potential conflicts of interest were disclosed.
Footnotes
Previously published online: www.landesbioscience.com/journals/psb/article/20468
References
- 1.Foulkes MJ, Slafer GA, Davies WJ, Berry PM, Sylvester-Bradley R, Martre P, et al. Raising yield potential of wheat. III. Optimizing partitioning to grain while maintaining lodging resistance. J Exp Bot. 2011;62:469–86. doi: 10.1093/jxb/erq300. [DOI] [PubMed] [Google Scholar]
- 2.Berry PM, Spink J. Sterling, Pickett AA. Methods for Rapidly Measuring the lodging Resistance of Wheat Cultivars. J Agron Crop Sci. 2003;189:390–401. doi: 10.1046/j.0931-2250.2003.00062.x. [DOI] [Google Scholar]
- 3.Kashiwagi T, Ishimaru K. Identification and functional analysis of a locus for improvement of lodging resistance in rice. Plant Physiol. 2004;134:676–83. doi: 10.1104/pp.103.029355. [DOI] [PMC free article] [PubMed] [Google Scholar]
- 4.Wu LL, Liu ZL, Wang JM, Zhou CY, Chen KM. Morphological, anatomical, and physiological characteristics involved in development of the large culm trait in rice. Aust J Crop Sci. 2011;5:1356–63. [Google Scholar]
- 5.Kokubo A, Sakurai N, Kuraishi S, Takeda K. Culm brittleness of barley (Hordeum vulgare L.) mutants is caused by smaller number of cellulose molecules in cell wall. Plant Physiol. 1991;97:509–14. doi: 10.1104/pp.97.2.509. [DOI] [PMC free article] [PubMed] [Google Scholar]
- 6.Li YH, Qian Q, Zhou YH, Yan MX, Sun L, Zhang M, et al. BRITTLE CULM1, which encodes a COBRA-like protein, affects the mechanical properties of rice plants. Plant Cell. 2003;15:2020–31. doi: 10.1105/tpc.011775. [DOI] [PMC free article] [PubMed] [Google Scholar]
- 7.Jones L, Ennos AR, Turner SR. Cloning and characterization of irregular xylem4 (irx4): a severely lignin-deficient mutant of Arabidopsis. Plant J. 2001;26:205–16. doi: 10.1046/j.1365-313x.2001.01021.x. [DOI] [PubMed] [Google Scholar]
- 8.Taylor NG, Scheible WR, Cutler S, Somerville CR, Turner SR. The irregular xylem3 locus of Arabidopsis encodes a cellulose synthase required for secondary cell wall synthesis. Plant Cell. 1999;11:769–80. doi: 10.1105/tpc.11.5.769. [DOI] [PMC free article] [PubMed] [Google Scholar]
- 9.Cavalier DM, Lerouxel O, Neumetzler L, Yamauchi K, Reinecke A, Freshour G, et al. Disrupting two Arabidopsis thaliana xylosyltransferase genes results in plants deficient in xyloglucan, a major primary cell wall component. Plant Cell. 2008;20:1519–37. doi: 10.1105/tpc.108.059873. [DOI] [PMC free article] [PubMed] [Google Scholar]
- 10.Stork J, Harris D, Griffiths J, Williams B, Beisson F, Li-Beisson Y, et al. CELLULOSE SYNTHASE9 serves a nonredundant role in secondary cell wall synthesis in Arabidopsis epidermal testa cells. Plant Physiol. 2010;153:580–9. doi: 10.1104/pp.110.154062. [DOI] [PMC free article] [PubMed] [Google Scholar]
- 11.Séné CFB, McCann MC, Wilson RH, Grinter R. Fourier-Transform Raman and Fourier-Transform Infrared Spectroscopy (An Investigation of Five Higher Plant Cell Walls and Their Components) Plant Physiol. 1994;106:1623–31. doi: 10.1104/pp.106.4.1623. [DOI] [PMC free article] [PubMed] [Google Scholar]
- 12.Palmucci P, Giordano M. Is cell composition related to the phylogenesis of microalgae? An investigation using Hierarchical Cluster Analysis of Fourier Transform Infrared spectra of whole cells. Environ Exp Bot. 2012;75:220–4. doi: 10.1016/j.envexpbot.2011.07.005. [DOI] [Google Scholar]
- 13.Carpita NC, McCann MC. The functions of cell wall polysaccharides in composition and architecture revealed through mutations. Plant Soil. 2002;247:71–80. doi: 10.1023/A:1021115300942. [DOI] [Google Scholar]
- 14.van de Mortel JE, Almar Villanueva L, Schat H, Kwekkeboom J, Coughlan S, Moerland PD, et al. Large expression differences in genes for iron and zinc homeostasis, stress response, and lignin biosynthesis distinguish roots of Arabidopsis thaliana and the related metal hyperaccumulator Thlaspi caerulescens. Plant Physiol. 2006;142:1127–47. doi: 10.1104/pp.106.082073. [DOI] [PMC free article] [PubMed] [Google Scholar]
- 15.Zhou JL, Lee CH, Zhong RQ, Ye ZH. MYB58 and MYB63 are transcriptional activators of the lignin biosynthetic pathway during secondary cell wall formation in Arabidopsis. Plant Cell. 2009;21:248–66. doi: 10.1105/tpc.108.063321. [DOI] [PMC free article] [PubMed] [Google Scholar]
- 16.Sindhu A, Langewisch T, Olek A, Multani DS, McCann MC, Vermerris W, et al. Maize Brittle stalk2 encodes a COBRA-like protein expressed in early organ development but required for tissue flexibility at maturity. Plant Physiol. 2007;145:1444–59. doi: 10.1104/pp.107.102582. [DOI] [PMC free article] [PubMed] [Google Scholar]
- 17.Barron C, Parker ML, Mills ENC, Rouau X, Wilson RH. FTIR imaging of wheat endosperm cell walls in situ reveals compositional and architectural heterogeneity related to grain hardness. Planta. 2005;220:667–77. doi: 10.1007/s00425-004-1383-6. [DOI] [PubMed] [Google Scholar]
- 18.Kim SW, Ban SH, Chung H, Cho S, Chung HJ, Choi PS, et al. Taxonomic discrimination of flowering plants by multivariate analysis of Fourier transform infrared spectroscopy data. Plant Cell Rep. 2004;23:246–50. doi: 10.1007/s00299-004-0811-1. [DOI] [PubMed] [Google Scholar]
- 19.Mouille G, Robin S, Lecomte M, Pagant S, Höfte H. Classification and identification of Arabidopsis cell wall mutants using Fourier-Transform InfraRed (FT-IR) microspectroscopy. Plant J. 2003;35:393–404. doi: 10.1046/j.1365-313X.2003.01807.x. [DOI] [PubMed] [Google Scholar]
- 20.Zhong RQ, Burk DH, Morrison WH, 3rd, Ye ZH. A kinesin-like protein is essential for oriented deposition of cellulose microfibrils and cell wall strength. Plant Cell. 2002;14:3101–17. doi: 10.1105/tpc.005801. [DOI] [PMC free article] [PubMed] [Google Scholar]
- 21.Köhler L, Spatz HC. Micromechanics of plant tissues beyond the linear-elastic range. Planta. 2002;215:33–40. doi: 10.1007/s00425-001-0718-9. [DOI] [PubMed] [Google Scholar]
- 22.McCartney L, Ormerod AP, Gidley MJ, Knox JP. Temporal and spatial regulation of pectic (1-->4)-β-D-galactan in cell walls of developing pea cotyledons: implications for mechanical properties. Plant J. 2000;22:105–13. doi: 10.1046/j.1365-313x.2000.00719.x. [DOI] [PubMed] [Google Scholar]
- 23.Scobbie L, Russell W, Provan GJ, Chesson A. The newly extended maize internode: a model for the study of secondary cell wall formation and consequences for digestibility. J Sci Food Agric. 1993;61:217–25. doi: 10.1002/jsfa.2740610213. [DOI] [Google Scholar]
- 24.Strivastava LM. Histochemical studies on lignin. Tappi. 1966;49:173–83. [Google Scholar]


