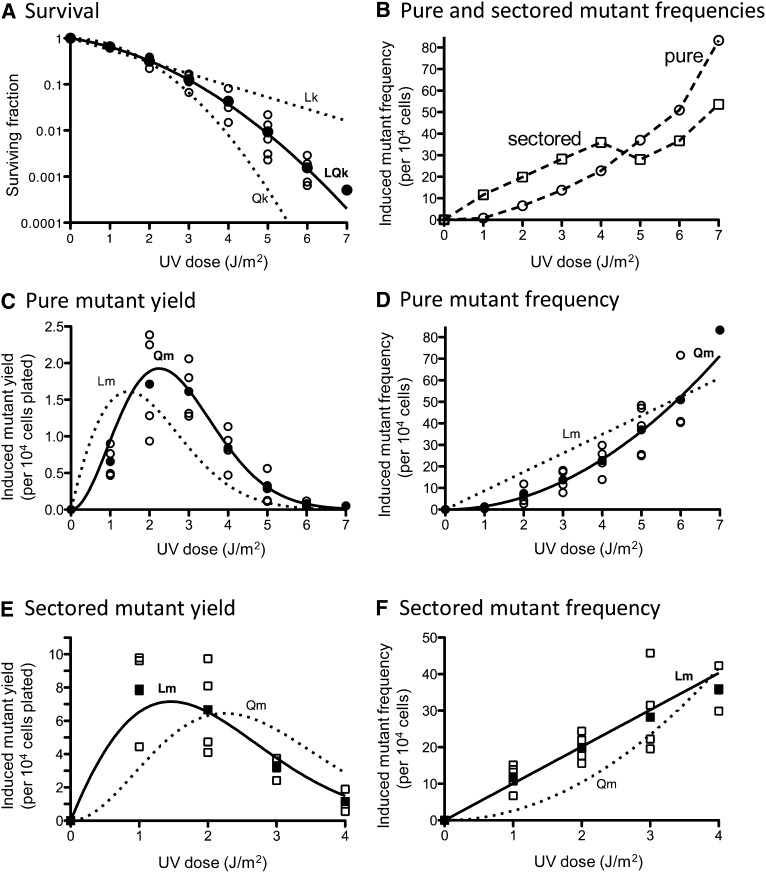
Figure 8.
UV-induced killing and mutagenesis in an NER-deficient (rad14Δ) strain. (A) UV-induced killing. Survival values obtained in three to five independent experiments (open symbols) and average values (solid symbols) are plotted. The data are best fit (R2 = 0.9999) with a linear-quadratic killing curve (LQk, solid line) with coefficients of lethality k1 = 0.3024 (J/m2)−1 and k2 = 0.1305 (J/m2)−2. Approximation of the data with linear (Lk) or quadratic (Qk) functions is represented as dotted lines. (B) The average values of UV-induced pure white (circles) and red-white sectored ade2 adeX mutant frequencies (squares) obtained in three to five independent experiments are shown. (C) Yields of UV-induced pure white ade2 adeX mutants. For each UV dose, values obtained in three to four independent experiments (open circles) and average values (solid circles) are plotted. The data are best fit (R2 = 0.9657) with a quadratic mutagenesis curve (Qm, solid line) with the coefficient of mutability m2 = 1.455 (J/m2)−2. An approximation of the data with a linear mutagenesis function (Lm) is represented as a dotted line. The approximation with a linear-quadratic function is not represented due to a negative m1 value. (D) Frequencies of UV-induced pure white ade2 adeX mutants. For each UV dose, values obtained in three to four independent experiments (open circles) and average values (solid circles) are plotted. The data are best fit (R2 = 0.9747) with a quadratic mutagenesis curve (Qm, solid line) with the coefficient of mutability m2 = 1.455 (J/m2)−2. Approximation of the data with a linear mutagenesis function (Lm) is represented as dotted line. An approximation with a linear-quadratic function is not shown due to a negative m1 value. (E) Yields of UV-induced red-white sectored ade2 adeX mutants. For each UV dose, the values obtained in three to four independent experiments (open squares) and average values (solid squares) are plotted. The data are best fit (R2 = 0.9503) with a linear mutagenesis curve (Lm, solid line) with the coefficient of mutability m1 = 10.06 (J/m2)−1. Approximation of the data with a quadratic mutagenesis function (Qm) is represented as dotted line. An approximation with a linear-quadratic function is not represented due to a negative m1 value. (F) Frequencies of UV-induced red-white sectored ade2 adeX mutants. For each UV dose, values obtained in three to four independent experiments (open squares) and the average values (solid squares) are plotted. The data are best fit (R2 = 0.9683) with a linear mutagenesis curve (Lm, solid line) with the coefficient of mutability m1 = 10.06 (J/m2)−1. Approximation of the data with a quadratic mutagenesis function (Qm) is represented as dotted line. An approximation with a linear-quadratic function is not shown due to a negative m1 value.

