

Abstract
Purpose
This study compares pulmonary vein and left atrial anatomy using 3D free-breathing whole-heart magnetic resonance imaging (MR) at 3T and multi-detector computed tomography (MDCT).
Materials and Methods
Thirty three subjects (19 male, age 49±12 years) underwent free-breathing 3T MR and contrast-enhanced MDCT during inspiratory breath hold. Pulmonary vein parameters (ostial areas, diameters, angles) were measured.
Results
All pulmonary veins and anomalies were identified by 3T MR and by MDCT. The right-sided pulmonary veins were directed more posteriorly, the right superior pulmonary vein more inferiorly, and the right inferior pulmonary vein more superiorly by 3T MR when compared with MDCT. The cross-sectional area, perimeters and minimum diameters of right-sided pulmonary vein ostia were significantly larger by MR, as were the maximum diameters of right and left inferior pulmonary veins. There were no significant differences between techniques in distance to first pulmonary vein branch.
Conclusion
Pulmonary vein measurements demonstrated significant differences in angulations and dimensions when 3T MR is compared with MDCT. These differences likely represent hemodynamic and respiratory variation during free-breathing with MR versus breath-holding with MDCT. MR imaging at 3T during free-breathing offers an alternate method to define pulmonary vein and left atrial anatomy without exposure to radiation.
Keywords: magnetic resonance imaging, multidetector computed tomography, atrium, pulmonary vein, vessels
INTRODUCTION
When atrial fibrillation is refractory to drug treatment, one possible therapy is catheter ablation to isolate an arrhythmogenic focus in a pulmonary vein (PV) from the left atrium (LA) (1). Accurate measurement of PV ostial parameters is important to determine optimal size of a perimetric mapping or ablation catheter (2). It is also essential to obtain a detailed knowledge of anatomic relations, presence of accessory veins, and common ostia at the LA-PV junction to reduce post-procedural problems such as remodeling of LA and PV, and PV thrombosis or stenosis (3–9). State-of-the-art assessment techniques involve integration of 3D reformatted pre-procedural images of LA and PV with an electro-anatomic map obtained during ablation to reduce radiation exposure and to improve procedural safety and efficacy (3,10). Multi-detector computed tomography (MDCT) or magnetic resonance imaging (MR) is used for PV angiography (4,6,8,11). MDCT provides high resolution 3-dimensional images to construct volume renderings of delicate structures and to facilitate accurate catheter orientation. However, breath-holding required during MDCT and most 1.5T MR sequences can alter the usual anatomic layout of the LA-PV junction observed during normal respiration (12–14).
Compared to 1.5T, 3T offers higher signal-to-noise ratio that may be traded for better spatial resolution and reduced acquisition times by using parallel imaging techniques (15). Additionally, the slower change in TI relaxation at 3T allows for a more consistent determination of the nulling time and longer acquisitions using T1 inversion recovery techniques at 3T to achieve the desired myocardial nulling. This, in combination, with a smaller voxel size thereby improves image quality and patient comfort using free breathing techniques (16). Image acquisition during free breathing may also be useful as it resembles more closely anatomical and physiological conditions present during catheter intervention that is performed during normal breathing.
This pilot study investigates the feasibility of free-breathing whole-heart inversion recovery-prepared contrast-enhanced imaging optimized at 3T for adequate anatomical assessment of PVs and LA. Parameters measured from 3D whole heart acquisition obtained during free-breathing 3T MR imaging were compared with those measured using contrast-enhanced MDCT angiography during an inspiratory breath hold.
MATERIALS AND METHODS
Study Population
Thirty three healthy subjects with cardiovascular risk factors (19 males, mean age 49 ± 12 years, range 19–73) gave written informed consent for cardiac MDCT and 3T MR imaging as part of a research protocol approved by the local Institutional Review Board and compliant with patient privacy rules. No subject had a known congenital cardiac anomaly or any thoracic process that would distort the anatomy of the PVs.
Multi-detector Computed Tomography (MDCT)
MDCT angiography was performed on all subjects using a 16-detector CT scanner (Brilliance 16, Philips Healthcare). The MDCT protocol was similar to previously described techniques (17). Briefly, 50–100 mg of metoprolol was administered orally 30–60 minutes before MDCT to lower the heart rate below 65 beats per minute. Nitroglycerin was not used. Single breath hold MDCT was performed using a tube voltage of 120 kV, a current of 400–500 mAs, 220-mm field of view, and retrospective ECG gating. Nonionic vascular contrast enhancement material (120–130 ml of iopamidol, Isovue, Bracco Diagnostics) followed by 50 ml normal saline was injected through an 18- to 20-gauge peripheral venous access at a rate of 4–5 ml/s. Post processing analysis and interpretation of the axial and the multiplanar reformatted images were performed by consensus of two readers using a 3D software tool (Virtual Place, AZE, Japan).
Magnetic Resonance Imaging
All participants underwent MR imaging performed using a 3T Intera system (Philips Medical Systems, Best, The Netherlands), a six-element cardiac phased-array receiver coil, and vector electrocardiographic gating. After preparatory scans, a free-breathing 3D inversion recovery (IR) imaging technique, that has been described for coronary MR at 3T, was used for all subjects (18,19). Intravenous contrast (0.2 mmol/kg of 500 mM Gd-BOPTA) followed by the same volume of normal saline was injected using a power-injector (Spectris, Medrad, Warrendale, PA) at a rate of 0.2cc/sec. A whole-heart acquisition using inversion-recovery preparation (IRprep) pulse was performed starting 5 minutes after the start of contrast injection. The whole -heart scan utilized respiratory navigator for respiratory gating (acceptance window=5mm). A 3D volume acquisition covering the whole heart segmented gradient echo sequence (TR/TE=4.4/1.4msec, turbo factor=27, 20° flip angle, 60 2-mm-thick partitions interpolated to 120-mm-thick partitions during reformatting) was performed in the transaxial plane, with an acquired voxel size of 1 × 1 × 2 mm3. The inversion time for IRprep was set at 220ms to allow nulling of the myocardium with an acquisition window of 119ms set for diastolic rest period. Parallel imaging was utilized (SENSE factor of 2). Images were acquired on the same day as the MDCT. The prescribed acquisition time was 4.55 minutes, and completed in 10–12 minutes with a navigator efficiency of 50%–60%. Maximum intensity projections and multiplanar reformatted images of left atrium and pulmonary veins were obtained to be reviewed by two readers in consensus on a 3D software tool (Virtual Place, AZE, Japan). Studies were ordered randomly and data were analyzed in the diastolic rest period by two blinded readers.
Assessment of Pulmonary Veins and Left Atrium
The LA was inspected for location of PVs, including right superior (RSPV), right inferior (RIPV), left superior (LSPV), and left inferior (LIPV), as well as any anomalous veins. The true ostial plane of the PVs and parameters were determined from MDCT and MR images applying a previously established method using orthogonal planes (transverse, sagittal, and coronal) and multiplanar reformatting (2,20). Briefly, the central axis of each PV was identified by drawing a line along the center of the PV on the transverse images. Images were reformatted along the line. Then, a line perpendicular to the central axis of the PV was placed at the ostium of each PV (Figure 1), defined as the most proximal image in which the PV was distinct from the LA. A coronal-oblique image perpendicular to the pre-defined central axis was reformatted. Antero-posterior (AP) and superior-inferior (SI) angles were measured between the central axis of each PV (solid lines) and the subject’s coronal (A, D) and axial (B, E) planes respectively (dotted lines; Figure 1).
Figure 1.
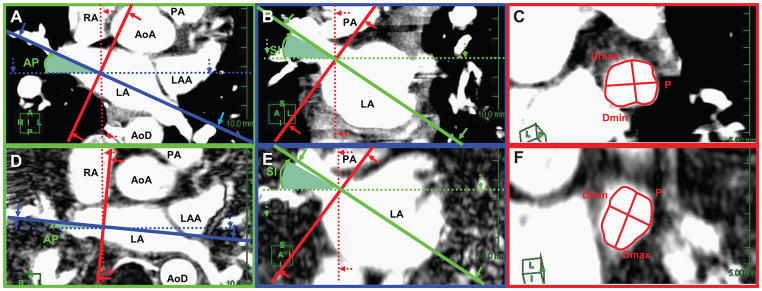
Illustration of pulmonary vein (PV) measurements in coronal, axial and sagittal planes of the heart (solid lines) in relation to the subject planes (dotted lines) using MDCT (A, B, C) and 3T MR (D, E, F) images. The central axis of the proximal part of the PV and the PV-left atrial junction are defined on the axial (A, D) and coronal (B, E) images. The PV ostial plane (red line) was identified by constructing lines perpendicular to the PV central axis at the level of the PV ostium. Antero-posterior (AP) and superior-inferior (SI) angles were measured between the central axis of each PV (solid lines) and the subject’s coronal (A, D) and axial (B, E) planes respectively (dotted lines). On the reformatted cardiac sagittal plane (panels C and F), the PV ostium is seen in cross-section. The perimeter (P) and maximum (Dmax) and minimum (Dmin) diameters were measured.
(Key: Dotted lines = patient planes: coronal (blue), axial (green), and sagittal (red). Solid lines = cardiac planes: coronal (blue), axial (green), and sagittal (red). AoA, ascending aorta; AoD, descending aorta; LA, left atrium; LAA, left atrial appendage; PA, pulmonary artery; RA, right atrium)
The reformatted oblique-sagittal plane perpendicular to the central axis of the PV and the junction of the PV wall and LA wall was defined as the ostial plane. A common ostium was present if the PVs united before merging with the outer LA contour in the orthogonal planes. If a common ostium was present, the ostial plane for each PV was identified and measured separately.
Using reformatted oblique sagittal images, the perimeter (P) and cross sectional area (CSA) of PV ostia were outlined and measured (Figure 1). The maximum and minimum diameters of PV ostia (Dmax, Dmin) were measured with calipers placed across the ostial plane. The ratio Dmax/Dmin estimated roundness. The distance to the first PV branch was measured from the registered oblique-sagittal ostial plane to the parallel plane where separation of first branch was visible. All measurements were repeated three times and mean values generated.
Variability in Measurements
PV measurements were determined by consensus of two blinded readers. These measurements were compared with results generated by semi-automated electrophysiologic planning 3D software (Extended Brilliance Workspace, Phillips, Netherlands).
Intraobserver variability was estimated by comparison of repeated measurements by the same observer.
Statistical Analysis
This pilot study used Bland Altman plots to assess relative bias (mean difference) and limits of agreement (mean difference ± 2 standard deviations of difference) between MDCT and MR measures of PV angulation, ostial parameters and distance to first PV branch (21). If differences were observed, further comparison was made between the groups using Student’s t test (22). Correlation coefficients were calculated. To determine any differences in size between the PVs, ostial parameter measures were compared by one-way ANOVA and then by Student Newman-Keul test. All data were expressed as mean ± standard deviation (SD) or as mean bias ± 1.96SD for Bland Altman plots. A p value < 0.05 was considered statistically significant. Data were analyzed using Medcalc (MedCalc Software Bvba, Belgium).
RESULTS
A common left PV ostium was present in 7 (21%) patients and a common right PV ostium in 2 (6%) patients. There was one anomaly, a right intermedius PV. There was 100% concordance in detection of veins between the two techniques (3T MR and MDCT).
Variability in Observations
Bland Altman plots were generated to compare the consensus measure from two observers with the measures generated by the semi-automated software. The mean differences were not statistically significant by paired t-test. (RSPV: CSA,1.2±10.3% ; Dmax, −1.1±8.7%; Dmin, −3.6±14.5%; RIPV: CSA, −2.4±20.2%; Dmax, −6.6±20.9%; Dmin, −4.4±14.8%; LSPV: CSA, −0.6±10%; Dmax, −1.6±9.4%; Dmin, −3.9±10.1%; LIPV: CSA, 2.5±9.6%; Dmax, −2.5±12.8%; Dmin, −5.3±20.2%).
Bland Altman plots were generated to assess intraobserver variability. The mean differences were not statistically significant by paired t-test. (RSPV: CSA, −0.80±8.4% ; P 0.30±8.4% ; Dmax, −0.90±6.6%; Dmin, 0.20±10.05%; RIPV: CSA, 0.80±9.4%; P 0.40±6.75% ; Dmax, −0.10±7.05%; Dmin, 0.30±9.1%; LSPV: CSA, −1.20±8.2%; P −0.20±6.3% ; Dmax, 0.30±7.1%; Dmin, −0.80±8.7%; LIPV: CSA, =1.20±8.2%; P −0.40±6.5% ; Dmax, −0.50±6.9%; Dmin, −1.60±11.6%).
Angulation of PV Ostia
The PV angles for MDCT and MR studies are displayed in Figure 2. Bland Altman plots demonstrated that 97% of the comparisons between MDCT and MR were bounded by ±1.96 SD in both AP and SI angles (Figure 3). There was a statistically significant bias between MDCT and MR angulation for the right sided PVs in AP and SI angles but no significant difference for the left sided veins (Figure 2 and Table 1). The limits of agreement for bias spread varied between ±13.4° (1.96 SD; RSPV in SI angle) and ±26.7° (LIPV in SI angle).
Figure 2.
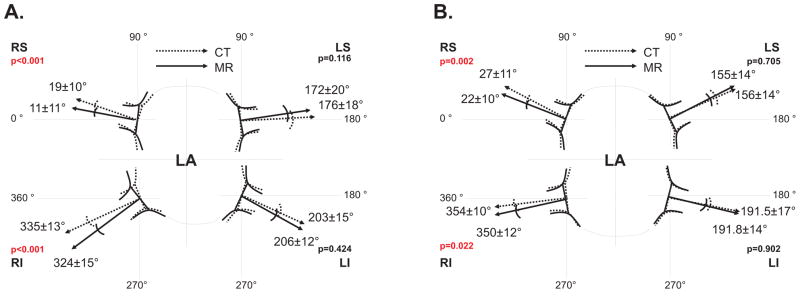
Projection of anteroposterior (AP; panel a) and superoinferior (SI; panel b) angles (measured by MDCT and 3T MR) of the pulmonary ostial plane in the transverse (A) and coronal (B) planes. (Key: CT, multidetector computed tomography; LA, left atrium; LI, left inferior PV; LS, left superior PV; MR, magnetic resonance imaging; PV, pulmonary vein; RI, right inferior PV; RS, right superior PV)
Figure 3.
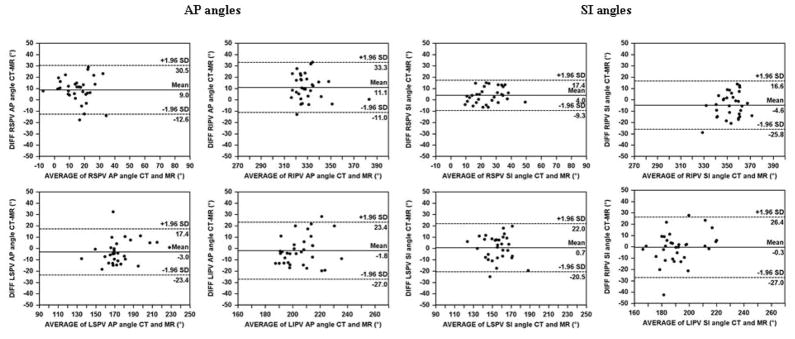
Bland Altman plots for the anteroposterior (AP) and superoinferior (SI) angles of the pulmonary vein ostial plane measured by MDCT and 3T MR.(AP, anteroposterior; CT, multidetector computed tomography; LI, left inferior; LS, left superior; MR, magnetic resonance imaging; PV, pulmonary vein; RI, right inferior; RS, right superior; SI, superoinferior)
Table 1.
Comparison of pulmonary vein angulation by MDCT and MR imaging
| MDCT | MR | Mean difference* | Limits of agreement* | p† | r‡ | |
|---|---|---|---|---|---|---|
|
|
||||||
| AP Angle | ||||||
| RSPV | 19.7±10.1 | 11.1±11.1 | 9.0 | 30.5, −12.6 | <0.001 | 0.47 |
| RIPV | 335.2±13.1 | 323.9±14.7 | 11.1 | 33.3, −11.0 | <0.001 | 0.68 |
| LSPV | 172.7±19.6 | 176.1±17.6 | −3.0 | 17.4, −23.4 | 0.116 | 0.86 |
| LIPV | 203.7±15.5 | 206.2±12.4 | −1.8 | 23.4, −27.0 | 0.424 | 0.58 |
| SI Angle | ||||||
| RSPV | 27.4±11.1 | 22.7±9.6 | 4.0 | 17.4, −9.3 | 0.002 | 0.79 |
| RIPV | 350.9±12.3 | 354.6±10.4 | −4.6 | 16.6, −25.8 | 0.022 | 0.55 |
| LSPV | 156.4±13.6 | 155.1±14.4 | 0.7 | 22.0, −20.5 | 0.705 | 0.7 |
| LIPV | 191.5±16.9 | 191.8±13.6 | −0.3 | 26.4, −27.0 | 0.902 | 0.62 |
Mean difference and limits of agreement determined from Bland Altman plots;
Student t-test p values for differences between MDCT and MR angles;
correlation coefficient for MDCT and MR angles.
AP, anteroposterior; LI, left inferior; LS, left superior; MDCT, multidetector computed tomography; MR, magnetic resonance imaging; PV, pulmonary vein; RI, right inferior; RS, right superior; SI, superoinferior
There was a significant correlation coefficient between MDCT and MR angles for each PV (Table 1, p < 0.01 for all values).
Measurement of PV Ostium Parameters
The PV ostium parameters are compared in Table 2. There was good agreement without significant bias between all LSPV parameters measured by MDCT and MR (Table 2). For the other PVs, CSA and P were significantly smaller by MDCT compared with MR. The percentage systematic bias in CSA for MDCT varied from −13.8±29.5% (±1.96 SD; RIPV), −13.7±32.8% (RSPV), to −7.6±40.8% (LIPV). The percentage systematic bias in perimeter (P) for MDCT varied from −6.1±18.8% (±1.96SD, RSPV); −7.3±13.9% (RIPV) to −3.9±21.3% (LIPV). PV diameters showed minor differences, and where these were statistically significant, diameters were typically smaller by MDCT than MR (Table 2). Comparing MDCT and MR, Dmax was significantly smaller by MDCT in the inferior veins (RIPV −8.1±18.4%; LIPV −6.5±23.7%) and Dmin was significantly smaller by MDCT for the right sided veins, but these latter differences were < 5%.
Table 2.
Comparison of pulmonary vein ostial parameters by MDCT and MR imaging
| MDCT | MR | Mean difference* | Limits of agreement* | p† | r‡ | |
|---|---|---|---|---|---|---|
|
|
||||||
| CSA (mm2) | ||||||
| RSPV | 270.2±70.5 | 308.0±65.7 | −36.4 | 44.6, −117.5 | <0.001 | 0.82 |
| RIPV | 233.3±98.6 | 262.1±84.6 | −28.5 | 42.6, −99.6 | <0.001 | 0.93 |
| LSPV | 185.2±35.4 | 180.5±45.5 | 2.0 | 53.2, −49.2 | 0.678 | 0.83 |
| LIPV | 175.7±40.0 | 190.2±42.7 | −14.3 | 54.6, −83.2 | 0.026 | 0.65 |
| Perimeter (mm) | ||||||
| RSPV | 68.9±9.0 | 73.3±7.6 | −4.1 | 8.3, −16.6 | 0.001 | 0.73 |
| RIPV | 62.1±11.6 | 66.5±10.3 | −4.4 | 3.9, −12.7 | <0.001 | 0.93 |
| LSPV | 59.4±7.3 | 58.4±7.5 | 0.4 | 10.3, −9.4 | 0.629 | 0.76 |
| LIPV | 56.8±6.4 | 59.1±5.9 | −2.2 | 9.6, −14.0 | 0.045 | 0.54 |
| Dmax (mm) | ||||||
| RSPV | 20.3±3.0 | 21.0±2.4 | −0.6 | 3.5, −4.7 | 0.122 | 0.72 |
| RIPV | 17.6±3.6 | 19.0±3.3 | −1.4 | 1.9, −4.8 | <0.001 | 0.88 |
| LSPV | 17.5±2.7 | 17.5±2.6 | −0.2 | 2.9, −3.3 | 0.489 | 0.81 |
| LIPV | 17.3±2.0 | 18.3±1.9 | −1.1 | 3.0, −5.2 | 0.004 | 0.46 |
| Dmin (mm) | ||||||
| RSPV | 14.9±2.4 | 16.6±2.4 | −1.8 | 2.2, −5.8 | <0.001 | 0.65 |
| RIPV | 14.5±3.5 | 15.3±3.1 | −0.7 | 2.6, −3.9 | <0.001 | 0.88 |
| LSPV | 11.5±2.0 | 11.1±2.3 | 0.4 | 3.8, −3.0 | 0.19 | 0.7 |
| LIPV | 11.3±2.2 | 11.4±2.3 | −0.1 | 3.6, −3.8 | 0.76 | 0.65 |
| Dmax/Dmin | ||||||
| RSPV | 1.38±0.18 | 1.27±0.14 | 0.1 | 0.47, −0.25 | <0.001 | 0.36 |
| RIPV | 1.24±0.21 | 1.26±0.19 | 0.0 | 0.27, −0.33 | 0.28 | 0.71 |
| LSPV | 1.57±0.36 | 1.63±0.36 | −0.1 | 0.42, −0.59 | 0.09 | 0.75 |
| LIPV | 1.58±0.34 | 1.67±0.38 | −0.1 | 0.58, −0.78 | 0.12 | 0.55 |
Mean difference and limits of agreement determined from Bland Altman plots;
Student t-test p values for differences between MDCT and MR angles;
correlation coefficient for MDCT and MR angles.
CSA, cross sectional area, D, diameter; LI, left inferior; LS, left superior; max. maximum; MDCT, multidetector computed tomography; min, minimum; mm, millimeter; MR, magnetic resonance imaging; PV, pulmonary vein; RI, right inferior; RS, right superior
Roundness of the PVs (Dmax/Dmin) was similar by MDCT and MR except for the RSPV in which the MR measure was significantly more round (Table 2). The remaining PVs demonstrated insignificant variability in roundness with mean difference ranging from a minimum of −2.6% (RIPV) to −5.7% (LIPV) and limits of agreement ranging from ±23.8% (1.96 SD, RIPV) to ±35.7% (LIPV).
There were significant correlations (p<0.01) between all of the PV ostial parameters (Table 2). Using analysis of variance (ANOVA), PV ostia measures were compared separately for MDCT and MR. CSA and P measures for the right sided veins were significantly larger than the left sided veins (p<0.001, ANOVA) and the RSPV was the largest of all (p<0.05, Student Newman Keul). Dmax and Dmin for right sided veins were significantly larger than those on the left with RSPV being the largest (p<0.05). When Dmax/Dmin ratio was compared, the right sided PVs were significantly more rounded than the left sided PVs (p<0.05). The RIPV was the most rounded and the LIPV the least rounded on both MR and MDCT images.
Distance to First Branch from Pulmonary Vein Ostia
There were no significant differences in distance from PV ostia to first branch comparing MDCT and MR respectively (LSPV, 21±7 mm vs. 21±8 mm; LIPV, 16±7 mm vs. 16±6 mm; RSPV, 12±6 mm vs. 11±6 mm; RIPV, 8±4 mm vs. 8±4 mm). There was insignificant bias in Bland Altman plots (not shown), and the limits of agreement for bias varied between ±1.8 mm (1.96 SD, RSPV) to ±4.5 mm (LIPV). The correlation between MDCT and MR values was ≥ 0.97 for each of the four veins.
There were significant differences in distance to first branch when the four veins were compared (p<0.0001, ANOVA, p<0.05 Student Newman Keul) with the distance to left sided branches being longer.
DISCUSSION
With the growing availability of 3T MR units in clinical practice, optimization of pulse sequences dedicated to higher field strengths has permitted faster speed, higher resolution, and improved image quality (23). Pulse sequences are adapted to 3T due to Specific Absorption Rate (SAR) limits, susceptibility and motion artifacts and relaxometries of tissue and thus contrast at 3T. Compared with 1.5T MR, the use of higher magnetic field strength with a lower T1 relaxation curve allows more accurate determination of inversion time and shortens the delay time from 20 minutes with 1.5T to 5 minutes before starting the IR prepared 3D whole heart scan (16,24). Moreover, the higher signal-to-noise ratio (SNR) inherent at 3T can be used to offset the relative SNR loss that results from reduction in voxel size and the use of parallel imaging to shorten scan times. This allows higher resolution scans with voxel size of 1×1×2mm3 at 3T, compared to voxel size of 1.5×1.5×5mm3 at 1.5T as reported previously (24). Use of parallel imaging facilitates scanning within a practical time of 10–12 minutes. By incorporating these advances in MR, the current study demonstrates the feasibility of performing free-breathing 3D whole-heart IR prepared technique at 3T MR for the assessment of LA and PV.
The findings in this study support the conclusion that detailed assessment of PV anatomy is possible using free-breathing 3T MR technique, and is comparable with inspiratory breath-hold MDCT. In our data, significant biases in PV angulation of about 10 degrees were present on the right side when MDCT and MR were compared. These observations might be explained by differences in respiratory patterns during image acquisition and differences in cardiac rotation during inspiration (Figure 1). It is also possible that there was greater variability in measurements on the left side because of oblique entry of left PVs into the LA, or that the difference in left and right sided results is the result of a statistical anomaly. This latter seems less likely because the same measurements were performed on each subject in both modalities (CT vs MR), so that these differences could be real. In an MR study, angulation of the PVs was more splayed during inspiratory breath-hold compared with expiratory breath-hold (3) but this is not really comparable with the current study that evaluates free-breathing MR with inspiratory breath-hold MDCT. The cu5rrent study focuses on differences between this new and potentially useful MR technique at 3T in comparison with MDCT as a reference rather than a study of PV anatomical variations with respiration.
The effect of breath-holding on PV parameters is not well understood. Previous studies have reported the effects of respiratory cycle on arterial and central venous pressures during different maneuvers, but not on PV hemodynamics (25). An inspiratory breath-hold may become a Valsalva maneuver with resultant increase in intrathoracic pressure, decrease in venous return and alteration in size and shape of the PVs (3,25,26). Smaller PV diameters have also been described during inspiration in an animal study (27). These results cannot be compared directly with our data because of differences in data acquisition during inspiration and expiration, not with free breathing. In our study, cross sectional area and perimeter of the right sided PVs and the LIPV were significantly larger by MR during free breathing. Differences in diameter measures between MR and MDCT were significant only for the RIPV (Dmax and Dmin) and for the RSPV (Dmin).
The magnitude of biases for PV angulation could lead to discrepancies when 3D reformatted images are integrated with electroanatomic mapping (3). During mapping, pulmonary parameters measured during free breathing were larger than those measured during expiratory breath-hold with either MR or MDCT (14). A 1–2 mm change in PV diameter, attributed to respiration, has been reported (3) and this small change could lead to navigational inaccuracy during intervention. Further evaluation could clarify the importance of the biases presented. Roundness is an important parameter in the choice of ablation catheter and also to monitor development of remodeling PV stenosis (7,9,28,29). The ratio Dmax/Dmin confirms previous reports that the PV ostia, especially on the left side, are not round (2,5,30). The LIPV was the least round PV and despite non-significant biases, it showed wide limits of agreement and a weak correlation between the two methods. This might be due to the difficulty of proper identification of the LIPV ostium because of its anatomic location (31). Differences in resolution between MDCT and 3T MR could also have affected PV measurements.
Our data also demonstrate that the distance to the first branch of the pulmonary veins is similar when measured by MDCT and MR. The relative distances to the first branch for the four PVs are very similar to those reported in subjects with atrial fibrillation (32).
The generalizability of the data is limited by the small number of subjects, none of whom had atrial fibrillation or was under consideration for ablation therapy. It is not possible to determine the effect of image resolution on the measured dimensions because there is no comparison of MR and MDCT to assess clinical outcome after therapy.
In conclusion, this preliminary comparison is the first technical study to analyze PV imaging during free breathing using a 3T MR platform as a potential alternative to MDCT with breath-hold. Comparing 3T MR and MDCT, the results demonstrate similar PV morphology and concordance of angulation on the left side, but not on the right side. Similarly, there was good concordance in measures of left-sided ostial parameters including cross-sectional area, perimeter, and maximum and minimum diameters. On the right side, the ostial measures by 3T MR were significantly larger when compared with MDCT. The techniques are equivalent for evaluation of the distance to the first bifurcation from the PV ostial plane. Images obtained during 3T MR with free breathing may better approximate conditions present during an ablation procedure. Use of free breathing 3T MR technique would avoid exposure to ionizing radiation and CT contrast that has a higher incidence of nephrotoxicity than gadolinium (33). Additionally, assessment of the angulation, size, and shape of PVs with 3T MR may improve integration with 3D electroanatomic maps, shorten procedure times, and improve procedural efficacy. Further studies evaluating these potential advantages are warranted.
Acknowledgments
Grant Support: This research was supported by the Intramural Research Program of the NIH, NIDDK, NIBIB, and CC.
References
- 1.Fuster V, Ryden LE, Cannom DS, et al. ACC/AHA/ESC 2006 Guidelines for the Management of Patients with Atrial Fibrillation: a report of the American College of Cardiology/American Heart Association Task Force on Practice Guidelines and the European Society of Cardiology Committee for Practice Guidelines (Writing Committee to Revise the 2001 Guidelines for the Management of Patients With Atrial Fibrillation): developed in collaboration with the European Heart Rhythm Association and the Heart Rhythm Society. Circulation. 2006;114(7):e257–354. doi: 10.1161/CIRCULATIONAHA.106.177292. [DOI] [PubMed] [Google Scholar]
- 2.Kim YH, Marom EM, Herndon JE, 2nd, McAdams HP. Pulmonary vein diameter, cross-sectional area, and shape: CT analysis. Radiology. 2005;235(1):43–49. doi: 10.1148/radiol.2351032106. discussion 49–50. [DOI] [PubMed] [Google Scholar]
- 3.Noseworthy PA, Malchano ZJ, Ahmed J, Holmvang G, Ruskin JN, Reddy VY. The impact of respiration on left atrial and pulmonary venous anatomy: implications for image-guided intervention. Heart Rhythm. 2005;2(11):1173–1178. doi: 10.1016/j.hrthm.2005.08.008. [DOI] [PubMed] [Google Scholar]
- 4.Kato R, Lickfett L, Meininger G, et al. Pulmonary vein anatomy in patients undergoing catheter ablation of atrial fibrillation: lessons learned by use of magnetic resonance imaging. Circulation. 2003;107(15):2004–2010. doi: 10.1161/01.CIR.0000061951.81767.4E. [DOI] [PubMed] [Google Scholar]
- 5.Wittkampf FH, Vonken EJ, Derksen R, et al. Pulmonary vein ostium geometry: analysis by magnetic resonance angiography. Circulation. 2003;107(1):21–23. doi: 10.1161/01.cir.0000047065.49852.8f. [DOI] [PubMed] [Google Scholar]
- 6.Mansour M, Holmvang G, Sosnovik D, et al. Assessment of pulmonary vein anatomic variability by magnetic resonance imaging: implications for catheter ablation techniques for atrial fibrillation. J Cardiovasc Electrophysiol. 2004;15(4):387–393. doi: 10.1046/j.1540-8167.2004.03515.x. [DOI] [PubMed] [Google Scholar]
- 7.Tintera J, Porod V, Cihak R, et al. Assessment of pulmonary venous stenosis after radiofrequency catheter ablation for atrial fibrillation by magnetic resonance angiography: A comparison of linear and cross-sectional area measurements. Eur Radiol. 2006;16(12):2757–2767. doi: 10.1007/s00330-006-0358-3. [DOI] [PubMed] [Google Scholar]
- 8.Anselme F, Gahide G, Savoure A, et al. MR evaluation of pulmonary vein diameter reduction after radiofrequency catheter ablation of atrial fibrillation. Eur Radiol. 2006;16(11):2505–2511. doi: 10.1007/s00330-006-0252-z. [DOI] [PubMed] [Google Scholar]
- 9.Tsao HM, Wu MH, Huang BH, et al. Morphologic remodeling of pulmonary veins and left atrium after catheter ablation of atrial fibrillation: insight from long-term follow-up of three-dimensional magnetic resonance imaging. J Cardiovasc Electrophysiol. 2005;16(1):7–12. doi: 10.1046/j.1540-8167.2005.04407.x. [DOI] [PubMed] [Google Scholar]
- 10.Martinek M, Nesser HJ, Aichinger J, Boehm G, Purerfellner H. Impact of integration of multislice computed tomography imaging into three-dimensional electroanatomic mapping on clinical outcomes, safety, and efficacy using radiofrequency ablation for atrial fibrillation. Pacing Clin Electrophysiol. 2007;30(10):1215–1223. doi: 10.1111/j.1540-8159.2007.00843.x. [DOI] [PubMed] [Google Scholar]
- 11.Mansour M, Refaat M, Heist EK, et al. Three-dimensional anatomy of the left atrium by magnetic resonance angiography: implications for catheter ablation for atrial fibrillation. J Cardiovasc Electrophysiol. 2006;17(7):719–723. doi: 10.1111/j.1540-8167.2006.00491.x. [DOI] [PubMed] [Google Scholar]
- 12.Sra J, Ratnakumar S. Cardiac image registration of the left atrium and pulmonary veins. Heart Rhythm. 2008;5(4):609–617. doi: 10.1016/j.hrthm.2007.11.020. [DOI] [PubMed] [Google Scholar]
- 13.Klemm HU, Steven D, Johnsen C, et al. Catheter motion during atrial ablation due to the beating heart and respiration: impact on accuracy and spatial referencing in three-dimensional mapping. Heart Rhythm. 2007;4(5):587–592. doi: 10.1016/j.hrthm.2007.01.016. [DOI] [PubMed] [Google Scholar]
- 14.Beinart R, Kabra R, Heist KE, et al. Respiratory compensation improves the accuracy of electroanatomic mapping of the left atrium and pulmonary veins during atrial fibrillation ablation. J Interv Card Electrophysiol. 2011;32(2):105–110. doi: 10.1007/s10840-011-9583-z. [DOI] [PubMed] [Google Scholar]
- 15.Gharib AM, Abd-Elmoniem KZ, Herzka DA, et al. Optimization of coronary whole-heart MRA free-breathing technique at 3 Tesla. Magn Reson Imaging. 2011;29(8):1125–1130. doi: 10.1016/j.mri.2011.07.008. [DOI] [PMC free article] [PubMed] [Google Scholar]
- 16.Gharib AM, Elagha A, Pettigrew RI. Cardiac magnetic resonance at high field: promises and problems. Curr Probl Diagn Radiol. 2008;37(2):49–56. doi: 10.1067/j.cpradiol.2007.11.003. [DOI] [PMC free article] [PubMed] [Google Scholar]
- 17.Garcia MJ, Lessick J, Hoffmann MH. Accuracy of 16-row multidetector computed tomography for the assessment of coronary artery stenosis. Jama. 2006;296(4):403–411. doi: 10.1001/jama.296.4.403. [DOI] [PubMed] [Google Scholar]
- 18.Yang Q, Li K, Liu X, et al. Contrast-enhanced whole-heart coronary magnetic resonance angiography at 3. 0-T: a comparative study with X-ray angiography in a single center. J Am Coll Cardiol. 2009;54(1):69–76. doi: 10.1016/j.jacc.2009.03.016. [DOI] [PMC free article] [PubMed] [Google Scholar]
- 19.Kotys MS, Herzka DA, Vonken EJ, et al. Profile order and time-dependent artifacts in contrast-enhanced coronary MR angiography at 3T: origin and prevention. Magn Reson Med. 2009;62(2):292–299. doi: 10.1002/mrm.21997. [DOI] [PubMed] [Google Scholar]
- 20.Yuan XP, Bach D, Skanes A, Drangova M. Assessment of intra- and interobserver variability of pulmonary vein measurements from CT angiography. Acad Radiol. 2004;11(11):1211–1218. doi: 10.1016/j.acra.2004.07.016. [DOI] [PubMed] [Google Scholar]
- 21.Bland JM, Altman DG. Statistical methods for assessing agreement between two methods of clinical measurement. Lancet. 1986;1(8476):307–310. [PubMed] [Google Scholar]
- 22.Linnet K. Limitations of the paired t-test for evaluation of method comparison data. Clin Chem. 1999;45(2):314–315. [PubMed] [Google Scholar]
- 23.Gharib AM, Ho VB, Rosing DR, et al. Coronary artery anomalies and variants: technical feasibility of assessment with coronary MR angiography at 3 T. Radiology. 2008;247(1):220–227. doi: 10.1148/radiol.2471070274. [DOI] [PMC free article] [PubMed] [Google Scholar]
- 24.Peters DC, Wylie JV, Hauser TH, et al. Detection of pulmonary vein and left atrial scar after catheter ablation with three-dimensional navigator-gated delayed enhancement MR imaging: initial experience. Radiology. 2007;243(3):690–695. doi: 10.1148/radiol.2433060417. [DOI] [PubMed] [Google Scholar]
- 25.Kuzo RS, Pooley RA, Crook JE, Heckman MG, Gerber TC. Measurement of caval blood flow with MRI during respiratory maneuvers: implications for vascular contrast opacification on pulmonary CT angiographic studies. AJR Am J Roentgenol. 2007;188(3):839–842. doi: 10.2214/AJR.06.5035. [DOI] [PubMed] [Google Scholar]
- 26.Hainsworth R. Applied cardiovascular physiology. Anaesthesia & intensive care medicine. 2004;5(6):184–186. [Google Scholar]
- 27.Morgan BC, Dillard DH, Guntheroth WG. Effect of cardiac and respiratory cycle on pulmonary vein flow, pressure, and diameter. J Appl Physiol. 1966;21(4):1276–1280. doi: 10.1152/jappl.1966.21.4.1276. [DOI] [PubMed] [Google Scholar]
- 28.Tse HF, Reek S, Timmermans C, et al. Pulmonary vein isolation using transvenous catheter cryoablation for treatment of atrial fibrillation without risk of pulmonary vein stenosis. J Am Coll Cardiol. 2003;42(4):752–758. doi: 10.1016/s0735-1097(03)00788-5. [DOI] [PubMed] [Google Scholar]
- 29.van der Voort PH, van den Bosch H, Post JC, Meijer A. Determination of the spatial orientation and shape of pulmonary vein ostia by contrast-enhanced magnetic resonance angiography. Europace. 2006;8(1):1–6. doi: 10.1093/europace/euj006. [DOI] [PubMed] [Google Scholar]
- 30.Jongbloed MR, Bax JJ, Lamb HJ, et al. Multislice computed tomography versus intracardiac echocardiography to evaluate the pulmonary veins before radiofrequency catheter ablation of atrial fibrillation: a head-to-head comparison. J Am Coll Cardiol. 2005;45(3):343–350. doi: 10.1016/j.jacc.2004.10.040. [DOI] [PubMed] [Google Scholar]
- 31.Hauser TH, Yeon SB, McClennen S, et al. A method for the determination of proximal pulmonary vein size using contrast-enhanced magnetic resonance angiography. J Cardiovasc Magn Reson. 2004;6(4):927–936. doi: 10.1081/jcmr-200037474. [DOI] [PubMed] [Google Scholar]
- 32.Perez-Lugones A, Schvartzman PR, Schweikert R, et al. Three-dimensional reconstruction of pulmonary veins in patients with atrial fibrillation and controls: morphological characteristics of different veins. Pacing Clin Electrophysiol. 2003;26(1 Pt 1):8–15. doi: 10.1046/j.1460-9592.2003.00144.x. [DOI] [PubMed] [Google Scholar]
- 33.Kane GC, Stanson AW, Kalnicka D, et al. Comparison between gadolinium and iodine contrast for percutaneous intervention in atherosclerotic renal artery stenosis: clinical outcomes. Nephrol Dial Transplant. 2008;23(4):1233–1240. doi: 10.1093/ndt/gfm725. [DOI] [PubMed] [Google Scholar]