

Abstract
Post-swallow residue is considered a sign of swallowing impairment. Existing methods for capturing post-swallow residue (perceptual and quantitative) have inherent limitations. We employed several different perceptual and quantitative (ratio) methods for measuring post-swallow residue on the same 40 swallows and addressed the following questions: (1) Do perceptual and quantitative methods demonstrate good agreement? (2) What differences in precision are apparent by measurement method (one-dimensional, two-dimensional, and circumscribed area ratios)? (3) Do residue ratios agree strongly with residue area measures that are anatomically normalized? Based on the findings of this series of questions, a new method for capturing residue is proposed: the Normalized Residue Ratio Scale (NRRS). The NRRS is a continuous measurement that incorporates both the ratio of residue relative to the available pharyngeal space and the residue proportionate to the size of the individual. A demonstration of this method is presented to illustrate the added precision of the NRRS measurement in comparison to other approaches for measuring residue severity.
Keywords: Deglutition, Dysphagia, Swallowing, Videofluoroscopy, Residue, Deglutition disorders
Videofluoroscopy is considered the gold standard tool for the assessment of dysphagia [1]. It allows for direct and dynamic visualization of deglutition by swallowing radiopaque substances under fluoroscopy. Pharyngeal residue is the term used to describe material that remains in the pharynx post swallow (also called retention or stasis) and is considered a sign of swallowing impairment [2]. Pharyngeal residue collects most commonly in two locations: (1) the valleculae, bilateral spaces between the base of the tongue and the epiglottis, and (2) the piriform sinuses, spaces formed on either side of the pharynx between the fibers of the inferior pharyngeal constrictor muscle and the sides of the thyroid cartilage and lined by orthogonally directed fibers of the palatopharyngeus muscle and pharyngobasilar fascia [2]. Material retained in these spaces in the pharynx constitutes a risk for post-swallow aspiration. The general consensus is that aspiration risk increases with the volume of residue, due to the risk that large volumes will overflow the boundaries of the available space.
A number of different approaches can be used for rating the severity of pharyngeal residue. These range from clinical perceptual ratings to quantified methods in which image analysis techniques are used to measure the number of pixels representing residue on selected digital radiographic images from videofluoroscopic swallowing studies. Such quantification methods estimate the severity of residue in two-dimensional space, usually in the lateral view.
Perceptual Methods for Describing Residue
Historically, the presence (or absence) of residue was scored as a binary feature [3–7]. Dejaeger et al. [8] introduced a variation of this approach using four categories of pharyngeal residue, capturing its location: no residue, residue present in the valleculae, residue present in the piriform sinuses, and diffuse residue (present in both locations). Omari et al. [9] describe a variant of this approach. In their method, a score of “1” represents no residue and the presence of residue leads to higher scores, weighted by location (valleculae residue is scored as +1, and pyriform sinus residue and/or posterior pharyngeal wall residue are each scored as +2). However, all variants of the binary approach share the limitation that they do not provide detail regarding the amount of the residual material observed. Furthermore, in most cases, an operational definition of what constitutes clinically relevant residue has not been described. For example, a small “trace” amount of material may or may not be considered clinically relevant by different clinicians due to such considerations as whether or not coating is expected based on density of the contrast medium. The threshold for defining residue as a finding of clinical relevance is important because it implies some sort of swallowing impairment as an underlying cause. Binary approaches to residue rating lack the detail required to clearly indicate when an underlying swallowing impairment is felt to exist.
A second perceptual rating approach is to score the amount of observed residue as an estimate of the percentage of the original bolus that was not swallowed [10, 11]. This method, which forms the numerator of the Oropharyngeal Swallow Efficiency ratio (OPSE) requires the rater to assign a percentage-of-bolus estimate to the material that remains as residue, but does not require specification of the pharyngeal location(s) in which the residue is found. The OPSE has been compared to scintigraphy, a nuclear medicine test in which radioactive isotopes are swallowed and measured in the pharynx post swallow [12]. Correlations between the two techniques were modest (r = 0.61 and 0.60) for 5- and 10-ml boluses, respectively, in a sample of 16 adults who underwent videofluoroscopy to evaluate dysphagia. However, the comparison was restricted by the fact that the two procedures were performed 24 h apart. These two tools cannot be performed concurrently due to the need for differing stimuli, which are either radiopaque (videofluoroscopy) or isotopes (scintigraphy). Furthermore, the authors acknowledged that the observed concordance with scintigraphy was achieved for percent-of-bolus measures made by experienced raters; more research is required to understand how much training is required to perform such estimates reliably [12].
An alternative to estimation or binary classification is the use of ordinal scales for capturing progressively increasing amounts of pharyngeal residue. A three-point ordinal scale has been described by Robbins and colleagues [13–15] for measuring residue, with separate ratings made for different residue locations (oral cavity, valleculae, posterior pharyngeal wall, piriform sinuses, and the upper esophageal sphincter). In this approach, a “0” corresponds to no residue, “1” corresponds to a coating of residue, and “2” corresponds to pooling of residue. Rosenbek et al. [1] describe a similar scale where “0” is assigned to no residue, “1” is assigned to minimal residue, and “2” is assigned to moderate-to-substantial residue. Unfortunately, these scales lack clear guidelines for consistent scoring (i.e., what is minimal? pooling? moderate-to-substantial?). In addition, these ordinal scaling methods fail to capture gradations of residue once the threshold of pooling or moderate-to-substantial has been crossed. Nonetheless, the amount of residue, once present, is clearly a factor of clinical relevance. Given these limitations, these ordinal scales have limited additional value compared to binary ratings.
In an attempt to improve on such shortcomings, some studies have pursued semiquantification of the amount of observed residue by parsing the previously described ordinal scale scores into bins of “percent-filled” space. Han et al. [16] report a method for scoring the severity of vallecular residue using four “grades.” This is done by referencing a perceptual judgment of the amount of observed residue material to a perceptual judgment of the width of the valleculae. “Grade zero” is assigned to no residue, “grade one” to residue occupying <10 % of the width of the valleculae, “grade two” to residue occupying between 10 and 50 % of the width of the valleculae, and “grade three” to residue occupying >50 % of the width of the valleculae. Alternatively, Eisenhuber et al. [17] describe three grades of residue severity based on the perceived height of the residual material referenced against the perceived available space in either the valleculae or piriform sinuses. In this scale, “1” is considered “mild,” where the level of contrast material constitutes less than 25 % of the height of the structure; “2” is considered “moderate,” where the level of contrast material is between 25 and 50 % of the height of the structure; and “3” is considered “severe,” where the level of barium is greater than 50 % of the height of the structure. Presumably, a score of “0” represents “no residue.” Ryu et al. [18] also describe subdividing the amount of observed post-swallow pharyngeal residue into three categories: none (<10 %), small (>10 to<50 %), and large (>50 %), measured at the valleculae and piriform sinuses, but they do not specify whether this percentage refers to the height or the width of the available space or some other construct. While these scales make an important step toward capturing the risk associated with residue by describing the extent to which each pharyngeal space is filled, several limitations still exist.
Limitations of Perceptual Methods of Measuring Residues
Perceptual methods for measuring pharyngeal residue lack detailed instructions on how to make the judgments. For example, with few exceptions, studies in the literature fail to report exactly when to measure post-swallow residue in the swallow sequence. If a patient employs multiple swallows per bolus, should one measure residue after the initial swallow [17] or the final swallow, or perhaps after each subswallow? Further, how is the end of the swallow defined? The termination of hyoid motion post swallow has been suggested as a marker of the end of a swallow [13, 15], but even this definition may prove problematic given known issues with post-swallow hyoid movement variability [19, 20]. Also, challenges in achieving adequate interrater and intrarater reliabilities have been reported for pharyngeal residue ordinal scales [21, 22]. Some research shows good agreement (both inter- and intrarater) on binary ratings of pharyngeal residue [1], while others have demonstrated good intrarater but unacceptable interrater reliability [23].
Finally, from a research perspective, binary measures and ordinal scales have limited use in parametric statistical analyses due to their categorical/ordinal nature. These scales lack the resolution to capture subtle changes in the amount of residue present, which may reflect real underlying physiological change in swallowing. Although the field lacks normative data regarding typical residue severity and variability in dysphagia, it seems probable that very large sample sizes would be needed to adequately power a study seeking to show improvement in measures of central tendency using these binary and ordinal scales.
Quantitative Measures of Pharyngeal Residue
Recently, Dyer et al. [24] explored the utility of computer-based quantitative assessment of residue in the valleculae. They argued that while residue has been described based on perceptual measures of its height [17] or width [16], it had yet to be described using an area function (height by width). They devised the Vallecular Residue Ratio (VRR) by expressing the area of the residue in the valleculae relative to the area of the available space in the valleculae. This was accomplished using digital image measurement tools on a Picture Archiving Computer System, with 80 still images of the valleculae extracted from swallowing sequences at the point where the hyoid bone returned to rest. Five raters used line-based image analysis tools to measure the width and height of the observed residue and the width and height of the valleculae. The areas for residue and valleculae were then calculated (width × height) and expressed as a ratio (VRR = residue area/vallecular area). The same still images were rated perceptually using a grade ranging from “no residue” to “mild,” “moderate,” and “severe” residue. Next, they converted the VRR into four categories based on these perceptual ratings using linear discriminant analysis. The result was the Vallecular Residue Ratio Scale (VRRS), which specifies cut points for different severities of residue as follows: no residue at <3 % of the vallecular space, mild residue from 3 to 25 %, moderate residue from 25 to 55 %, and severe residue over 55 % [24].
Limitations with Existing Quantitative Measures of Pharyngeal Residue
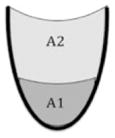
The Dyer et al. study [24] is an important first step toward the quantification of pharyngeal residue. Unfortunately, their scale was applied only to the valleculae, with no corresponding measurement described for the piriform sinuses. Another limitation of the VRRS is related to the method used for calculating area, by multiplying the linear width of a given feature (residue or space) by the linear height of the same feature. In fact, as described, this approach calculates the area of a rectangle not the circumscribed area of the actual residue or space, which may be elliptical, oval, or even triangular in shape. This limitation means that it is possible for two quite different volumes of residue to generate identical VRR values based on the linear height and width measures of their two-dimensional representation on a lateral view videofluoroscopic image. To illustrate this concern, Fig. 1 shows two hypothetical lateral views of the valleculae with identical linear height and width dimensions but differing circumscribed areas (A vs. B). A solution to this concern, which is discussed further below, is to use image analysis tools to outline and calculate the circumscribed area of the actual shape of the residue or its corresponding spatial housing from a videofluoroscopy image.
Fig. 1.
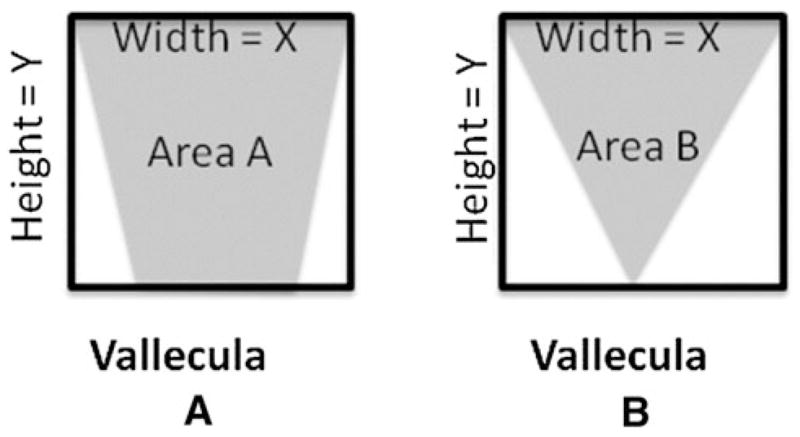
Example demonstrating that multiplying the same width (X) by height (Y) may not capture individual differences in vallecular area (a vs. b)
A final limitation of the VRRS is that it does not account for differences in the size of the valleculae across participants and from frame-to-frame within subjects. The available space of the valleculae determines the amount of residue it can contain; this capacity, in turn, determines the volume threshold at which residue will overflow the valleculae, thereby creating a risk for aspiration. It is hypothetically possible for two people of equivalent height to have valleculae that differ in size, or, conversely, for two people of quite different height to have valleculae of identical size and capacity. In order to properly capture the risk associated with residue in these two people, it may be of additional value to understand the relationship between residue volume and overall body size. In fact, given that the appearance of both the valleculae and piriform sinuses may vary across frames within a swallowing sequence, measurements of their area may not be stable and valid for estimating capacity; some might argue that this consideration argues for scaling residue ratios to the size of the person rather than as a ratio of available space. It is possible to convert pixel-based measures of residue area into real measures of area, in standard units such as mm2, by placing external scalars (such as a coin over the temporomandibular joint) on the person within the field of view. Area measures of residue (in pixels2) can then be divided by area measures of the scalar (in pixels2) and multiplied by the known dimensions of the scalar, yielding residue area estimates in standard units. Alternatively, a second approach does not require the estimation of residue in standard units but instead expresses the area of residue relative to the size of the person using an area measurement of an internal anatomical scalar.
In this article we explore differences in residue measures taken from the same images using these previously described approaches. With respect to capturing the clinical relevance of residue, we will demonstrate that the choice of reference, whether the available space of the valleculae and piriform sinuses or an internal anatomical scalar capturing body size, leads to different results in scaling residue. Therefore, we propose a new method for measuring pharyngeal residue, the Normalized Residue Ratio Scale, or the NRRS, applied to the calculation of residue in the valleculae (NRRSv) and piriform sinus (NRRSp). It should be noted that the NRRS is not intended for quantifying lines of residue along mucosal surfaces such as the posterior pharyngeal wall; such coatings of residue are probably best handled using binary present/absent rating scales. The NRRS is a continuous measurement that incorporates both the ratio of residue occupying a pharyngeal space and a proportion expressing the area of observed residue normalized against the size of the person. Here we use proportion to characterize a normalized amount of bolus retained in the pharynx, whereas ratio is used to characterize the amount of bolus retained in a given pharyngeal space. The measurements required to calculate the NRRS can be made using open-source image analysis software and imported into a spreadsheet with embedded macros that compute the formulae for generating NRRS values.
The comparisons of residue measurement methods that are explored in this article are formulated as a series of research questions, illustrated in Fig. 2. Question 1 begins with measures of agreement between perceptually derived and pixel-derived ordinal measures of residue severity. Our hypothesis was that we would not necessarily see good agreement between these two measures given the inherently subjective nature of perceptually judging the amount of residue occupying an anatomical space. Question 2 explores differences in precision between one-dimensional and two-dimensional pixel-derived residue/space ratios and circumscribed pixel-derived area ratios. Here we take the position that circumscribed area ratios are, by definition, likely to be more precise than linearly derived area estimates. We calculated the difference between the circumscribed area ratios and three linear ratios and used the comparison of standard deviations and Cohen’s d to illustrate the magnitude of area inflation seen across these linear approaches. Question 3 investigates agreement between circumscribed area ratios in which the denominator of the ratio is either an area function of the spatial housing (valleculae or piriform sinuses) or a cervical spine-length scalar, thereby normalizing the quantification of residue volume to the size of the system. Our hypothesis was that we would not necessarily see good agreement between these two ratios given the possibility that pharyngeal spaces may vary in size across people of different body sizes. Finally, we show comparative residue measures achieved using the NRRSv (for the valleculae) and the NRRSp (for the piriform sinuses).
Fig. 2.

Summary of research questions for development of the NRRS
Methods
To compare different methods of rating residue, two independent investigators from different sites (Author 1 and Author 2) each randomly selected 20 videofluoroscopy files from a pool of swallowing studies obtained for research under separate protocols approved by their respective Institutional Review Boards. Video clips of single-bolus thin-liquid swallowing sequences were spliced from the original recordings and assigned new file numbers for this study. Swallowing stimuli were either thin-liquid Varibar at 40 % w/v (Author 1) or a 40 % w/v solution of Liquid Polibar barium suspension and water (Author 2). The swallowing ability and etiology of participants was unspecified, and the volume of boluses analyzed was not controlled. The swallowing clips were placed in random order and uploaded into ImageJ digital analysis software (ImageJ, National Institutes of Health, Bethesda, MD), which contained appropriate plug-ins for uploading and reading different formats of video files (e.g., Quicktime™ or .avi). Swallowing clips were advanced frame-by-frame to visually choose the frame depicting the hyoid at its lowest (most inferior) position post swallow with concurrent epiglottic return to the vertical position and pharyngeal relaxation. This frame was designated for residue ratings and measurement, and the identity of this frame was recorded in the measurement output, ensuring ease of future access to the same frames for reliability measures. In the event that a participant employed multiple swallows per bolus, residue was to be rated using the frame of lowest hyoid position following the initial swallow in the series. This specification is consistent with the instructions used in the MBSImp [25].
To obtain data for question 1, the primary raters at both institutions (Author 1 and Author 2) first assigned perceptual residue scores for the valleculae and piriform sinuses for each swallow. These ratings were made using the scale proposed by Eisenhuber et al. [17], in which “0” represents no residue, “1” represents residue occupying <25 % of the height of the space (valleculae or piriform sinuses), “2” represents residue occupying 25–50 % of the height of the space, and “3” represents residue filling >50 % of the height of the space. Perceptual ratings were completed prior to quantitative measurements to avoid experimental bias in scores.
To acquire pixel-based measures of residue for all of our research questions, ImageJ was configured to permit relevant quantitative measurements to be taken by selecting both the “area” and “bounding rectangle” options under the “set measurements” options in the “Analyze” pull-down menu. The “area” setting reports the number of pixels captured by the “freehand” tool. By simultaneously selecting the “bounding rectangle” option, ImageJ also outputs linear height and width measurements for the same space traced with the “freehand” tool, by superimposing a rectangle around that space and measuring the dimensions at its widest and tallest boundaries. In this manner, we were able to extract comparable linear and area measures using a single tracing step without needing to control for human error in the repeated tracing of the same space using different tools.
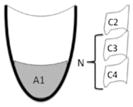
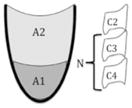
Quantitative (pixel-based) measures of residue, spatial housing, and internal anatomical reference scalars were derived in the following way and are illustrated in Fig. 3a –c for the valleculae:
Fig. 3.

a The “freehand” tool is used to outline the residue in the valleculae. b The “freehand” tool or “selection brush” tool (shown here) is used to outline the vallecular space. c The “line” tool is used to measure the length of the anterior inferior corner of C2 to the anterior inferior corner of C4
The “freehand” tool was selected from the toolbar and residue, if any, was outlined and measured in the valleculae and/or piriform sinuses.
The areas of the spatial housing of the valleculae and piriform sinuses were measured either by outlining these spaces with the “freehand” tool or by expanding the original residue selection to the size of its spatial housing using the “brush selection” tool (which can be selected by right-clicking the “oval” tool). The top of the piriform sinuses was operationally defined using a line extending from the tip of the arytenoid shadow to the posterior pharyngeal wall, perpendicular to the vertebral axis.
The “line” tool was used to measure the distance between the anterior inferior edge of the C2 and C4 vertebrae in order to generate an internal anatomical scalar reference.
For each measurement of residue and space, ImageJ output height, width, and area results. All results were copied and pasted into a secure online spreadsheet. The spreadsheet contained embedded macro formulae that used the ImageJ results to compute the different residue ratio measures of interest. For a description and schematic of each calculation method, see Table 1.
The final calculation in the spreadsheet was of the NRRS, for which the outlined area ratio for a given space (valleculae/piriform sinuses) was multiplied by a “normalized residue proportion” of the same residue area (see Table 1).
Table 1.
Descriptions and schematics of various one- and two-dimensional ratios for measuring residue, as well as the NRRS for measuring residue
| Residue ratio | Description | Schematic | Modeled after | |
|---|---|---|---|---|
| One-dimensional ratios | H ratio val = H1/H2 | The height of the valleculae residue expressed relative to the height of the valleculae |
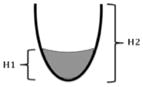
|
Quantitative version of Eisenhuber et al. [17] |
| H ratio PS = H1/H2 | The height of the piriform sinuses residue expressed relative to the height of the piriform sinuses | |||
| W ratio val = W1/W2 | The width of the valleculae residue expressed relative to the width of the valleculae |
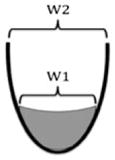
|
Quantitative version of Han et al. [16] | |
| W ratio PS = W1/W2 | The width of the piriform sinuses residue expressed relative to the width of the piriform sinuses | |||
| Two-dimensional ratios | H × W ratio val = (H1 × W1)/(H2 × W2) | The height by width of the valleculae residue expressed relative to the height by width of the valleculae |
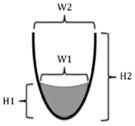
|
Dyer et al. [24] expanded to include PS |
| H × W ratio PS = (H1 × W1)/(H2 × W2) | The height by width of the piriform sinuses residue expressed relative to the height by width of the piriform sinuses | |||
| Area ratio val = A1/(A1 + A2) | The outlined area of valleculae residue expressed relative to the outlined area of the valleculae |
|
n/a | |
| Area ratio PS = A1/(A1 + A2) | The outlined area of piriform sinuses residue expressed relative to the outlined area of the piriform sinuses | |||
| Normalized residue proportion | Normalized val residue = A1/N | The outlined area of valleculae residue expressed relative to an internal scalar |
|
n/a |
| Normalized PS residue = (A1/N2) × 10 | The outlined area of piriform sinuses residue expressed relative to an internal scalar | |||
| NRRS scale | NRRS val = (A1/A1 + A2) × [(A1/N2) × 10] | The area ratio for the valleculae multiplied by the area of the valleculae residue divided by an internal scalar (N) |
|
n/a |
| NRRS PS = (A1/A1 + A2) × [(A1/N2) × 10] | The area ratio for the piriform sinuses multiplied by the area of the piriform sinuses residue divided by an internal scalar (N) |
Val valleculae, PS piriform sinus, H height, W width, A area, N internal scalar, NRRS normalized residue ratio scale
Twenty percent of the swallowing clips were randomly selected for intrarater and interrater reliability measures at each institution. Due to file-sharing limitations associated with the research ethics approvals for the studies from which the clips were drawn, files could not be shared across institutions. Thus, interrater agreement was explored using a second rater at each institution. Both raters received identical training via a slideshow presentation designed to clarify how measurements were to be taken. It has been demonstrated that improved interrater reliability can be achieved across labs after training on operational definitions [26]. Intrarater and interrater reliability were calculated using interclass correlation coefficients (ICCs). All values were in the excellent range and can be found in Table 2. Note that our primary goal was to demonstrate reliability for measuring the residue and the spatial housing. Thus, the specific frame for reliability measurements was provided to the rater (i.e., reliability ratings do not test selection of the hyoid rest frame for measurement).
Table 2.
Interclass correlation coefficients (ICCs) and 95 % confidence intervals for intrarater and interrater reliabilities for measurement of residue and spatial housing of residue
| Intrarater reliability ICC (95 % CI) | Interrater reliability ICC (95 % CI) | |
|---|---|---|
| Valleculae residue | 0.99 (0.94–1.00) | 0.98 (0.88–1.00) |
| Valleculae | 0.98 (0.90–1.00) | 0.97 (0.85–0.99) |
| Piriform sinuses residue | 0.98 (0.92–1.00) | 0.97 (0.85–0.99) |
| Piriform sinuses | 1.00 (0.99–1.00) | 0.99 (0.96–1.00) |
Analysis
To test question 1 (i.e., the comparison between a commonly used perceptual ordinal scaling method and a quantitative, pixel-based version of the same scale), Eisenhuber scale scores were reverse-modeled from ImageJ linear height ratios of residue/space. All ratios >0 and <0.25 were assigned a score of “1,” ratios from 0.25 to 0.50 were assigned “2,” and ratios >0.50 were assigned “3.” Linearly weighted kappa, a measure of concordance, was used to test agreement between these two methods of measurement, with κ = 0.61–0.80 set as the threshold for substantial agreement [27, 28].
In question 2, the purpose was to illustrate the degree to which different linear methods of residue ratio calculation caused inflation of ratio results compared to a circumscribed area function. This is shown using descriptive statistics (mean and standard deviation for change in ratio score) and Cohen’s d as a measure of effect size differences that occur using different parameters. Effect sizes of d < 0.49 will be interpreted as weak, d = 0.5–0.79 will be interpreted as moderate, and d > 0.8 will be considered strong [29]. In order to avoid skewed data attributable to true zero scores (no residue observed), these zero values were removed from the data prior to the calculation of descriptive statistics for this question.
In question 3, we explored the agreement between the circumscribed area ratio and the normalized residue proportion, in which residue area is normalized to the size of the system. We used a linear regression model to evaluate the goodness of fit between these measures, with an a priori criterion for “good” fit set at coefficients of determination (r2) greater than 0.80. As with question 2, we removed all residue ratios equal to zero from the analysis in order to better capture the relationship between these measures in the circumstance where residue is present.
Finally, descriptive statistics for the NRRS measures are provided to allow comparison with the other measures.
Results
Question 1
The frequency distribution of perceptual ordinal ratings of residue severity [17] is given in Table 3. When perceptual ratings were compared with pixel-derived ordinal measures, using the same definitions for residue severity based on a height measure of percent space filled, kappa scores showed that residue scores did not achieve substantial agreement for the valleculae (κ = 0.33, 95 % CI = 0.14–0.51), while scores for piriform sinuses met our a priori criterion for agreement (κ = 0.66, 95 % CI = 0.52–0.79). A post hoc two-tailed Mann–Whitney U test comparing these piriform residue scores across methods approached statistical significance, albeit with a small effect size (U = 982, z = −1.75, p = 0.08, q = −0.28). This indicates that while perceptual versus quantitative measurement methods for the piriform sinuses may be similar, they may differ with respect to central tendency, and data spread to an extent that could alter research findings.
Table 3.
The distribution of the residue ratings (valleculae and piriform sinuses) based on perceptual ratings and quantitative (reverse-modeled) scores
| 0 | 1 | 2 | 3 | |
|---|---|---|---|---|
| No residue to trace amount | < 25 % height ratio | 25–50 % height ratio | > 50 % height ratio | |
| Valleculae (perceptual) | 7 | 17 | 7 | 9 |
| Valleculae (quantitative) | 5 | 1 | 13 | 21 |
| Piriform sinuses (perceptual) | 15 | 7 | 11 | 7 |
| Piriform sinuses (quantitative) | 14 | 1 | 6 | 19 |
Question 2
Descriptive statistics and Cohen’s d for the difference in measures of residue area between the circumscribed area ratio and linearly derived (one-dimensional and two-dimensional) ratios are given in Table 4. In all cases, the linearly derived area measures yielded larger area ratios than the circumscribed method. Effect sizes for the difference between one-dimensional linearly derived ratios were moderate to strong. Even the two-dimensional linearly derived method (height × width) demonstrated differences with a weak effect size compared with the circumscribed area ratios. These results support our hypothesis that linearly derived ratios lack precision in comparison to circumscribed ratio measures. Interestingly, inspection of individual data points revealed that circumscribed area ratio scores were not unanimously smaller in value than the one-dimensional and two-dimensional linearly derived ratios. This was an unexpected finding and contrary to our expectations. Upon closer inspection of the data, we determined that the linear measurements extracted using ImageJ’s “bounded rectangle” tool are calculated in an image-defined two-dimensional coordinate space. This means that these bounded rectangle measurements are susceptible to variation with rotation of the region of interest (the residue or its spatial housing). A post hoc simulation in which an identical area of residue was rotated into different positions relative to the vertical axes of the image confirmed this explanation. Importantly, circumscribed area ratios are immune to this challenge.
Table 4.
Mean, standard deviation, and effect size (Cohen’s d) differences in ratio score when circumscribed area ratios are compared with linearly derived ratios (height, width, and height × width)
| Area vs. height ratio
|
Area vs. width ratio
|
Area vs. H × W ratio
|
|||||||
|---|---|---|---|---|---|---|---|---|---|
| Mean | SD | Cohen’s d | Mean | SD | Cohen’s d | Mean | SD | Cohen’s d | |
| Valleculae (n = 35) | 0.16 | 0.18 | 0.62 | 0.34 | 0.16 | 1.56 | 0.07 | 0.15 | 0.26 |
| Piriform sinuses (n = 26) | 0.17 | 0.17 | 0.73 | 0.35 | 0.22 | 1.45 | 0.08 | 0.12 | 0.32 |
In all cases, the linearly derived ratios yielded larger areas than the circumscribed area method
Question 3
Table 5 contains descriptive statistics for the circumscribed area ratio measures and the corresponding normalized residue proportions. Regression analysis did not show a strong goodness of fit (r2 > 0.80) between these measures for the valleculae (n = 35, r2 = 0.51) or the piriform sinuses (n = 26, r2 = 0.64) (Fig. 4a, b). A post hoc removal of an outlier from the valleculae shows that the goodness of fit improves, but the relationship is still not strongly predictive (n = 34, r2 = 0.61). These relationships confirm that the impression of residue severity differs depending on whether the reference is the spatial housing or an internal anatomical scalar for body size. This demonstration supports the need for a new measure that captures both of these reference perspectives in a single measure (as does the NRRS). The descriptive statistics for the NRRS are given in Table 5.
Table 5.
NRRS and its components for both the valleculae and the piriform sinus
| Circumscribed area ratio | Normalized residue proportion | Normalized Residue Ratio Scale (NRRS) | |
|---|---|---|---|
| NRRSV | 0.406 (0.265) | 0.293 (0.273) | 0.173 (0.237) |
| NRRSP | 0.314 (0.309) | 0.399 (0.467) | 0.275 (0.408) |
Values are mean (SD)
Fig. 4.

a Scatter plot shows that the most precise measurement of residue-to-pharyngeal space ratio is not predictive of the amount of residue in the valleculae sinuses as characterized by the normalized residue proportion (r2 < 0.80). b Scatter plot shows that the most precise measurement of residue-to-pharyngeal space ratio is not predictive of the amount of residue in the piriform sinuses as characterized by the normalized residue proportion (r2 < 0.80)
Discussion
Accurate quantification of post-swallow pharyngeal residue is an important clinical challenge, limited by current methods and tools. This study has demonstrated that (1) perceptual and qualitative measurements differ; (2) when circumscribed area ratios were compared with linearly derived residue ratios, differences were found with moderate to strong effect sizes (for one-dimensional ratios) and weak effect sizes (for the two-dimensional height-by-width ratio), demonstrating a lack of precision in the linearly derived measurement methods; and (3) circumscribed area ratios do not show strong agreement with area measures that are normalized to the size of the person (normalized residue proportions). We interpret this latter finding as support for the need to develop a new scale that incorporates both the size of the residue relative to its spatial housing and the size of the residue relative to the size of the system (the person). The NRRS was developed in an attempt to improve upon the limitations of these residue rating methods. It is a continuous variable that incorporates both the circumscribed area ratio and a normalized residue proportion. The demonstrated precision of the NRRS in this study will allow us to move forward to confidently explore the association between residue severity (using a continuous scale) and aspiration risk.
We have demonstrated that perceptually derived and pixel-derived ordinal measurements using the same operational definitions do not substantially agree for residue in the valleculae (κ = 0.33). For piriform residue scores these two methods of rating were in the range of substantial agreement (κ = 0.66), but differences in measures of central tendency were found, which approached statistical significance. This confirms our hypothesis and suggests that the subjectivity of perceptual ratings of the percent of available space occupied by residue renders them imprecise and unreliable in comparison to more quantitative approaches.
We recognize, of course, that an outlined area measured from a lateral view videofluoroscopic image is only a two-dimensional measure of a three-dimensional reality. It was interesting for us to confirm that linearly derived area ratios are susceptible to vary with image rotation in ImageJ. Thus, within the limitations of the gold standard imaging modality, circumscribed area ratios produce the most precise measurements. It is a distinct advantage that they are immune to rotation artifact. Using the “freehand” tool in ImageJ is a simple way to outline residue and the pharyngeal spaces of interest.
Pharyngeal spaces can vary between participants, and even within participants (across frames of reference). This highlights the importance of careful operational definitions for selection of frames for measurement and emphasizes the value of capturing residue in proportion to its spatial housing (which may not provide a stable denominator reference value) and to the size of the person. In our opinion, residue ratios fail to adequately characterize the clinical implications and potential severity of residue. Our linear regression data confirmed that circumscribed area residue ratios do not show strong agreement with estimates of the amount of residue as represented by normalized residue proportions. By incorporating both the normalized residue proportion and the circumscribed area residue ratio, the NRRS allows for the appreciation of the percent of space that is filled with residue and the relative size of that space for the individual, thereby capturing the associated clinical risk. This controls for variations across body sizes, such as in the example of a person who retains only a small amount of residue, but one which is substantial enough to occupy most of the available space in the valleculae or piriform sinuses, with these being relatively small in capacity relative to the size of the individual. The degree to which the appreciation of both of these ratios is necessary to capture the clinical risk of subsequent aspiration is a question that will need to be answered in future research.
We acknowledge that there is a time investment associated with learning to conduct quantitative residue measurements using image analysis software tools such as ImageJ. However, with recent advances in measurements using digital technology, it is reasonable to assume that a semiautomated measurement using the NRRS could be implemented relatively easily in clinical settings [30]. For research purposes, we found that the time required for the NRRS measurement was similar to that needed for other quantitative measurements.
The current study was limited to measurements taken in the context of thin-liquid swallows. Future work should explore residues arising from the swallowing of other textures using the NRRS. It is arguably more likely that residue will be seen with thicker consistencies. Future work should also examine inter- and intrarater reliabilities for frame selection of NRRS measurement. Most importantly, the next steps should include a validation study of the NRRS against perceptual measures of residue severity from experienced clinicians to determine cut points on the NRRS associated with different degrees of functional impairment in post-swallow residue.
Conclusion
The NRRS provides a normalized continuous measurement characterizing residue in the valleculae and piriform sinuses and can be computed from videofluoroscopy video files using open-source imaging software and spreadsheets. The NRRS uses a quantitative measurement of residue ratio that is more precise than current methods and incorporates a novel measurement of residue normalized to an internal anatomical scalar. This scale will permit future studies to explore the association between quantified measures of residue severity and aspiration risk.
Acknowledgments
The first author is supported by Grant No. F31DC011705 from the National Institute on Deafness and Other Communication Disorders. The content is solely the responsibility of the author and does not necessarily represent the official views of the National Institute on Deafness and Other Communication Disorders or the National Institutes of Health. The second author has received funding for her doctoral studies from the Natural Sciences and Engineering Research Council (Canada) Create CARE program and the Ontario Student Opportunity Trust Fund. The fourth author holds a New Investigator award from the Canadian Institutes of Health Research. The authors thank Sarah Hori for assistance with data analysis and acknowledge the support of Toronto Rehabilitation Institute which receives funding under the Provincial Rehabilitation Research Program from the Ministry of Health and Long-term Care in Ontario. The views expressed do not necessarily reflect those of the ministry.
Footnotes
Conflict of interest The authors have no conflicts of interest to disclose.
Contributor Information
William G. Pearson, Jr., Department of Anatomy and Neurobiology, School of Medicine, Boston University, Boston, MA, USA.
Sonja M. Molfenter, Email: sonja.molfenter@uhn.ca, Swallowing Rehabilitation Research Laboratory, Toronto Rehabilitation Institute, University Health Network, 550 University Avenue, 12th Floor, Toronto, ON M5G 2A2, Canada. Department of Speech Language Pathology, University of Toronto, Toronto, ON, Canada.
Zachary M. Smith, Sargent College, Boston University, Boston, MA, USA
Catriona M. Steele, Swallowing Rehabilitation Research Laboratory, Toronto Rehabilitation Institute, University Health Network, 550 University Avenue, 12th Floor, Toronto, ON M5G 2A2, Canada. Department of Speech Language Pathology, University of Toronto, Toronto, ON, Canada. Bloorview Research Institute, Holland Bloorview Kids Rehabilitation, Toronto, ON, Canada.
References
- 1.Rosenbek JC, Roecker EB, Wood JL, Robbins JA. Thermal application reduces the duration of stage transition in dysphagia after stroke. Dysphagia. 1996;11:225–33. doi: 10.1007/BF00265206. [DOI] [PubMed] [Google Scholar]
- 2.Logemann J. Evaluation and treatment of swallowing disorders. 2. Austin: Pro-Ed; 1998. [Google Scholar]
- 3.Rao N, Brady SL, Chaudhuri G, Donzelli J, Wesling M. Gold-standard? Analysis of the videofluoroscopic and fiberoptic endoscopic swallow examinations. J Appl Res. 2003;3:89–96. [Google Scholar]
- 4.Perlman AL, Grayhack JP, Booth BM. The relationship of vallecular residue to oral involvement, reduced hyoid elevation, and epiglottic function. J Speech Hear Res. 1992;35:734–41. doi: 10.1044/jshr.3504.734. [DOI] [PubMed] [Google Scholar]
- 5.Ekberg O, Feinberg MJ. Altered swallowing function in elderly patients without dysphagia: radiologic findings in 56 cases. AJR Am J Roentgenol. 1991;156:1181–4. doi: 10.2214/ajr.156.6.2028863. [DOI] [PubMed] [Google Scholar]
- 6.Logemann JA, Rademaker A, Pauloski BR, Kelly A, Stangl-McB-reen C, Antinoja J, Grande B, Farquharson J, Kern M, Easterling C. A randomized study comparing the Shaker exercise with traditional therapy: a preliminary study. Dysphagia. 2009;24:403–11. doi: 10.1007/s00455-009-9217-0. [DOI] [PMC free article] [PubMed] [Google Scholar]
- 7.Clavé P, De Kraa M, Arreola V, Girvent M, Farré R, Palomera E, Serra-Prat M. The effect of bolus viscosity on swallowing function in neurogenic dysphagia. Aliment Pharmacol Ther. 2006;24:1385–94. doi: 10.1111/j.1365-2036.2006.03118.x. [DOI] [PubMed] [Google Scholar]
- 8.Dejaeger E, Pelemans W, Ponette E, Joosten E. Mechanisms involved in postdeglutition retention in the elderly. Dysphagia. 1997;12:63–7. doi: 10.1007/PL00009520. [DOI] [PubMed] [Google Scholar]
- 9.Omari TI, Dejaeger E, Van Beckevoort D, Goeleven A, De Cock P, Hoffman I, Smet MH, Davidson GP, Tack J, Rommel N. A novel method for the nonradiological assessment of ineffective swallowing. Am J Gastroenterol. 2011;106:1796–802. doi: 10.1038/ajg.2011.143. [DOI] [PubMed] [Google Scholar]
- 10.Logemann JA, Kahrilas PJ, Kobara M, Vakil NB. The benefit of head rotation on pharyngoesophageal dysphagia. Arch Phys Med Rehabil. 1989;70:767–71. [PubMed] [Google Scholar]
- 11.Pauloski BR, Rademaker AW, Logemann JA, Lazarus CL, Newman L, Hamner A, MacCracken E, Gaziano J, Stachowiak L. Swallow function and perception of dysphagia in patients with head and neck cancer. Head Neck. 2002;24:555–65. doi: 10.1002/hed.10092. [DOI] [PubMed] [Google Scholar]
- 12.Logemann JA, Williams RB, Rademaker A, Pauloski BR, Lazarus CL, Cook I. The relationship between observations and measures of oral and pharyngeal residue from videofluorography and scintigraphy. Dysphagia. 2005;20:226–31. doi: 10.1007/s00455-005-0019-8. [DOI] [PMC free article] [PubMed] [Google Scholar]
- 13.Robbins JA, Kays SA, Gangnon RE, Hind JA, Hewitt AL, Gentry LR, Taylor AJ. The effects of lingual exercise in stroke patients with dysphagia. Arch Phys Med Rehabil. 2007;88:150–8. doi: 10.1016/j.apmr.2006.11.002. [DOI] [PubMed] [Google Scholar]
- 14.Suiter DM, McCullough GH, Powell PW. Effects of cuff deflation and one-way tracheostomy speaking valve placement on swallow physiology. Dysphagia. 2003;18:284–92. doi: 10.1007/s00455-003-0022-x. [DOI] [PubMed] [Google Scholar]
- 15.Hind JA, Nicosia MA, Roecker EB, Carnes ML, Robbins JA. Comparison of effortful and noneffortful swallows in healthy middle-aged and older adults. Arch Phys Med Rehabil. 2001;82:1661–5. doi: 10.1053/apmr.2001.28006. [DOI] [PubMed] [Google Scholar]
- 16.Han TR, Paik NJ, Park JW. Quantifying swallowing function after stroke: A functional dysphagia scale based on videofluoroscopic studies. Arch Phys Med Rehabil. 2001;82:677–82. doi: 10.1053/apmr.2001.21939. [DOI] [PubMed] [Google Scholar]
- 17.Eisenhuber E, Schima W, Schober E, Pokieser P, Stadler A, Scharitzer M, Oschatz E. Videofluoroscopic assessment of patients with dysphagia: Pharyngeal retention is a predictive factor for aspiration. AJR Am J Roentgenol. 2002;178:393–8. doi: 10.2214/ajr.178.2.1780393. [DOI] [PubMed] [Google Scholar]
- 18.Ryu JS, Lee JH, Kang JY, Kim MY, Shin DE, Shin DA. Evaluation of dysphagia after cervical surgery using laryngeal electromyography. Dysphagia. 2012;27(3):318–24. doi: 10.1007/s00455-011-9368-7. [DOI] [PubMed] [Google Scholar]
- 19.Zoratto DCB, Chau T, Steele CM. Hyolaryngeal excursion as the physiological source of swallowing accelerometry signals. Physiol Meas. 2010;31:843–55. doi: 10.1088/0967-3334/31/6/008. [DOI] [PubMed] [Google Scholar]
- 20.Ishida R, Palmer JB, Hiiemae KM. Hyoid motion during swallowing: factors affecting forward and upward displacement. Dysphagia. 2002;17:262–72. doi: 10.1007/s00455-002-0064-5. [DOI] [PubMed] [Google Scholar]
- 21.Kuhlemeier KV, Yates P, Palmer JB. Intra-and interrater variation in the evaluation of videofluorographic swallowing studies. Dysphagia. 1998;13:142–7. doi: 10.1007/PL00009564. [DOI] [PubMed] [Google Scholar]
- 22.Stoeckli SJ, Huisman TAGM, Seifert BAGM, Martin-Harris BJW. Interrater reliability of videofluoroscopic swallow evaluation. Dysphagia. 2003;18:53–7. doi: 10.1007/s00455-002-0085-0. [DOI] [PubMed] [Google Scholar]
- 23.McCullough GH, Wertz RT, Rosenbek JC, Mills RH, Webb WG, Ross KB. Inter- and intrajudge reliability for videofluoroscopic swallowing evaluation measures. Dysphagia. 2001;16:110–8. doi: 10.1007/PL00021291. [DOI] [PubMed] [Google Scholar]
- 24.Dyer JC, Leslie P, Drinnan MJ. Objective computer-based assessment of valleculae residue: Is it useful? Dysphagia. 2008;23:7–15. doi: 10.1007/s00455-007-9088-1. [DOI] [PubMed] [Google Scholar]
- 25. [Accessed 30 May 2012.];The MBSImP-Guide-050311. https://www.mbsimp.com/uploads/MBSImP-Guide.pdf.
- 26.Pauloski BR, Rademaker AW, Kern M, Shaker R, Logemann JA. The feasibility of establishing agreement between laboratories for measures of oropharyngeal structural movements. J Med Speech Lang Pathol. 2009;17:9–19. [PMC free article] [PubMed] [Google Scholar]
- 27.Fleiss JL, Cohen J. The equivalence of weighted kappa and the intraclass correlation coefficient as measures of reliability. Educ Psychol Meas. 1973;33:613–9. [Google Scholar]
- 28.Viera AJ, Garrett JM. Understanding interobserver agreement: The kappa statistic. Fam Med. 2005;37:360–3. [PubMed] [Google Scholar]
- 29.Kotrlik JW, Williams HA. The incorporation of effect size in information technology, learning, and performance research. Inf Technol Learn Perform. 2003;21:1–7. [Google Scholar]
- 30.Aung MSH, Goulermas JY, Stanschus S, Hamdy S, Power M. Automated anatomical demarcation using an active shape model for videofluoroscopic analysis in swallowing. Med Eng Phys. 2010;32:1170–9. doi: 10.1016/j.medengphy.2010.08.008. [DOI] [PubMed] [Google Scholar]