

Abstract
Combining the power of immunomagnetic assay and microfluidic microchip operations, we successfully detected rare CTCs from clinical blood samples. The microfluidic system is operated in a flip-flop mode, where a computer-controlled rotational holder with an array of microfluidic chips inverts the microchannels. We have demonstrated both theoretically and experimentally that the direction of red blood cell (RBC) sedimentation with regards to the magnetic force required for cell separation is important for capture efficiency, throughput, and purity. The flip-flop operation reduces the stagnation of RBCs and non-specific binding on the capture surface by alternating the direction of the magnetic field with respect to gravity.
The developed immunomagnetic microchip-based screening system exhibits high capture rates (more than 90%) for SkBr3, PC3, and Colo205 cell lines in spiked screening experiments and successfully isolates CTCs from patient blood samples. The proposed motion controlled microchip-based immunomagnetic system shows great promise as a clinical tool for cancer diagnosis and prognosis.
Keywords: Circulating tumor cells (CTCs), immunomagnetic assay, microfluidic chip, gravity, capture efficiency, purity, fluorescent imaging
Introduction
Detection of circulating tumor cells (CTCs) in blood can potentially reveal crucial information about cancer biology. Separation of rare CTCs from whole blood samples is gaining considerable attention in studying cancer biology [1]. CTCs can be important indicators of metastatic cancer disease [2–8]. Monitoring the response to a treatment couple weeks after initiation of the treatment provides important information for decisions on individualized treatment [9]. However, isolation of CTCs from whole patient blood samples is challenging due to the rarity of CTCs (1:107–109 blood cells).
Several approaches to developing an effective CTC screening systems, such as CellSearch™ system [10], have been proposed to enumerate CTCs. However, CellSearch system’s available functionality is still limited only to enumeration of cells suspended in liquid, and it is not straightforward to further track and analyze individual cells. Various microfluidic devices have been developed for isolating rare cells, including CTCs. Microfluidic devices with antibody-coated microstructures for target rare cells are proposed [11–15]. Some devices are based on differences in cell size [16–18]. Recently, microfluidic devices integrated with magnetic carriers are proposed for the enrichment of CTCs [19–23]. Integration of an immunomagnetic assay and a microfluidic chip precisely controls screening process by utilizing miniaturized immunomagnetic techniques inside microchannels for efficient isolation of magnetic nanoparticle-labeled cells.
Here we introduce an automated motion-controlled microfluidic system for immunomagnetic detection of CTCs. Based on the screening system we previously developed for spiked screening experiments [24], we optimize magnetic field distribution by smoothening magnetic gradient within the microchannel. A spacer is inserted between the microchannel and the permanent magnets close to the front end of microchannel to reduce magnetic force near the inlet, eliminating aggregation of nanoparticles. We retain direct contact between magnets and microchannel to have a stronger magnetic field at the rear end of microchannel, aiming to capture all cells that escape weaker magnetic field near the inlet. As a whole, particles can be distributed evenly on the CTC capture plane. Moreover, we introduce here the flip-flop automated motion control system that can dynamically change the orientation of microchannel. According to our theoretical investigation, blood sedimentation in the microchannel plays a critical role in affecting capture efficiency, throughput, and purity of the system [25]. Therefore, by dynamically modifying the orientations of microchannel, the negative effects of blood stagnation, such as mechanical interference and non-specific bindings, can be minimized. The rotational holder is computer-controlled, placing microchannels in an inverted or upright position according to different requirements from different screening steps. After screening, CTCs are permanently fixed on a glass coverslip surface. Cells being permanently fixed on glass substrate are beneficial for future track and further analysis, such as fluorescence in situ hybridization (FISH) analysis and hyperspectral microscopic imaging (HMI) analysis [26–29].
Materials and methods
Design and fabrication of microchip-based immunomagnetic system
Schematic of the microchip-based immunomagnetic isolation system is shown in Figure 1. A polydimethylsiloxane (PDMS) microchannel bonded to a glass coverslip is used as a chamber through which blood sample flows. Target cancer cells are labeled with commercial Fe3O4 magnetic nanoparticles (Veridex Ferrofluid™, LLC), which are functionalized with anti-epithelial cell adhesion molecules (anti-EpCAM). As the blood sample flows through the microchannel on top of an array of permanent magnets, nanoparticle-labeled cancer cells are separated from blood flow and are captured on the substrate of the microchannel. Glass slides with captured cancer cells are then detached from the PDMS microchannel and fluorescently stained with DAPI, anti-cytokeratin, and anti-CD45. Subsequently, fluorescence images of captured and stained cancer cells are taken and used for cancer cell identification by trained observers based on fluorescence intensities and cell morphological information. An array of magnets (Block NdFeB magnet, product of 42 MGOe, grade N42, 3/4″ × 1/2″ × 7/32″, magnetized through 3/4″) with opposite polarities next to each other is placed outside the channel on top of the glass substrate in the inverted microchip. Figure 1(a) shows the operation of the microchip-based screening system. A 1 mm thick spacer (elastic sheet magnet, which sizes 10 mm ×20 mm ×1 mm) is introduced at the front end of the microchannel between the magnets and the microchannel, as shown in Figure 1(b). Figure 1(c) shows the top view of the microchip-based screening system without any spacers. Dimensions of the microchip are also shown in Figure 1(c). The top view of the microchip together with a spacer is shown in Figure 1(d). Aggregation of nanoparticles interferes with the identification process by burying the CTCs, making them invisible, or even damaging them. Using a compact system of a spacer and a permanent magnet array, we created a smooth magnetic gradient distribution across the microchannel. Strong magnetic field gradient rather than absolute magnetic field strength is required for effective attraction of magnetic nanoparticles, which function as small magnetic dipoles. Target nanoparticle-labeled CTCs and free nanoparticles experience a smaller magnetic field in the first half of the microchannel and gradually flow to the area with a stronger magnetic field at the other end near the outlet. This design avoids nanoparticle aggregation that interferes with subsequent immunofluorescence observation. The clinical blood sample, containing CTCs expressing EpCAM, is mixed with magnetic nanoparticles conjugated with anti-EpCAM to label target CTCs. The size of Fe3O4 particles (Veridex Ferrofluid) is of the order of 100 nm. The microchannel is made by bonding a PDMS channel (Sylgard184, Dow Corning, Midland, MI, 10:1 prepolymer to curing agent) with a 150 μm thick glass coverslip. A standard syringe pump (Harvard apparatus, PHD IW with 6×10 rack) is attached to the outlet of the PDMS microchip through tubing and used to draw blood sample with a syringe. The reservoir, which is held higher than the microchip, is connected to the inlet through tubing.
Fig. 1.

PDMS microchip design for immunomagnetic isolation of cancer cells. Magnets are put on top of the microchannel (inverted channel) during the whole screening process. (a) Schematic illustration of the principle of operation of the inverted microchip. Magnetic nanoparticle-labeled CTCs are captured to the microchannel substrate by the magnetic field as the blood sample flows through the microchannel. Gravity force drags blood cells to the opposite side of the microchannel substrate. (b) A spacer, which is placed between the magnets and microchannel, is introduced to create magnetic field gradient increasing throughout the whole microchannel. (c) Top view of a microchannel and permanent magnets. (d) Top view of a microchannel and permanent magnets together with a spacer.
We developed an automatic rotational microchip holder, which is comprised of DC motors and optical position sensors. Figure 2 shows the developed screening system. A LabView program is used to control the position of the rotating arm. The system is able to dynamically rotate the orientation of the microfluidic chips to keep them operated in the best orientation. The system can also rock the reservoir to keep blood sample mixed during the screening experiments. The screening system is capable of screening up to six samples simultaneously.
Fig. 2.

Automated screening system for parallel screening, rotation of microchips, and rock of reservoirs.
Magnetic field distribution
We used a gauss meter to measure the magnetic field of one magnet, and used the measured values to define parameters in the simulation and calculate the result of three magnets arranged with opposite polarities next to each other. We used COMSOL for the magnetic field simulation. Figure 3(a) plots the magnetic field flux density distribution for a plane 200 μm away from the bottom substrate of the microchannel calculated using commercial finite element method (FEM) software COMSOL. In order to demonstrate our idea of smoothening the magnetic field gradient by adding spacers, we compared the magnetic flux densities at three different sites (Lines 1, 2, and 3 in the inset of Figure 3(b)) over the channel. It is observed that the spacer decreases the magnetic field, reducing the gradient, and thus reducing the magnetic force acting on nanoparticles in the microchannel. Magnetic field flux density distribution for a plane 200 μm away from the channel substrate with no spacers placed on top of the magnets is shown in Figure 3(c). Moreover, in order to prove that the cells will be captured onto the surface of the microchannel, we compare the magnetic flux density at the bottom and top of the channel as shown in Figure 3(d).
Fig. 3.

Magnetic field distribution in the microchannel, calculated using COMSOL. (a) Magnetic field distribution of three parallel magnets with a spacer. (b) Magnetic flux densities at different locations across the channel (lines 1, 2, and 3) at the height of 200 μm in the microchannel. (c) Magnetic field distribution of permanent magnets without spacers. (d) Plots of magnetic flux densities at the top and bottom of the microchannel.
Flow of red blood cell in the microchannel
The details of the calculation method (sedimentation model and viscosity model) are described in our previous publication [25]. In brief, the channel space is divided into multiple cubic control volumes. The RBC volumetric concentration in each control volume is updated for each time step based on RBC fluxes from adjacent control volumes. Based on the experimental measurement, a linear relation between the RBC concentration and local viscosity is established to calculate the local viscosity in each control volume.
Sample preparation
Blood samples, which were collected in CellSave™ tubes (Veridex, LLC, NJ) and EDTA tubes, from the University of Texas Southwestern Medical Center were separated into conical tubes, each with 2.5 mL of blood sample. Blood plasma was then replaced with dilution buffer solution (Veridex, LLC). A suspension of anti-EpCAM functionalized Fe3O4 magnetic nanoparticles and capture enhancement reagent (Veridex, LLC) were added into each conical tube and incubated in a strong magnetic field. Subsequently, blood samples were screened by the developed system.
Colo205 (colon cell line), PC3 (prostate cell line) and SkBr3 (breast cell line) were used for spiked experiments to characterize the capture efficiency of the developed screening system. A solution with approximately 200 cells (100 μL cell suspension) was spiked into 2.5 mL aliquot of blood sample. The same amount of cell suspension (100 μL) was dropped on two glass slides and used as control samples. The capture rate is calculated by dividing the number of cells that are actually spiked into the screening sample by the average number of cells on two control glass slides.
Separation process
A syringe pump was used to draw the blood sample from the reservoir into the microchannel for the separation process. Flow rate was 2.5 mL/hour. After the separation step, phosphate buffered saline (PBS) was introduced into the microchannel for the flushing step to remove unwanted cells, including RBCs, white blood cells (WBCs), and non-target cells, from the glass coverslip. Next, captured nanoparticle-labeled CTCs were fixed on the glass coverslip permanently using cold acetone while cooling down the microchip in the ice bath. After peeling the PDMS microchip off the glass coverslip, the sample slide was stored at 4°C before the following identification process.
Identification process
The sample slides were immunofluorecently stained with DAPI (used to stain DNA in cell nucleus), anti-cytokeratin (used to stain protein in epithelial tissue) and anti-CD45 (expressed on leukocytes). Captured CTCs show positive DAPI, positive CK, and negative CD45. More details about the staining step and identification step are described in [24].
Results and Discussion
Measured magnetic field
Figure 4(a) shows the measured magnetic field induced by a permanent magnet without any spacers. A distribution of nanoparticles on the channel substrate after the screening is shown in Figure 4(b). Many particles were aggregated on the glass coverslip along the strong magnetic field. Figure 4(c) shows the measured magnetic field of a permanent magnet attached with a spacer. With the spacer, fewer nanoparticle aggregates can be seen in the front end of the microchip, as shown in Figure 4(d).
Fig. 4.

(a) Measured magnetic field of a permanent magnet without any spacers. (b) More nanoparticles aggregate close to the front end of the glass coverslip when no spacers was induced. (c) Measured magnetic field of a permanent magnet together with a spacer. (d) Less nanoparticles aggregate in the front end of the glass coverslip.
Viscosity measurement of RBCs
We performed experimental measurements to calibrate the relation between the RBC volumetric concentration and local viscosity, using a cone plate viscometer (DV-I+, Brookefield, Middleboro, MA). The shear rate we used for the measurement was 2s−1. The results are shown in Table 1. Obviously, the viscosity is direct proportional to the RBC volumetric concentration, with an approximately linear relationship.
Table 1.
Measurement results of viscosities of different RBC volumetric concentration.
| Red blood cell volumetric concentration | 50 | 25 | 12.5 | 6.3 | 3.1 |
| Viscosity (cP) | 18.4 | 15.3 | 6.13 | 7.15 | 5.11 |
Blood sedimentation experiments
Figure 5 shows the experimental results of RBC sedimentation in the upright channel and the inverted channel. The microchannel was filled with PBS followed by the introduction of RBCs. The flow rate was set to be 10 mL/hr. With the upright channel, RBC sedimentation covers the bottom substrate, which is the CTC capture substrate. It is observed that the substrate is being covered by the layer of RBCs, as shown in Figure 5(a), in the upright case. Figure 5(b) shows RBCs settle down on the opposite plane of the CTC capture substrate in the inverted channel. Therefore, in the upright channel, RBCs sedimentation on the CTC capture substrate acts as a barrier layer for target cells to be captured on the substrate. Compared to the upright channel, nanoparticle-labeled target cells can be easily attracted to the channel substrate in the inverted channel.
Fig. 5.
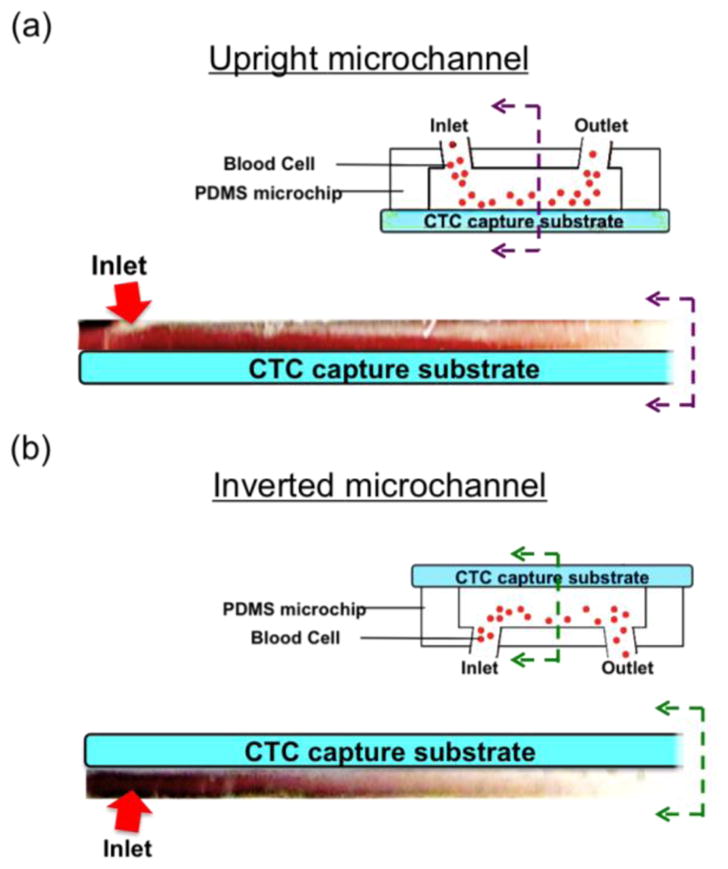
Experimental photos of blood sedimentation in microchip of a flip flop operation. (a) Sedimentation layer of RBCs is on the CTC capture substrate that acts as a barrier for the capture of CTC in the upright channel. (b) RBC sedimentation layer covers the opposite plane of the CTC capture substrate that target CTCs experience less viscous force by the RBCs to be captured on the CTC capture substrate.
The spiked sample experiments
The positions of the captured cells on the glass substrate are also shown in Figure 6. On the upright channel (Figure 6(a)), 58 cells were found on the coverslip while on the inverted channel, more cancer cells (111 cells) were found on the coverslip (Figure 6(b)). As we discussed above, this resulted from the blood cell’s sedimentation impact on cancer cell separation. Due to high viscous layer covering the substrate in the upright channel, it is more difficult for cancer cells to get close to and finally be captured onto the channel substrate. Therefore, more cells are captured on the channel substrate of the inverted channel in comparison to the cells captured on the substrate of the upright channel.
Fig. 6.
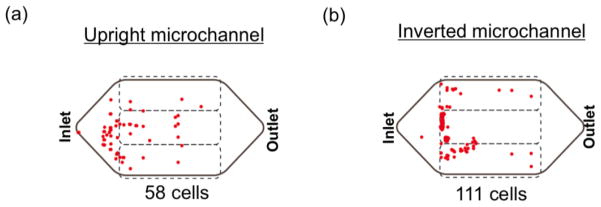
Map of spiked cancer cells (Colo205 cells) on the glass coverslip. (a) On the upright channel, less cancer cells (58 cells) were found. (b) More cancer cells (111 cells) were captured by the inverted channel.
For the assessment of number of cancer cells non-selectively stays on the channel substrate, a blood sample was spiked with approximately 100,000 cancer cells for a screening experiment without any permanent magnets placed under the microchip. The screened result showed that no cancer cell was found from the channel substrate. The developed system proves the high selectivity [24].
Figure 7(a) shows the fluorescence images of a captured Colo205 along with two WBCs from the spiked screening experiment. Fluorescence images of captured PC3 and SkBr3 are also shown in Figure 7(b) and Figure 7(c), respectively.
Fig. 7.
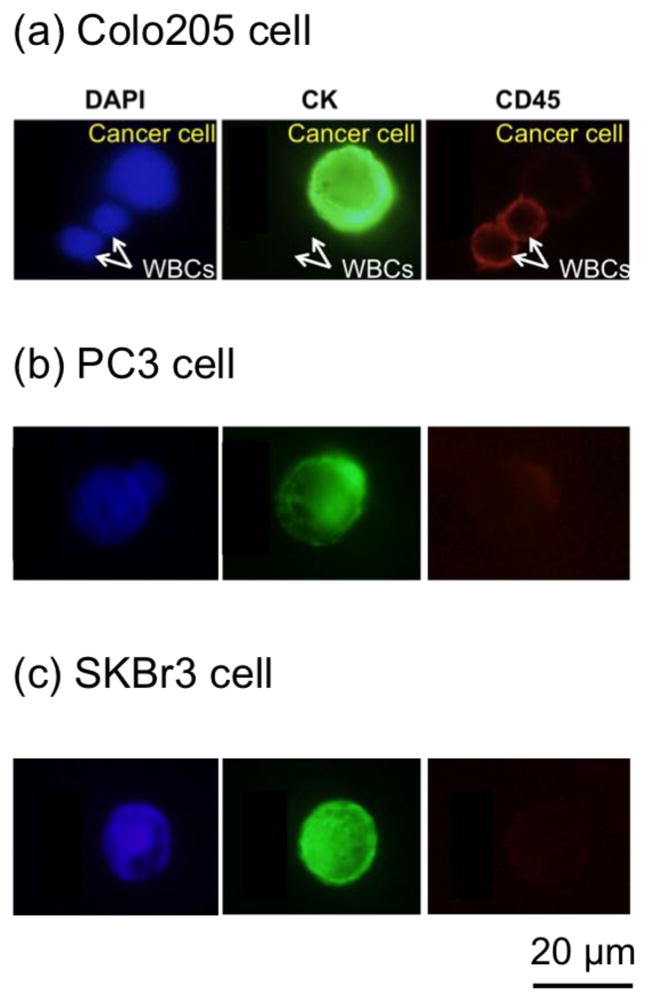
Fluorescence images of captured cancer cells and WBCs. (a) Examples of DAPI (blue, positive), CK (green, positive), and CD45 (red, negative) fluorescence images of a captured Colo205 cell along with DAPI (blue, positive), CK (green, negative), and CD45 (red, positive) fluorescence images of two WBCs. (b) Fluorescence images of a captured PC3 (prostate cancer cell line). (c) Fluorescence images of a captured SkBr3 (breast cancer cell line).
Using the screening system for the spiked experiments, the average capture rates for SkBr3, PC3 and Colo205 cells were 97%, 107% and 94%, respectively. Capture rates could be more than 100% when the number of cells added to the spiked sample is more than the number of cells prepared for the control samples due to concentration variations in small sampling aliquots.
Patient studies
The system was applied to the clinical study of isolating CTCs from patient samples. CTCs were successfully isolated from patients’ blood samples with a variety of types of cancer. Figure 8 shows immunofluorescence images of captured CTCs separated from clinical samples. Figure 8(a) shows a single CTC found from two patient samples. Table 2 shows the numbers of CTCs found from screened subject samples in which CTCs were captured by the microchip. Samples number 1 and 2 were screened with the commercial CellSearch screening system in parallel with our microchip-based screening system for evaluation. Our system had comparable capture rates with the CellSearch system. In addition, we were able to find clusters of CTCs in clinical samples (Figure 8(b)). Clusters of CTCs could detach from the proliferation of intravascular cancer cells [30]. A cluster of 50 CTCs was captured from patient sample number 2, a blood sample from a female subject with breast cancer disease. More than a thousand CTCs were found from the patient sample number 9 (Figure 8(c)), who had a stage 4 lung cancer. Unlike spiked cancer cells (see Figure 7), CTCs separated from clinical samples vary in size, shape, and CK expression level. Cancer cells in Figure 8(c) also shows lower level of CK comparing to the higher CK level of spiked cancer cells in Figure 7. Cultured cancer cell lines such as PC3, SkBr3 and Colo205 that are commonly used for spiked screening experiments express more EpCAM or Cytokeratin than CTCs from clinical samples since some CTCs are believed to undergo Epithelial Mesenchymal Transition (EMT) while circulating in the blood stream [31–32].
Fig. 8.
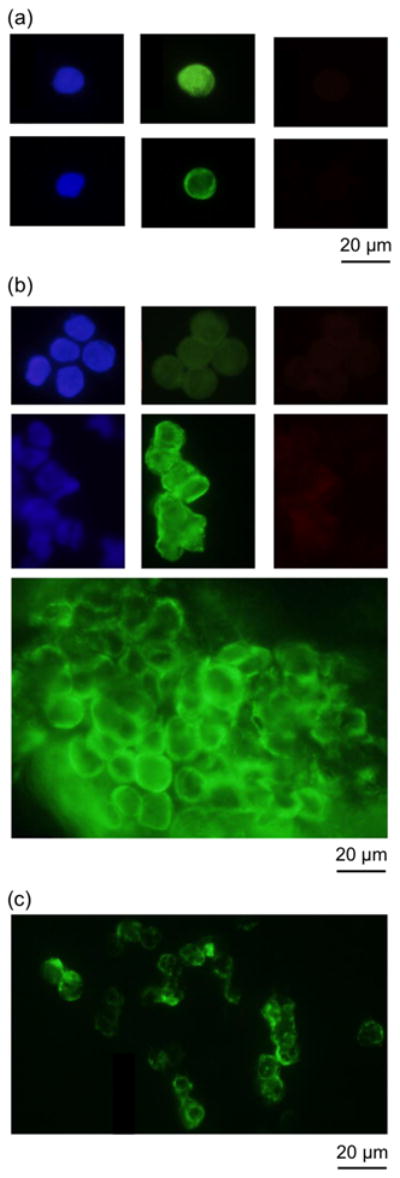
Fluorescence images of captured CTCs from patient samples. (a) Singlet CTCs isolated from patient samples. (b) Clusters of CTCs separated from patient samples. (c) Clusters of CTCs from a patient sample.
Table 2.
Summary of patient samples and CTC counts of blood samples from cancer patients (pathology information included).
| Sample number | Ferrofluid/blood (μl/mL) | Flow rate (mL/hr) | Screen volume (mL) | Numbers of CTCs | Gender | Cancer type | Numbers of CTCs/7.5mL (Microchip) | Numbers of CTCs/7.5mL (CellSearch) |
|---|---|---|---|---|---|---|---|---|
| 1 | 7.5 | 2.5 | 5 | 30 | F | Breast cancer | 20 | 16 |
| 2 | 7.5 | 2.5 | 10 | 50 | F | Breast cancer | 33 | 10 |
| 3 | 7.5 | 2.5 | 5 | 1 | M | Prostate cancer | 0.6 | 3 |
| 4 | 7.5 | 2.5 | 5 | 1 | F | Lung Cancer | 0.6 | N/A |
| 5 | 7.5 | 2.5 | 5 | 1 | F | Lung Cancer | 0.6 | N/A |
| 6 | 7.5 | 2.5 | 7.5 | 5 | F | Breast cancer | 3 | N/A |
| 7 | 7.5 | 2.5 | 5 | 19 | F | Breast cancer | 13 | N/A |
| 8 | 7.5 | 2.5 | 5 | 28 | F | Lung Cancer | 19 | N/A |
| 9 | 7.5 | 2.5 | 5 | >1000 | F | Breast cancer | >666 | N/A |
| 10 | 7.5 | 2.5 | 7.5 | 1 | F | Breast cancer | 0.6 | N/A |
| 11 | 7.5 | 2.5 | 7.5 | 1 | F | Breast cancer | 0.6 | N/A |
Conclusion
We have developed a unique immunomagnetic microchip-based flip-flop automated screening system. Surface functionalized magnetic nanoparticles are used to label target cancer cells in the microchip during the blood screening process. Target cancer cells are captured on the flat surface of a glass substrate making it beneficial for the identification process. We optimized the magnetic field distribution by reducing the magnetic force close to the front end of the microchannel thus reducing the nanoparticle aggregation close to the inlet. In particular, the flip-flop dynamic system can change the orientation of the microchip reducing the stagnation of RBCs and non-specific binding on the capture surface.
With the optimized conditions of the screening system, captured rates of more than 90% were demonstrated for blood samples spiked with SkBr3, PC3, and Colo205 cells. The screening system successfully isolated CTCs from the blood samples of cancer patients. Efficient capturing of CTCs has been demonstrated, while the rare cells were fixed on the coverslip after screening for further biological and imaging analysis. Different types of CTCs were observed from patient blood samples. Many clusters of CTCs were isolated from patient blood samples. The proposed motion controlled microchip-based immunomagnetic system shows great promise as a tool for cancer prognosis.
Acknowledgments
We thank Dr. Hirofumi Tanaka of the University of Texas at Austin for his help in the measurements of blood viscosities and Dr. Rodney S. Ruoff’s laboratory of the University of Texas at Austin for his help in the COMSOL simulation. We also want to thank Microelectronics Research Center (MRC) and Center for Nano- and Molecular Science (CNM) at UT Austin for providing facilities for microchip fabrication. We are grateful for the financial support from National Institute of Health (NIH) National Cancer Institute (NCI) Cancer Diagnosis Program under the grant 1R01CA139070.
Contributor Information
Yu-Yen Huang, Email: eric09012008@utexas.edu.
Xiaojing Zhang, Email: john.zhang@engr.utexas.edu.
References
- 1.Uhr JW, Pantel K. PNAS. 2011;108:12396–12400. doi: 10.1073/pnas.1106613108. [DOI] [PMC free article] [PubMed] [Google Scholar]
- 2.Fehm T, Sagalowsky A, Clifford E, Beitsch P, Saboorian H, Euhus D, Meng S, Morrison L, Tucker T, Lane N, Ghadimi BM, Heselmeyer-Haddad K, Ried T, Rao C, Uhr JW. Clinical Cancer Research. 2002;8:2073–2084. [PubMed] [Google Scholar]
- 3.Allard WJ, Matera J, Miller MC, Repollet M, Connelly MC, Rao C, Tibbe AGJ, Uhr JW, Terstappen LW. Clinical Cancer Research. 2004;10:6897–6904. doi: 10.1158/1078-0432.CCR-04-0378. [DOI] [PubMed] [Google Scholar]
- 4.Budd GT, Cristofanilli M, Ellis MJ, Stopeck A, Borden E, Miller MC, Matera J, Repollet M, Doyle GV, Terstappen LWMM, Hayes DF. Clinical Cancer Research. 2006;12:6403–6409. doi: 10.1158/1078-0432.CCR-05-1769. [DOI] [PubMed] [Google Scholar]
- 5.Paterlini-Brechot P, Benali NL. Science. 2007;253:180–204. doi: 10.1016/j.canlet.2006.12.014. [DOI] [PubMed] [Google Scholar]
- 6.Mostert B, Sleijfer S, Foekens JA, Gratama JWS. Cancer Treat Rev. 2009;35:463–474. doi: 10.1016/j.ctrv.2009.03.004. [DOI] [PubMed] [Google Scholar]
- 7.Liu MC, Shields PG, Warren RD, Cohen P, Wilkinson M, Ottaviano YL, Rao SB, Eng-Wong J, Seillier-Moiseiwitsch F, Noone AM, Isaacs C. Journal of Clinical Oncology. 2009;27:5153–5159. doi: 10.1200/JCO.2008.20.6664. [DOI] [PMC free article] [PubMed] [Google Scholar]
- 8.Bao N, Le TT, Cheng JX, Lu C. Integrative Biology. 2010;2:113–120. doi: 10.1039/b919820b. [DOI] [PMC free article] [PubMed] [Google Scholar]
- 9.Jocelyn K. Science. 2010;327:1072–1074. [Google Scholar]
- 10.Miller MC, Doyle GV, Terstappen LWMM. Journal of Oncology. 2010;2010:1–8. doi: 10.1155/2010/617421. [DOI] [PMC free article] [PubMed] [Google Scholar]
- 11.Nagrath S, Sequist LV, Maheswaran S, Bell DW, Irimia D, Ulkus L, Smith MR, Kwak EL, Digumarthy S, Muzikansky A, Ryan P, Balis UJ, Tompkins RG, Haber DA, Toner M. 2007;450:1235–1239. doi: 10.1038/nature06385. [DOI] [PMC free article] [PubMed] [Google Scholar]
- 12.Talasaza AH, Powellc AA, Huberb DE, Berbeeb JG, Rohd KH, Yud W, Xiaob W, Davisd MM, Peasea RF, Mindrinosb MN, Jeffrey SS, Davis RW. PNAS. 2009;106:3970–3975. doi: 10.1073/pnas.0813188106. [DOI] [PMC free article] [PubMed] [Google Scholar]
- 13.Stott SL, Hsu CH, Tsukrov DI, Yu M, Miyamoto DT, Waltman BA, Rothenberg SM, Shah AM, Smas ME, Korir GK, Floyd FP, Jr, Gilman AJ, Lord JB, Winokur D, Springer S, Irimia D, Nagrath S, Sequist LV, Lee RJ, Isselbacher KJ, Maheswaranc S, Haber DA, Toner M. PNAS. 2010;107:18392–18397. doi: 10.1073/pnas.1012539107. [DOI] [PMC free article] [PubMed] [Google Scholar]
- 14.Hosokawa M, Hayata T, Fukuda Y, Arakaki A, Yoshino T, Tanaka T, Matsunaga T. Anal Chem. 2010;82:6629–6635. doi: 10.1021/ac101222x. [DOI] [PubMed] [Google Scholar]
- 15.Sun J, Li M, Liu C, Zhang Y, Liu D, Liu W, Hu G, Jiang X. Lab on a Chip. 2012 doi: 10.1039/c2lc40679a. [DOI] [PubMed] [Google Scholar]
- 16.Bhagat AA, Hou HW, Li LD, Lim CT, Han J. Lab on a Chip. 2011;11:1870–1878. doi: 10.1039/c0lc00633e. [DOI] [PubMed] [Google Scholar]
- 17.Hur SC, Mach AJ, Carlo DD. AIP Biomicrofluidics. 2011;5:022206. doi: 10.1063/1.3576780. [DOI] [PMC free article] [PubMed] [Google Scholar]
- 18.Zhang S, Lin HK, Lu B. Biomed Microdevices. 2011:203–213. doi: 10.1007/s10544-010-9485-3. [DOI] [PMC free article] [PubMed] [Google Scholar]
- 19.Yung CW, Fiering J, Mueller AJ, Ingber DE. Lab on a Chip. 2009;9:1171–1177. doi: 10.1039/b816986a. [DOI] [PubMed] [Google Scholar]
- 20.Estes MD, Ouyang B, Ho SM, Ahn CH. J Micromech Microeng. 2009;19:095015. [Google Scholar]
- 21.Kang JH, Krause S, Tobin H, Mammoto A, Kanapathipillai M, Ingber DE. Lab on a Chip. 2012;12:2175–2181. doi: 10.1039/c2lc40072c. [DOI] [PubMed] [Google Scholar]
- 22.Zhu T, Cheng R, Lee SA, Rajaraman E, Eiteman MA, Querec TD, Unger ER, Mao L. Microfluid Nnaofluid. 2012 doi: 10.1007/s10404-012-1004-9. [DOI] [PMC free article] [PubMed] [Google Scholar]
- 23.Hossain M, Luo Y, Sun Z, Wang C, Zhang M, Fu H, Qiao Y, Su M. Biosensors and Bioelectronics. 2012;1:348–354. doi: 10.1016/j.bios.2012.06.020. [DOI] [PubMed] [Google Scholar]
- 24.Hoshino K, Huang YY, Lane N, Huebhman M, Uhr JW, Frenkel EP, Zhang XJ. Lab on a Chip. 2011;11:3449–3457. doi: 10.1039/c1lc20270g. [DOI] [PMC free article] [PubMed] [Google Scholar]
- 25.Hoshino K, Chen P, Huang YY, Zhang XJ. Journal of Analytical Chemistry. 2012;10:4292–4299. doi: 10.1021/ac2032386. [DOI] [PMC free article] [PubMed] [Google Scholar]
- 26.Sieben VJ, Debes Marun CS, Pilarski PM, Kaigala GV, Pilarski LM, Backhouse CJ. IET Nanobiotechnol. 2007;1:27–35. doi: 10.1049/iet-nbt:20060021. [DOI] [PubMed] [Google Scholar]
- 27.Shaffer DR, Leversha MA, Danila DC, Lin O, Gonzalez-Espinoza R, Gu B, Anand A, Smith K, Maslak P, Doyle GV, Terstappen LWMM, Lilja H, Heller G, Fleisher M, Scher HI. Clinical Cancer Research. 2007;13:2023–2029. doi: 10.1158/1078-0432.CCR-06-2701. [DOI] [PubMed] [Google Scholar]
- 28.Swennenhuis JF, Tibbe AG, Levink R, Sipkema RC, Terstappen LW. Cytometry A. 2009;75:520–527. doi: 10.1002/cyto.a.20718. [DOI] [PubMed] [Google Scholar]
- 29.Leversha MA, Han J, Asgari Z, Danila DC, Lin O, Gonzalez-Espinoza R, Anand A, Lilja H, Heller G, Fleisher M, Scher HI. Clinical Cancer Research. 2009;15:2091–2097. doi: 10.1158/1078-0432.CCR-08-2036. [DOI] [PMC free article] [PubMed] [Google Scholar]
- 30.Al-Mehdi AB, Tozawa K, Fisher AB, Shientag L, Lee A, Muschel RJ. Nat Med. 2000;6:100–102. doi: 10.1038/71429. [DOI] [PubMed] [Google Scholar]
- 31.Uva P, Lahm A, Sbardellati A, Grigoriadis A, Tutt Andrew, Rinaldis ED. PLoS ONE. 2010;5:11. doi: 10.1371/journal.pone.0011742. [DOI] [PMC free article] [PubMed] [Google Scholar]
- 32.Lazar DC, Cho EH, Luttgen MS, Metzner TJ, Uson ML, Torrey M, Gross ME, Kuhn P. Physical Biology. 2012;9:7. doi: 10.1088/1478-3975/9/1/016002. [DOI] [PMC free article] [PubMed] [Google Scholar]