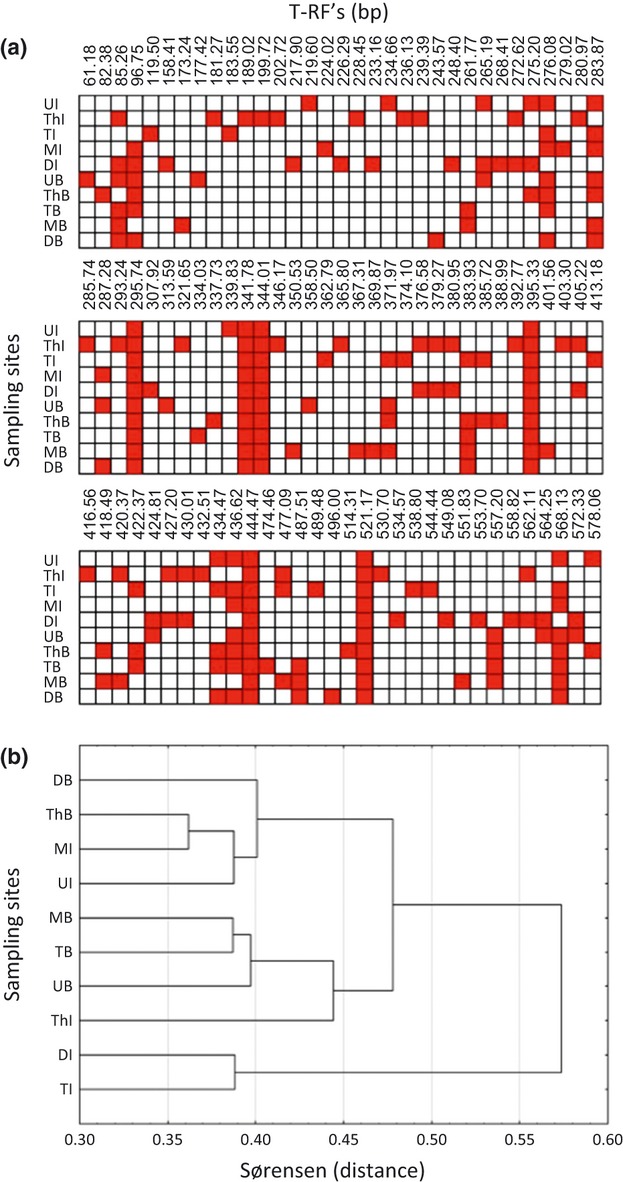
Figure 2.

(a) Presence/absence map of terminal restriction fragments (T-RFs) obtained from three different restriction enzymes. Colored boxes indicate the presence of a specific T-RF at brines (B) and halocline interfaces (I) of the different sampling sites. (b) Hierarchical clustering (Sørensen distance) of sampling sites based on presence/absence of T-RFs. D, Discovery; M, Medee; T, Tyro; Th, Thetis; U, Urania.
