

Abstract
Purpose
The biodistribution of Lipid/Calcium/Phosphate (LCP) nanoparticles (NPs) in tumor-bearing mice was investigated using fluorescence imaging. A quantitative validation of this method was done by 3H and 111In labeling of the nanoparticles.
Methods
The biodistribution of LCP NPs containing oligonucleotides was investigated using three different probes: Texas-Red labeled oligonucleotides, 3H-labeled oligonucleotides, and 111In-labled calcium phosphate.
Results
A discrepancy was found between the radioactivity and the fluorescence signals. Signals from 3H and 111In exhibited very similar distribution patterns, suggesting that liver and spleen were the major accumulation sites. However, fluorescence imaging indicated that tumor accumulation was predominant. We further confirmed that the fluorescence signals in both liver and spleen were greatly attenuated compared with those in the tumor due to the intrinsic tissue absorption and scattering. Near-infrared (NIR) dye Cy5.5 also suffered from the same problem, in that the quantitative data from whole organs was dramatically affected by absorption and scattering properties of the tissue.
Conclusions
Careful attention must be paid to the quantification and interpretation of fluorescence imaging measurements when comparing different tissues.
Keywords: biodistribution, fluorescence imaging, nanoparticle, quantitation
INTRODUCTION
The use of therapeutic macromolecules such as oligonucleotides has been intensively studied for the treatment of several major disorders. A key issue for successful development of these therapies is to understand and control the biodistribution of macromolecules (1). Pharmacokinetics and biodistribution studies can provide invaluable information early in the development. This importance has created a need for techniques that can analyze the macromolecules qualitatively. Traditionally, biodistribution studies of macromolecules were carried out in animals by measuring the radioactivity associated with the drugs (2,3). Mass spectrometry methods have also been developed to study the biodistribution of drugs, which allows for both quantification and identification of the analyte (4). Obviously, radioactive compound is a potential health hazard and environmentally unfriendly. Synthesis and disposal of radioactive compound are expensive. For some isotopes with relatively short half-lives, radioactivity decay is quite rapid and thus, the compounds lose their usefulness in time. Mass spectrometry (MS) is now playing a central role in pharmacokinetics and biodistribution studies. Advances in ionization methods, including electrospray ionization (ESI) and matrix-assisted laser desorption/ionization (MALDI), have expanded the use ofMS in investigatingmacromolecular drugs. However, successful MS measurement relies on target molecule extraction/isolation from biological specimens, the procedure of which can be complicated (5). Many labs still cannot readily access the resources and expertise required for this method. In addition, mass spectrometry is an end-point measurement, which lacks the ability to probe dynamic events in real time. In this circumstance, fluorescence imaging is emerging as a popular modality to couple with the traditional methods. Fluorescent dyes are conjugated to the drug to produce optical probes used in vivo or ex vivo. This technology is relatively safe, low-cost and noninvasive. The key to effective imaging, especially in deep tissues, is the use of fluorophores with a red or near infrared (NIR) emission range (600–1000 nm), which corresponds to low photon absorption and auto fluorescence in tissues. Biological chromophores, in particular hemoglobin, strongly absorb visible light, thereby limiting the penetration depth to only a few millimeters. Other biological components, such as water and lipids, are optically transparent from the visible to the NIR range, but strongly absorb light in the infrared. The combined absorption of these components translates into this optical imaging window of approximately 600 to 1000 nm where the absorption coefficient of tissue is at a minimum. In addition, light scattering and auto fluorescence are low in the NIR. This allows a significant signal with relatively low background (6,7).
Many researchers, including ourselves, have used fluorescence imaging extensively to assess the biodistribution of nanoparticles loaded with fluorescence-labeled drugs (8-11). It gives an indication of global tissue accumulation patterns, which facilitates design and optimization of the formulation. Although most of these studies quantified the biodistribution based on the fluorescence intensity, the validation of this method in a variety of tissues has not yet been studied systematically. Here, we investigated the biodistribution of LCP NPs containing oligonucleotides using three different probes: 1) Texas Red labeled oligonucleotides; 2) 3H-labeled oligonucleotides; and 3) 111In, which can form co-precipitate with calcium phosphate, and was used as a radiotracer for the intact LCP NPs. LCP contains an amorphous calcium phosphate precipitate core wrapped with a single lipid bilayer with surface modification of polyethylene glycol with and without a targeting ligand (8). The NP formulation has been successfully used to deliver siRNA (8,12) and cDNA (unpublished results) to both solid and metastatic tumors. Our results showed a discrepancy between the radioactivity and the fluorescence signals. Signals from 3H and 111In exhibit very similar distribution patterns, suggesting that liver and spleen were the major accumulation sites. However, fluorescence imaging indicated that tumor accumulation was predominant. Furthermore, we found that the fluorescence signals in both liver and spleen are greatly attenuated compared with those in tumor due to the intrinsic tissue absorption and light scattering. Therefore, careful attention must be paid to the quantification and interpretation of fluorescence imaging measurements, which could skew the data towards the tissues with less light absorption and scattering.
MATERIALS AND METHODS
The Preparation of LCP NPs
22-mer oligonucleotides (sense sequence, 5′-CAAGG-GACTGGAAGGCTGGG-3′) labeled with Texas Red or Cy5.5 Dye (excitation/emission wavelengths of 550/600 nm and 650/700 nm, respectively), were purchased from Sigma, Inc. 3H labeling of oligonucleotides was prepared by hydrogen exchange with 3H2O at the C8 positions of purine oligonucleotides as described by Graham et al. (13). The radiolabeled compound has been demonstrated to be stable in biological systems.
LCP NPs were prepared according to the method described previously with minor modifications (8). Briefly, we first prepared two water-in-oil microemulsions: 1) 100 μL of 500 mM CaCl2 and 16 μL of 2 mg/mL Texas Red or 3H-labeled oligonucleotides in 8 mL cyclohexane oil phase (71% cyclohexane with 29% Igepal CO-520 as surfactant); 2) 100 μL of 100 mM pH 9.0 Na2HPO4 also in 8 mL cyclohexane oil phase plus 320 μL of 20 mM dioleoylphosphatydic acid (DOPA) as the inner leaflet lipid. For 111In-loaded nanoparticles, radioactive InCl3 (in 0.05 N HCl, PerkinElmer, Inc.) was added to the CaCl2 microemulsion, as a sufficient amount of 0.05 N NaOH was added to the Na2HPO4 microemulsions to neutralize the acid. After mixing the above two solutions for 45 min, 30 mL of absolute ethanol was added to the micro-emulsion and the mixture was centrifuged at 12,500 g for 15 min to precipitate the CaP (or CaP/In) core. After being extensively washed with ethanol 2–3 times, the pellets were dispersed in 500 μL chloroform and stored in a glass vial for further modification. For outer leaflet lipid coating, 200 μL of 20 mM cholesterol, 200 μL of 20 mM dioleoylphosphatidylcholine (DOPC), and 100 μL of 20 mM of 1,2-distearoyl-sn-glycero-3-phosphoethanolamine-N-[poly(ethylene glycol)2000] (DSPE-PEG2000) were mixed with the core. After removal of the chloroform, the core was first suspended in small volume of ethanol, and then dispersed in aqueous solution containing 5% dextrose.
Biodistribution Study of LCP NPs
All animal work was performed in accordance with and approved by the University of North Carolina Institutional Animal Care and Use Committee guidelines. Athymic nude (nu/nu) mice carrying H460 human lung cancer xenografts were used for all of the experiments. Labeled LCP NPs at a dose of 0.25 mg/kg of oligonucleotides were intravenously injected into the mice. Four hours later, mice were sacrificed and tissues of interest were collected for further analysis. Fluorescent images were acquired under the IVIS Imaging System (Xenogen Imaging Technologies, Alameda, CA) at indicated wavelengths. The amounts of 3H-labeled oligonucleotides and 111In that accumulated in different tissues were quantified using liquid scintillation and gamma counting, respectively.
Fluorescence Intensity Measurement in Different Tissues
Un-injected animals were euthanized and whole blood was collected using cardiac puncture. Liver, spleen and tumor were also harvested. To measure the fluorescence intensity in whole organs, 0.25 μg of Texas Red labeled oligonucleotides were directly injected into mouse liver, spleen and tumor, respectively, using a Hamilton syringe. To measure the fluorescence intensity in tissue homogenate, tissue samples were weighed and placed in homogenization buffer (10 mM Tris pH 7.4 and 0.5% Triton X-100) at a ratio of 100 mg of tissue per mL. 100 μL of whole blood, tissue homogenate and homogenization buffer were then transferred to a 96 well plate. Ten μL of homogenization buffer containing various amounts of Texas Red oligonucleotides were added. The tissues and plate were then imaged using an IVIS Imaging System as described above. The plate was also measured by a plate reader (Bioscan Inc., Washington DC) for the fluorescence intensity to create standard curves.
To prepare the perfused liver, un-injected animals were euthanized and 3 mL of warm PBS was perfused via portal vein through the liver to expel the blood. The perfusion rate was kept at about 3 mL/min. Texas Red-labeled oligonucleotides (0.5 μg) were directly injected into non-perfused liver, perfused liver and tumor, respectively. The tissues were then imaged using Kodak In Vivo Imaging System FX Pro (Carestream Health, Woodbridge, CT) at indicated wavelengths.
RESULTS
We investigated the biodistribution of LCP NPs in tumor-bearing mice using Texas Red, 3H and 111In labeling. 3H labeling revealed that significant accumulation of the nanoparticles occurred in the liver (30% ID) and the spleen (15% ID), while only 5% ID was found in the tumor (Fig. 1a). Consistent with 3H data, around 20% ID and 15% ID of 111In were found in the liver and the spleen, respectively (Fig. 1b). Less than 5% ID was seen in the tumor. The agreement between the label of the drug (3H-oligonucleotides) and that of the drug carrier (111In) suggested that this biodistribution pattern may accurately represent the in vivo behavior of LCP NPs. However, as shown in Fig. 1c, significant fluorescence signal could be detected in the tumor, while the brightness of liver and spleen remained just above the background level. To test whether fluorescence intensity of labeled oligonucleotides is subjected to the microenvironment in which they reside, liver, spleen and tumor were dissected from un-injected animals and directly injected with fluorescence-labeled oligonucleotides. The ex vivo fluorescence imaging is shown in Fig. 2a. Minimal signals were detected in the liver and the spleen. In contrast, tumor lit up significantly. These results suggested that tissue components in the liver and the spleen strongly quenched the fluorescence signal. Whole blood and tissue homogenate were then used to study the fluorescence signal linearity and quenching effect in different organs. As Fig. 2b shows, when equal amounts of Texas Red-labeled oligonucleotides were added, the intensities in tumor homogenate and buffer were higher than those in whole blood, liver and spleen homogenates. By adding 15 μl of whole blood to 100 μl of tumor homogenate, the fluorescent signal was greatly attenuated. These results suggested that blood played an important role in quenching Texas Red signals from tissues, which is understandable because hemoglobin has its secondary absorption peak between 550 nm and 600 nm. And thereby the sensitivity of Texas Red probe could be greatly hampered in blood-enriched tissues such as liver and spleen. Using the liver perfusion technique, the role of blood hemoglobin in quenching Texas Red signal was further elucidated. The result was shown in Fig. 2c. As the perfused mouse liver contained less blood, when injected with the same amount of Texas Red-labeled oligonucleotides, it emitted stronger fluorescence than the non-perfused liver. We further demonstrated that a similar problem also existed in a NIR probe. With equal amounts of Cy5.5 dye, the intensities in tumor homogenate and buffer were higher than those in whole blood and liver homogenate (Fig. 3). These differences should be taken into account in the quantitative analysis of biodistribution data. Texas Red-labeled oligonucleotides exhibited reasonable linearity in each tissue homogenate, including liver, spleen and tumor, but the attenuation coefficient of these tissues (the slopes of the lines in Fig. 4) were dramatically different. While quantitative comparison in a tissue-specific manner is valid (e.g. liver vs. liver, tumor vs. tumor), it is not appropriate to measure the accumulated amount of the dose by comparing fluorescence intensity between different tissues.
Fig. 1.
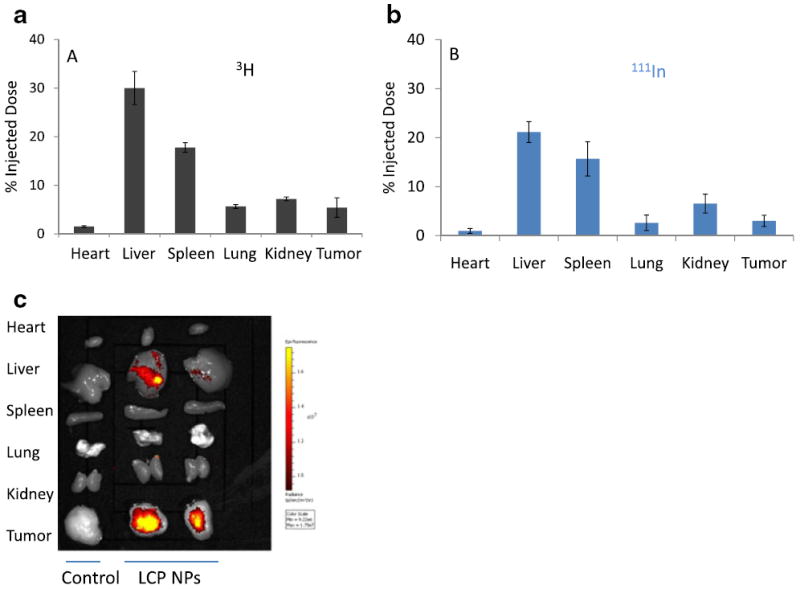
Biodistribution of LCP nanoparticles in tumor-bearing mice detected by (a) 3H, (b) 111Indium, and (c) fluorescence (Texas Red) signals.
Fig. 2.
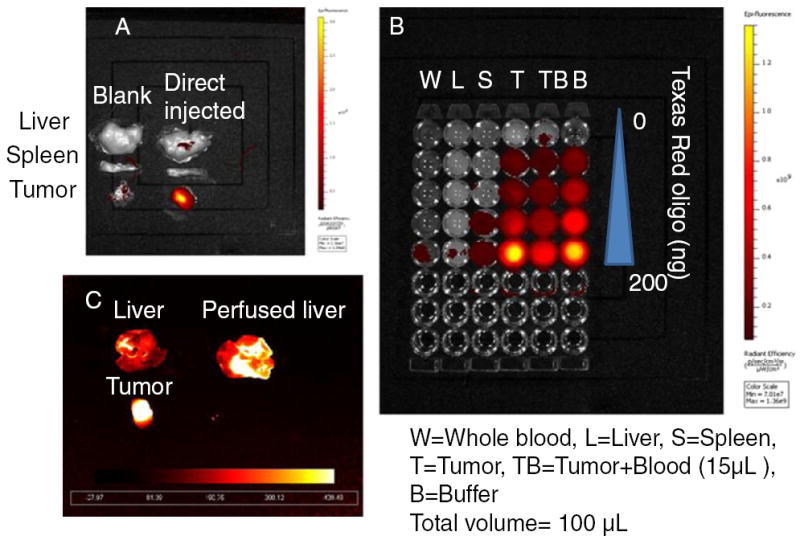
Measured fluorescence intensity of Texas Red in (a) whole organs, (b) tissue homogenate and (c) perfused liver (excitation/emission wavelengths: 550/600 nm).
Fig. 3.
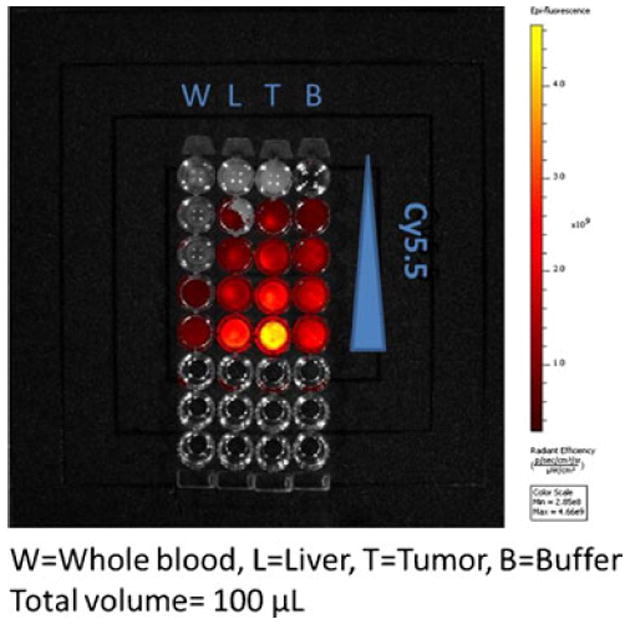
Measured fluorescence intensity of Cy5.5 in tissue homogenate (excitation/emission wavelengths: 650/700 nm).
Fig. 4.
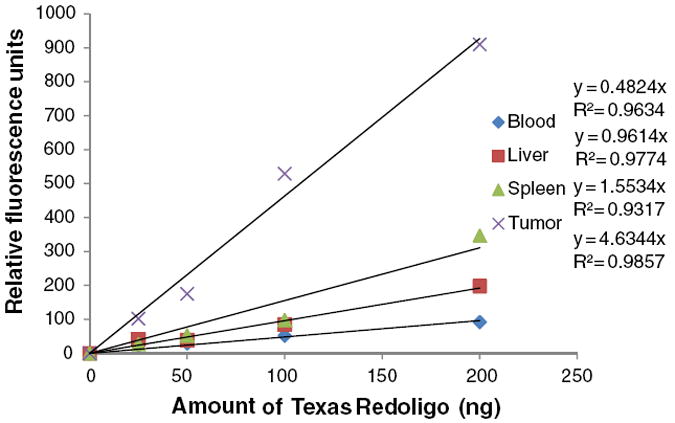
Standard curve generated by quantifying the intensities of known concentrations of oligonucleotides (excitation/emission wavelengths: 550/600 nm).
DISCUSSION
Fluorescence labeling of macromolecules has played a major role in biomedical research. It is desirable because of its high sensitivity, excellent spatial and temporal resolutions, and the capability for multimodality imaging. It extends our ability to track a particular molecular, cellular, or even physiological event by noninvasive visualization and measurement within the in vivo context. In spite of the many advantages offered by fluorescence imaging, it also presents serious challenges. Issues in fluorescence imaging in tissue are auto fluorescence, light absorption, and light scattering. NIR dyes generate less background fluorescence, since auto fluorescence in tissues is mostly excited by near ultraviolet and blue light and emits in the yellow range (14). Moreover, it has been demonstrated that use of red and NIR probes increases the depth of penetration in mammalian tissues by several orders of magnitude by avoiding the major absorption regions of hemoglobin. However, it is note-worthy that hemoglobin exhibits a broad absorption band. Even though the absorption of hemoglobin is much less intense in the NIR region, its contribution (in particular, by oxyhemoglobin) to the total light attenuation is certainly not negligible for quantitative purpose. Scattering has a weak dependence on wavelength. It arises due to a different relative refractive index at the boundaries between two different structures, such as the extracellular fluid and the cell membrane. Tissues vary greatly in size, component and microstructure; they are optically inhomogeneous. Given the larger size and increased hemoglobin content in the liver and the spleen, it is expected that the light signal would be greatly reduced. These differences may also be attributed to the light absorption by other tissue constituents and to light scattering by lipid membranes and cell fragments. When using fluorescence intensity in optically inhomogeneous samples for quantitative purposes, careful method development and validation should be performed.
In conclusion, although fluorescence imaging confers certain advantages for convenient biodistribution studies, it still suffers from the fact that the quantitative data from whole organs is dramatically affected by the scattering and the absorption properties of the organ. The fluorescence intensity detected by fluorescence imaging is not necessarily proportional to the number of molecules present. Fluorescence imaging is very practical and informative in initial experiments to demonstrate the whole-body distribution, unfortunately it yields only qualitative and semi-quantitative images due to artifacts from tissue heterogeneities. To study the biodistribution of macromolecules quantitatively, methods such as radiotracing or mass spectrometry should be considered.
Acknowledgments
This work was supported by NIH grants CA129835, CA129421, CA151652, CA151455 and CA149363. We thank Dr. Hong Yuan for helpful discussion and Ms. Bethany DiPrete for manuscript editing.
References
- 1.Juliano R. Challenges to macromolecular drug delivery. Biochem Soc Trans. 2007;35(Pt 1):41–3. doi: 10.1042/BST0350041. Epub 2007/01/20. [DOI] [PubMed] [Google Scholar]
- 2.Agrawal S, Temsamani J, Tang JY. Pharmacokinetics, biodistribution, and stability of oligodeoxynucleotide phosphorothioates in mice. Proc Nat Acad Sci USA. 1991;88(17):7595–9. doi: 10.1073/pnas.88.17.7595. Epub 1991/ 09/01. [DOI] [PMC free article] [PubMed] [Google Scholar]
- 3.Nakada Y, Fattal E, Foulquier M, Couvreur P. Pharmacokinetics and biodistribution of oligonucleotide adsorbed onto poly(isobutylcyanoacrylate) nanoparticles after intravenous administration in mice. Pharm Res. 1996;13(1):38–43. doi: 10.1023/a:1016017014573. Epub 1996/01/01. [DOI] [PubMed] [Google Scholar]
- 4.Beverly MB. Applications of mass spectrometry to the study of siRNA. Mass Spectrom Rev. 30(6):979–98. doi: 10.1002/mas.20260. Epub 2010/03/05. [DOI] [PubMed] [Google Scholar]
- 5.Chen G, Warrack BM, Goodenough AK, Wei H, Wang-Iverson DB, Tymiak AA. Characterization of protein therapeutics by mass spectrometry: recent developments and future directions. Drug discovery today. 2011;16(1-2):58–64. doi: 10.1016/j.drudis.2010.11.003. Epub 2010/11/26. [DOI] [PubMed] [Google Scholar]
- 6.Frangioni JV. In vivo near-infrared fluorescence imaging. Curr Opin Chem Biol. 2003;7(5):626–34. doi: 10.1016/j.cbpa.2003.08.007. Epub 2003/10/29. [DOI] [PubMed] [Google Scholar]
- 7.Hilderbrand SA, Weissleder R. Near-infrared fluorescence: application to in vivo molecular imaging. Curr Opin Chem Biol. 14(1):71–9. doi: 10.1016/j.cbpa.2009.09.029. Epub 2009/11/03. [DOI] [PubMed] [Google Scholar]
- 8.Li J, Yang Y, Huang L. Calcium phosphate nanoparticles with an asymmetric lipid bilayer coating for siRNA delivery to the tumor. J Control Release. doi: 10.1016/j.jconrel.2011.10.020. Epub 2011/11/08. [DOI] [PMC free article] [PubMed] [Google Scholar]
- 9.Mackiewicz N, Gravel E, Garofalakis A, Ogier J, John J, Dupont DM, et al. Tumor-targeted polydiacetylenemicelles for in vivo imaging and drug delivery. Small. 2011;7(19):2786–92. doi: 10.1002/smll.201100212. Epub 2011/08/13. [DOI] [PubMed] [Google Scholar]
- 10.Abdelmawla S, Guo S, Zhang L, Pulukuri SM, Patankar P, Conley P, et al. Pharmacological characterization of chemically synthesized monomeric phi29 pRNA nanoparticles for systemic delivery. Mol Ther: The Journal of the American Society of Gene Therapy. 2011;19(7):1312–22. doi: 10.1038/mt.2011.35. Epub 2011/04/07. [DOI] [PMC free article] [PubMed] [Google Scholar]
- 11.Goldberg MS, Xing D, Ren Y, Orsulic S, Bhatia SN, Sharp PA. Nanoparticle-mediated delivery of siRNA targeting Parp1 extends survival of mice bearing tumors derived from Brca1-deficient ovarian cancer cells. Proc Natl Acad Sci U S A. 2011;108(2):745–50. doi: 10.1073/pnas.1016538108. Epub 2010/12/29. [DOI] [PMC free article] [PubMed] [Google Scholar]
- 12.Yang Y, Li J, Liu F, Huang L. Systemic delivery of siRNA via LCP nanoparticle efficiently inhibits lung metastasis. Mol Ther: The Journal of the American Society of Gene Therapy. 2012;20(3):609–15. doi: 10.1038/mt.2011.270. Epub 2011/12/22. [DOI] [PMC free article] [PubMed] [Google Scholar]
- 13.Graham MJ, Freier SM, Crooke RM, Ecker DJ, Maslova RN, Lesnik EA. Tritium labeling of antisense oligonucleotides by exchange with tritiated water. Nucleic Acids Res. 1993;21(16):3737–43. doi: 10.1093/nar/21.16.3737. Epub 1993/08/11. [DOI] [PMC free article] [PubMed] [Google Scholar]
- 14.Ballou B, Ernst LA, Waggoner AS. Fluorescence imaging of tumors in vivo. Curr Med Chem. 2005;12(7):795–805. doi: 10.2174/0929867053507324. Epub 2005/04/28. [DOI] [PubMed] [Google Scholar]