

Abstract
Background and Purpose
To compare the diagnostic performance of arterial spin-labeled (ASL) and dynamic susceptibility contrast (DSC) perfusion in detection of cerebral blood flow (CBF) changes before and after endovascular recanalization in acute ischemic syndrome (AIS).
Methods
The inclusion criteria for this retrospective study were patients with AIS who underwent endovascular recanalization and acquisition of both ASL and DSC before and after revascularization. ASL CBF and multiparametric DSC maps were evaluated for image quality, location and type of perfusion abnormality. Relative CBF (rCBF) was calculated in the infarction core and hypoperfused areas using coregistered ASL and DSC. Core and hypoperfused rCBF were used for paired pre- and post-treatment comparisons. Interobserver and intermodality agreement were evaluated by Kappa test. T-test was calculated for ASL and DSC rCBF values.
Results
Twenty-five patients were met our inclusion criteria. Five studies were rated non-diagnostic, resulting in 45 pair of DSC-ASL available for comparison. ASL and DSC agreed on type and location of the perfusion abnormality in 71% and 80% of cases respectively. The image quality of ASL was lower than DSC, resulting in interobserver variability for the type (k =0.45) and location (k=0.56) of perfusion abnormality. ASL was unable to show any type of perfusion abnormality in 11% of patients. In successfully recanalized patients, hyperperfusion (rCBF> 1) was detected in 100% on DSC and 47% on ASL.
Conclusions
ASL is less sensitive than DSC for detection of rCBF changes in patients with AIS, particularly with respect to hyperperfusion after successful recanalization.
Keywords: acute stroke, brain ischemia, MR, MR perfusion, revascularization, reperfusion
Introduction
Several clinical trials have suggested that patients with a mismatch between their infarction volume and the volume of hypoperfused tissue may respond favorably to revascularization therapies 1-3. The identification of a perfusion-diffusion mismatch, although still controversial, has been the driving force behind the growth of MR perfusion imaging 1. Both DSC and ASL have been used for evaluation of cerebral perfusion in patients with stroke 4-5, each with different strengths and limitations 6-8. Recent technical advances have significantly improved the quality and acquisition speed of ASL techniques 9-10. In addition, recent concerns about gadolinium-induced nephrogenic systemic fibrosis in patients with extremely poor renal function 11 have resulted in renewed interest in ASL for the clinical evaluation of cerebral perfusion status in patients with acute ischemic syndrome (AIS). Several recent studies have shown that ASL can detect cerebral blood flow (CBF) alterations in the setting of acute stroke, many with concordant comparative analysis with DSC 7, 12-13. In this study, by selecting a unique population of patients with AIS we evaluate the performance of ASL for the detection of CBF changes before and after invasive recanalization by performing a qualitative and quantitative comparative analysis to DSC imaging performed concurrently.
Methods
Patients
Our HIPAA compliant retrospective study was performed with institutional review board (IRB) approval. Electronic medical record of patients with suspected AIS who presented to a single comprehensive stroke center inform September 2010 and March 2012 was reviewed. Twenty five consecutive patients who met our inclusion criteria were included in this study. Inclusion criteria included:
Acute onset of neurologic deficits meeting the standard eligibility criteria for invasive recanalization including intra-arterial tPA (< 6 hours) or clot retrieval (<9 hours) 14-16. For carotid dissection patients (n=4) recanalization was attempted regardless of the timing criteria.
Periprocedural MRI perfusion imaging acquired.
Absence of prior intracranial hemorrhage, brain surgery or large territorial infarction
The number of patients achieving recanalization, the type of recanalization using post-procedure angiography and the TICI scoring method 17, the baseline National Institutes of Health Stroke Scale scores (NIHSS), the median time from last known well to first MRI, the median time from first MRI to groin puncture, the median time from first MRI to 2nd posttreatment MRI, and the type of scanner used (3.0 or 1.5T) was documented for each patient.
Imaging Protocol
All patients underwent MRI on either a 1.5T (Siemens Avanto; Erlangen, Germany) or 3.0T (Siemens Trio; Erlangen, Germany) MR system. The imaging protocol included diffusion-weighted imaging (DWI), fluid attenuation inversion recovery imaging (FLAIR), gradient recalled echo (GRE), MR angiography, DSC and ASL perfusion-weighted imaging. DSC images were acquired using a gradient-echo echoplanar imaging (EPI) sequence with repetition time (TR) of 1.9 seconds (2.5 seconds for 1.5T), echo time (TE) of 30 msec (45 msec for 1.5T), field of view (FOV) of 22 cm, matrix size of 128 × 128, resulting in 26 slices with 5mm slice thickness. A GRAPPA factor of 2 was used for parallel acquisition resulting in a 2 minute scan time. During dynamic acquisition, a single dose of 0.1 mmol/kg of gadolinium contrast agent (Magnevist; Bayer Health Care Inc.; Pittsburgh, PA or Multihance; Bracco Diagnostics Inc.; Princeton, NJ) was injected at a rate of 5 mL/s. ASL perfusion scans were acquired using a pseudo-continuous (PCASL) pulse sequence with background suppression using a 3D GRASE (gradient and spin echo) readout, a 2 second post-labeling delay and a labeling pulse duration of 1.5 seconds, resulting in 30 pairs of tag and control images consisting of 26 total image slices, each 5mm thick. A matrix size of 64 × 64, FOV of 22cm, GRAPPA acceleration factor of 2, TR of 4 seconds, and TE of 22 msec was used. A similar acquisition scheme has been used in other published quantitative PCASL investigations 9-10, 12.
Data analysis
Post-processing
ASL data analysis was performed in house using the Interactive Data Language (IDL, Boulder, CO) software program. ASL images were motion corrected, pairwise subtracted between the tag and control images, and averaged to generate a mean difference image, ΔM. Quantitative cerebral blood flow (CBFASL) maps were calculated as follows 9, 18:
where R1a =0.72−1 sec (0.61sec−1 at 1.5T) is the longitudinal relaxation rate of blood, M0 is the equilibrium magnetization of brain tissue, α =0.8 is the tagging efficiency, τ =1.5sec is the duration of the labeling pulse, w =2sec is the post-labeling delay time and λ =0.9g/ml is blood/tissue water partition coefficient. Note that this equation assumes the labeled blood spins remain primarily in the vasculature rather than exchanging freely with tissue water, an assumption which is justified in patients with stroke with prolonged arterial transit times 19.
DSC images were processed using a commercially available FDA approved software (PerfScape/NeuroScape, Olea Medical SAS, France). DSC analysis consisted of the following steps: 1) truncation of the first five time points in the DSC time series, since the MR signal does not reach steady state before this time, 2) calculation of pre-bolus signal intensity on a voxel-wise basis, and then 3) conversion of truncated DSC time series to a concentration-time curve based on the T2* relaxivity of the contrast agent. The arterial input function was selected automatically by the perfusion software, and the rCBF was calculated using a block-circulant singular value decomposition technique 20. Parametric maps of CBF, time-to-peak (TTP), and Tmax were then exported from the software for subsequent analysis.
Quantitative image evaluation
DWI, DSC and ASL images for each patient were registered to a high-resolution (1.0 mm isotropic), T1-weighted brain atlas (MNI152; Montreal Neurological Institute) using a 12 degree of freedom transformation using a mutual information cost function. This was followed by visual inspection to ensure adequate alignment. To maintain consistency, we used quantitative values described in the literature to define the infarction core, defined as ADC value less than 550 × 10−6 mm 2/s 21-22. Likewise, regions of hypoperfusion were defined as Tmax greater than 4 seconds 23. These regions were also aligned with ASL and DSC images in MNI space through the same transformation matrices used for the DWI and ASL images, Subsequently, regions-of interest (ROIs) were placed over the infarction core and hypoperfused area to extract the corresponding ASL and DSC CBF values. ROIs were then mirrored onto the contralateral hemisphere and the ratio of rCBF within in the infarction core and hypoperfusion regions with respect to contralateral, normal appearing tissue were calculated using both ASL and DSC measurement techniques. Manual restriction of the ROIs was applied when necessary. The same process was repeated on the posttreatment scans using the fixed ROIs in MNI space to ensure evaluation of rCBF values in precisely the same regions in both pre and post treatment scans.
Qualitative image evaluation
The ASL-CBF maps and multiparametric perfusion maps from DSC studies were evaluated on a commercially available image viewer. The observers were able to adjust image contrast, select a viewing color scheme, and size of the images. Two experienced neuroradiologists blinded to treatment and clinical information, reviewed the ASL and DSC perfusion maps independently and in separate reading sessions. A three scale imaging score was used to evaluate the image quality with regards to susceptibility mediated distortion at tissue interfaces, noise, motion, and delineation of major structures such as the ventricles, thalami, BG, BS, and posterior fossa, with scoring as follows: 1: Poor image quality, not interpretable, 2: Fair but diagnostic image quality, some distortion and noise, limits detail delineation of major structures, and 3: Good image quality, no to minimal distortion with detailed delineation of all structures). In addition to image quality, the observers were asked to note the presence of hypo- and hyperperfusion, or both, when present. Identification of a perfusion abnormality was made from a collective analysis of the TTP, Tmax and CBF maps. A perfusion deficit was defined as an area with visually perceptible increased TTP and Tmax and decreased CBF on DSC maps, and with decreased perfusion signal on ASL when compared to the surrounding brain tissue and to the homologous contralateral hemisphere. Any hyperperfused region was defined as an area of visually perceptible decreased TTP and Tmax and increased CBF on DSC with increased perfusion signal on ASL. The observers were asked to localize the site of the perfusion abnormality into 2 possible categories: 1) Basal ganglia involved; 2) more distal MCA (Cortical and/or white matter without basal ganglia involvement. These data were used to determine interobserver agreement. The observers also noted the regions of delayed arterial arrival seen as surrounding serpiginous high signal on ASL images when present. Finally, and in a different reading session, any discrepancy in the qualitative scores of perfusion deficit with regards to the type and location of perfusion abnormality between the readers was resolved by consensus agreement. These scores were then used to perform comparative analysis between DSC and ASL.
Statistical Analysis
Statistical analysis was performed using MedCalc (Version 12.2.1, MedCalc Software, Broekstraat 52, 9030 Mariakerke, Belgium). The Wilcoxon signed-rank test was used to compare the mean ratings of ASL and DSC perfusion maps. The weighted kappa test was used to evaluate the interobserver and intermodality agreement. The T-test was calculated for the quantitative values of rCBF on both the ASL and DSC perfusion maps. The significance level was defined as P<0.05 (2-sided).
Results
A total of 25 patients (15 men) with a mean age of 63.5 years (range: 19-82) met our inclusion criteria. All patients had evidence of large arterial steno-occlusive disease including (1) carotid-T occlusion (n=6); (2) M1 occlusion (n=12); (3) M2 occlusion (n=3); and (4) occlusive carotid dissection (n=4). The therapeutic procedures for these patients included: (1) Mechanical clot retrieval (n=16); (2) intra-arterial tPA (n=5); and (3) stent placement for carotid dissection (n=4). A total of 17 patients (68%) achieved adequate recanalization as defined by a TICI ≥2a score and as confirmed by postprocedural angiography, including TICI 3 (n=6, 24%), TICI 2b (n=8, 32%) and TICI 2a (n=4, 16%). National Institutes of Health Stroke Scale scores at baseline ranged from 3 to 27 with a median of 16. The median time from last well known to first MRI was 5 hours (range: 1-8.9 hours). The median time from first MRI to groin puncture was 60.4 minutes (range: 25 to 303 minutes). The median time from first MRI to 2nd posttreatment MRI was 7 hours (range: 2.3 to 11.4 hours).
Qualitative analysis
Five studies (10%) were deemed non-diagnostic including 3 ASL (6%) studies with motion and significant ASL border zone artifacts and 2 DSC (4%) examinations with susceptibility and motion artifacts, leaving a total of 45 pair of ASL-DSC studies for both qualitative and quantitative analysis. The overall image quality scores for DSC examinations were 3, 2-3 (median ± range), without a significant difference between the observers (p=0.9). The image quality scores for ASL studies were 2, 2-3 (median ± range) for both observers, without a significant difference between the observers (p=0.4). The lower image quality of ASL has resulted in some interobserver variability (k=0.6) in comparison to DSC (k=0.95). Qualitative analysis with interobserver assessment for DSC and ASL examinations is detailed in Supplemental Table 1 and 2 respectively (http://stroke.ahajournals.org).
Using consensus scores between two observers, a direct intermodality comparison was performed between the ASL and DSC for image quality, type and location of perfusion abnormality (Table 1). The image quality of ASL, although diagnostic, was rated significantly lower than DSC for both pre (p=0.04) and posttreatment (p=0.005) groups. The median of image quality scores was significantly higher for DSC (p=0.001). All DSC studies in the pre and posttreatment scans were able to detect a perfusion abnormality.
Table-1.
Comparison of Qualitative evaluation of ASL vs DSC data
| Image quality (Median, Range) |
Perfusion abnormality | Location | |
|---|---|---|---|
| Pretreatment (n=20) | |||
| DSC | 3, 2-3 | Hypoperfusion n= 18 Both hypo & hyperperfusion n= 2 |
BG n=16 No BG n=4 |
| ASL | 2, 2-3 | Hypoperfusion n= 15 Both hypo & hyperperfusion n= 4 No perfusion defect n=1 |
BG n=12 No BG n=7 |
| p-value (Wilcoxon) |
0.04 | 0.9 | 0.36 |
| K value | 0.3 | 0.76 | K=0.56 |
|
| |||
| Posttreatment (n=25) | |||
| DSC | 3, 2-3 | Hypoperfusion n= 6 Both hypo & hyperperfusion n= 12 Hyperperfusion n= 7 |
BG n=18 No BG n=7 |
| ASL | 2, 2-3 | Hypoperfusion n= 12 Both hypo & hyperperfusion n= 4 Hyperperfusion n= 5 No perfusion defect n=4 |
BG n=12 No BG n=9 |
| p-value (Wilcoxon) |
0.005 | 0.02 | 0.48 |
| K value | 0.1 | 0.4 | K=0.56 |
All recanalized patients (n=17) demonstrated evidence of luxury perfusion whether pure hyperperfusion (n=7) or a combination of both hypo and hyperperfusion (n=10). All patients demonstrating persistent hypoperfusion on post-treatment imaging were non-recanalized, while two additional non-recanalized patients demonstrated a combination of hypo and hyperperfusion. ASL and DSC agreed on type of perfusion abnormality present in 32 of 45 cases (71%) with overall intermodality agreement of k=0.458 (Table-2). Among disagreements, 5 cases (11%) with the hypo and hyperperfusion pattern identified by DSC appeared as only hypoperfusion on ASL imaging. Further, ASL imaging did not show any type of perfusion abnormality in an additional 5 cases (11%), which were evaluated as abnormal by DSC (Figure-1).
Table-2.
Agreement between ASL and DSC for determination of perfusion abnormality (n= 45) Weighted Kappa = 0.458
| DSC | |||||
|---|---|---|---|---|---|
| ASL | Hypoperfusion | Hyperperfusion | Both hypo and hyperperfusion |
No perfusion abnormality |
Total |
|
|
|||||
| Hypoperfusion | 21 | 1 | 5 | 0 | 27 (60%) |
| Hyperperfusion | 0 | 4 | 1 | 0 | 5 (11.1%) |
| Both hypo and hyperperfusion |
1 | 0 | 7 | 0 | 8 (17.8%) |
| No perfusion abnormality |
2 | 2 | 1 | 0 | 5 (11.1%) |
| Total | 24 (53.3%) | 7 (15.6%) | 14 (31.1%) | 0 | 45(100%) |
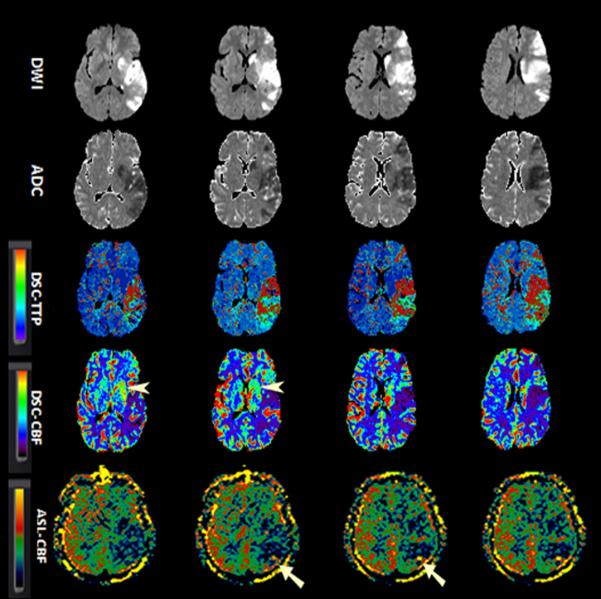
Figure-1.


A 38-year-old man with history of progressive left-sided weakness and facial droop. Concurrent MRA showed right ICA dissection (not shown). Baseline NIHSS=15. Patient successfully recanalized (TICI 3) after endovascular treatment with stent placement. Serial aligned DWI, ADC, DSC-TTP, DSC-CBF and ASL images before (1a) and after (1b) endovascular treatment.
A. Diffusion images show scattered foci of acute infarction in the right cerebral hemisphere with predominant watershed distribution. A large area of Hypoperfusion is seen on DSC-TTP, DSC-CBF and ASL-CBF maps involving the right ACA and MCA territories.
B. After recanalization, the areas of infarct remained unchanged. Luxury perfusion is seen on DSC-TTP and DSC-CBF (arrows), although not clearly seen on ASL.
ADC, apparent diffusion coefficient; ASL, arterial spin labeling; CBF, cerebral blood flow; DSC, dynamic susceptibility contrast-enhanced; DWI, diffusion-weighted imaging; ICA; MRA, MR angiography; NIHSS, National Institutes of Health Stroke Scale internal carotid artery; TICI, thrombolysis in cerebral infarction score; TTP, time-to-peak.
In terms of location of perfusion abnormality, ASL agreed with DSC in identification of the location of the perfusion abnormality in 31 of 40 patients (68%) including 23 patients with involvement of basal ganglia, and 8 patients without basal ganglia involvement. However ASL failed to demonstrate the presence of a confirmed perfusion abnormality in the BG in 9 patients (20%) (Figure-2) resulting in an intermodality agreement of only k=0.556. In another five patients where ASL unable to detect a perfusion abnormality, the distribution of perfusion deficits involved the basal ganglia in four cases and no basal ganglia involvement in the other. The delayed arterial transients effect was noted in 10 of 17 (58%) of successfully recanalized patients. Twenty-three studies were performed on a 3.0T scanner and twenty two on a 1.5 T MR scanner.
Figure-2.

A 52-year-old man with sudden onset right-sided weakness and global aphasia. Baseline NIHSS= 20. Due to absence of clinical response to IV tPA and M1 occlusion on concurrent MRA (not shown), patient underwent clot retrieval with final TICI score of 2a.
Serial aligned DWI, ADC, DSC-TTP, DSC-CBF and ASL images before (1a) and after (1b) endovascular treatment.
A. There is a left MCA territorial infraction. DSC-TTP and DSC-CBF show a larger area of hypoperfusion involving both cerebral cortex and basal ganglia (arrow heads). ASL-CBF maps demonstrate hypoperfusion involving the posterior left MCA territory, although involvement of basal ganglia is not seen.
B. After revascularization, the areas of infarct remained unchanged. DSC maps show a heterogeneous pattern of perfusion deficit containing both hypo and hyperperfusion with luxury perfusion in the left basal ganglia (arrowheads). The luxury perfusion in the basal ganglia is not well appreciated on ASL-CBF maps. There is suggestion of minimal increased collateral flow and delayed transient effects (straight arrows). The rCBF values in the hypoperfused region for DSC and ASL were 0.8 and 0.5 in pretreatment and 1.5 and 0.8 after treatment respectively.
ADC, apparent diffusion coefficient; ASL, arterial spin labeling; CBF, cerebral blood flow; DSC, dynamic susceptibility contrast-enhanced; DWI, diffusion-weighted imaging; ICA; MRA, MR angiography; NIHSS, National Institutes of Health Stroke Scale internal carotid artery; TICI, thrombolysis in cerebral infarction score; TTP, time-to-peak.
There was no significant difference between the image quality of DSC studies acquired at 3 T versus 1.5 T (p=0.4). The image quality of ASL images acquired on 3 T was slightly higher than images acquired on 1.5 T, although did not reach statistical significance (p=0.09).
Quantitative analysis
The quantitative rCBF values in pretreatment and posttreatment groups using both ASL and DSC are summarized in Table-3.
Table-3.
Quantitative evaluation of rCBF on ASL and DSC
| Patient Type | Pretreatment | Posttreatment | |||
|---|---|---|---|---|---|
|
|
|||||
| Technique and Statistic |
Infarction core |
Hypoperfusion | Infarction core |
Hypoperfusion | |
|
|
|||||
| All patients | DSC (Mean ± SD) |
0.48 ± 0.31 |
0.76 ± 0.47 | 0.95 ± 0.51 |
1.16 ± 0.45 |
| ASL (Mean ± SD) |
0.52 ± 0.35 |
0.57 ± 0.27 | 0.91 ± 0.46 |
0.92 ± 0.43 | |
| t-test, p | 0.64 | 0.09 | 0.76 | 0.07 | |
|
|
|||||
| Recanalized | DSC (Mean ± SD) |
0.46 ± 0.15 |
0.82 ± 0.36 | 1.21 ± 0.48 |
1.43 ± 0.31 |
| ASL (Mean ± SD) |
0.56 ± 0.41 |
0.65 ± 0.27 | 1.05 ± 0.37 |
1.11 ± 0.36 | |
| t-test, p | 0.35 | 0.23 | 0.29 | 0.01 (95%CI: 0.07-0.54) |
|
|
|
|||||
| Non- recanalized |
DSC (Mean ± SD) |
0.53 ± 0.25 |
0.64 ± 0.30 | 0.39 ± 0.27 |
0.60 ± 0.25 |
| ASL (Mean ± SD) |
0.45 ± 0.19 |
0.42 ± 0.22 | 0.59 ± 0.49 |
0.53 ± 0.28 | |
| t-test, p | 0.74 | 0.11 | 0.39 | 0.55 | |
Pretreatment studies
Both ASL and DSC demonstrated decreased rCBF without a statistically significant difference between modalities within the infraction core (0.48 ± 0.31 DSC vs 0.52 ± 0.35 ASL, P=0.64) and hypoperfused area (0.76 ± 0.47 DSC 0.57 ± 0.27 ASL, P=0.09). Hyperperfusion (rCBF >1) was detected by DSC in 3 cases within the hypoperfused area and by ASL in 3 cases (one within the infarction core and the others within the hypoperfused area). An important observation in the pretreatment group was the ability of DSC to demonstrate a significant difference in rCBF within the penumbral hypoperfused area as compared to the infarction core (p=0.0001). This difference did not reach statistical significance for ASL (p=0.54) (Table 3).
Posttreatment studies
Following recanalization, both ASL and DSC demonstrated overall increases rCBF (see Table-3). In non-recanalized patients, there was no significant increase in rCBF values between pre and posttreatment group in the infarction core or hypoperfused area (Table-3). In only one non-recanalized patient, hyperperfusion (rCBF >1) was detected within the infarction core by both ASL and DSC. In recanalized patients, there was a significant increase in rCBF values between pre and posttreatment scans by both ASL and DSC in the infarction core and hypoperfused area (Table-3). Similar to pretreatment studies, ASL was unable to demonstrate a significant difference in rCBF within the hypoperfused area in comparison to the infarction core (p=0.83), while this difference was significant on DSC (p=0.01). Although the difference in quantitative rCBF within the infarction core for DSC and ASL was not significant (p=0.29) in recanalized patients, increased rCBF measured within the hypoperfused area was significantly higher by DSC vs ASL (p=0.01). This can be explained by the fact that hypoperfused penumbral areas in all recanalized cases (n=17) demonstrated hyperperfusion (rCBF>1) on post-treatment DSC compared to only 8 cases (47%) on ASL. Post-treatment hyperperfusion was also detected within the infarction core in 9 cases by DSC compared to 6 cases by ASL.
Discussion
Both qualitative and quantitative changes of cerebral blood flow were generally concordant using ASL and DSC. Expected changes in rCBF in recanalized patients were detected by both modalities with moderate agreement. There are, however, some important limitations for ASL centered around the areas of image quality, sensitivity for the detection of hyperperfusion and demonstration of rCBF changes before and after intervention.
The image quality of ASL is significantly lower when compared to DSC, resulting in higher interobserver variability in terms of determination of the type and location of the perfusion abnormality when compared to DSC. We hypothesize that the lower image quality of ASL is related to known and inherent limitation of ASL, including its lower SNR and use of low imaging matrix. For optimization of ASL SNR, we incorporated many recent suggested strategies including the use pseudocontinuous labeling pulse sequence, background suppression, and optimized image readout 24, resulting in only modest gains vs. DSC. One major handicap of ASL is the current practical limitation to a matrix size of 64 × 64mm required for short acquisition time, which generally results in voxel sizes four times larger than those of DSC.
Second major finding of our results suggest that ASL in its current state is less sensitive in the detection of hyperperfusion in comparison to DSC. Although overall ASL agreed with DSC in the detection of the type of perfusion abnormality in 71% of cases, ASL failed to show any type of perfusion abnormality in 11% of patients. In addition, in 11% who exhibited both hypo and hyperperfusion on DSC imaging, ASL showed only Hypoperfusion. Quantitative analysis of the CBF in successfully recanalized patients showed significantly lower rCBF values in reperfused area in ASL and approximately half of cases demonstrated hyperperfusion (rCBF>1) on ASL in comparison to 100% on DSC. This was somewhat discrepant with the result of recent study by Wang et.al. which showed more promising comparison between the ASL and DSC CBF values in patients with acute stroke and in particular higher sensitivity for detection of hyperperfusion using ASL (12). Some differences between their results and ours may be explained by several factors: 1) In Wang et al. the described hyperperfusion pattern appears to be predominantly a heterogeneous pattern of CBF in patients with acute ischemic stroke, where hyperperfusion is thought to be the result of spontaneous recanalization. In contrast the main focus of our study is mechanically revascularized patients. We believe that the pathophysiology and cerebral hemodynamics in spontaneous recanalization (which frequently involves smaller distal arteries) are different from those that occur following the recanalization of large main arteries such as the internal carotid and proximal MCAs. The general kinetic model for accurate assessment of CBF using ASL is based on the assumption that there is complete exchange of labeled blood and tissue spins. However, this assumption may not hold in the latter group, where the rapid blood flow rate and luxury perfusion occurring after recanalization of major arteries can affect the performance of ASL 25. While the sensitivity to arterial transit delay in ASL perfusion MR can be minimized with a long postlabeling delay, the gain is compromised by the T1 relaxation of blood during this period. Although in this study a postlabeling delay of 2 seconds was used as a tradeoff between maintaining sufficient image quality while allowing adequate delay to detect cerebral perfusion, this may not be the optimal delay for detection of hyperperfusion. The use of different post-labeling delay times in the pre-treatment scan when the artery is occluded, versus the post-treatment scan after arterial recanalization, may be required in order to accurately evaluate the rCBF using ASL methods. An alternate approach is to obtain images using multiple post-labeling delays, thus effectively mapping the inflow of label into the tissue 26 in order to determine actual arrival times, and then to fit calculated CBF to kinetic models 27. 2) In Wang et al. absolute values of CBF were calculated for both ASL and DSC. We chose to use more conventional approach of using the relative cerebral blood flow (rCBF) values since the absolute quantification of CBF on DSC can be influenced by many confounding factors which can difficult to control 28-29. This is likely a significant source of discrepancy between their result and ours. 3) As with any other quantitative analysis, differences in results can be introduced through the use of different post-processing techniques and operators. The perfusion scale and algorithm used in their result are different from ours, which can explain some of the discrepancies.
Finally, the third major finding of our results suggests that ASL in its current state fails to show differences in rCBF within the infarction core versus hypoperfused regions in both pre and posttreatment groups. Again this can be explained by high dependency of ASL to arterial arrival time, which results in relative insensitivity to detect differences in rCBF in regions with variable transit delay when the transient delay is greater than post-labeling delay. In the other words, since the tagged blood won’t reach the capillary bed by the post-labeling delay time (2 seconds) in either the penumbral tissue (defined by Tmax >4 sec) or within the infarction core (where the Tmax can be greater than 10 seconds), ASL is unable to detect the differences in rCBF. Newer techniques, such as velocity-selective ASL 30, which is theoretically insensitive to arrival time, may help to address some of these limitations.
This study has several limitations, including 1) a relatively small sample size drawn from a single institution possibly introducing a size selection bias, 2) the sequential rather than simultaneous performance of DSC and ASL imaging possibly introducing an artifactual performance difference between both techniques that is due to temporal rather than performance factors, and 3) retrospective study design, possibly introducing unknown patient selection bias. In addition, DSC was assumed to be the comparative standard, possibly introducing a modality specific bias. These limitations were mitigated by confirmation of ischemia in every patient enrolled by catheter angiography and follow-up imaging, standardization of the optimized image acquisition parameters between the ASL and DSC imaging protocols, making DSC and ASL scanning immediately sequential, making group rather than individual comparisons, and maximizing sample size in this difficult and critically ill patient population.
Conclusion
ASL performs with moderate agreement to DSC in the evaluation of cerebral blood flow changes in patients with AIS before and after invasive recanalization. Qualitative and quantitative differences exist between two modalities, with ASL being less sensitive for detection of rCBF changes in patients with AIS in particular in respect to detection of hyperperfusion in successfully recanalized patients. Knowledge of these limitations is helpful for clinicians to interpret these studies with caution and highlights the need for further research and optimization of the ASL technique before it can be incorporated as major perfusion imaging modality in the acute setting.
Supplementary Material
Sources of Funding
None
Footnotes
Disclosures: None
This is a PDF file of an unedited manuscript that has been accepted for publication. As a service to our customers we are providing this early version of the manuscript. The manuscript will undergo copyediting, typesetting, and review of the resulting proof before it is published in its final citable form. Please note that during the production process errors may be discovered which could affect the content, and all legal disclaimers that apply to the journal pertain.
References
- 1.Albers GW, Thijs VN, Wechsler L, Kemp S, Schlaug G, Skalabrin E, et al. Magnetic resonance imaging profiles predict clinical response to early reperfusion: The diffusion and perfusion imaging evaluation for understanding stroke evolution (defuse) study. Ann Neurol. 2006;60:508–517. doi: 10.1002/ana.20976. [DOI] [PubMed] [Google Scholar]
- 2.Davis SM, Donnan GA, Parsons MW, Levi C, Butcher KS, Peeters A, et al. Effects of alteplase beyond 3 h after stroke in the echoplanar imaging thrombolytic evaluation trial (epithet): A placebo-controlled randomised trial. Lancet Neurol. 2008;7:299–309. doi: 10.1016/S1474-4422(08)70044-9. [DOI] [PubMed] [Google Scholar]
- 3.Hacke W, Albers G, Al-Rawi Y, Bogousslavsky J, Davalos A, Eliasziw M, et al. The desmoteplase in acute ischemic stroke trial (dias): A phase ii mri-based 9-hour window acute stroke thrombolysis trial with intravenous desmoteplase. Stroke. 2005;36:66–73. doi: 10.1161/01.STR.0000149938.08731.2c. [DOI] [PubMed] [Google Scholar]
- 4.Sorensen AG, Buonanno FS, Gonzalez RG, Schwamm LH, Lev MH, Huang-Hellinger FR, et al. Hyperacute stroke: Evaluation with combined multisection diffusion-weighted and hemodynamically weighted echo-planar mr imaging. Radiology. 1996;199:391–401. doi: 10.1148/radiology.199.2.8668784. [DOI] [PubMed] [Google Scholar]
- 5.Siewert B, Schlaug G, Edelman RR, Warach S. Comparison of epistar and t2*-weighted gadolinium-enhanced perfusion imaging in patients with acute cerebral ischemia. Neurology. 1997;48:673–679. doi: 10.1212/wnl.48.3.673. [DOI] [PubMed] [Google Scholar]
- 6.Detre JA, Leigh JS, Williams DS, Koretsky AP. Perfusion imaging. Magn Reson Med. 1992;23:37–45. doi: 10.1002/mrm.1910230106. [DOI] [PubMed] [Google Scholar]
- 7.Wolf RL, Alsop DC, McGarvey ML, Maldjian JA, Wang J, Detre JA. Susceptibility contrast and arterial spin labeled perfusion mri in cerebrovascular disease. J Neuroimaging. 2003;13:17–27. [PubMed] [Google Scholar]
- 8.Smith AM, Grandin CB, Duprez T, Mataigne F, Cosnard G. Whole brain quantitative cbf and cbv measurements using mri bolus tracking: Comparison of methodologies. Magn Reson Med. 2000;43:559–564. doi: 10.1002/(sici)1522-2594(200004)43:4<559::aid-mrm10>3.0.co;2-n. [DOI] [PubMed] [Google Scholar]
- 9.Wu WC, Fernandez-Seara M, Detre JA, Wehrli FW, Wang J. A theoretical and experimental investigation of the tagging efficiency of pseudocontinuous arterial spin labeling. Magn Reson Med. 2007;58:1020–1027. doi: 10.1002/mrm.21403. [DOI] [PubMed] [Google Scholar]
- 10.Fernandez-Seara MA, Edlow BL, Hoang A, Wang J, Feinberg DA, Detre JA. Minimizing acquisition time of arterial spin labeling at 3t. Magn Reson Med. 2008;59:1467–1471. doi: 10.1002/mrm.21633. [DOI] [PubMed] [Google Scholar]
- 11.Kanal E, Barkovich AJ, Bell C, Borgstede JP, Bradley WG, Jr., Froelich JW, et al. Acr guidance document for safe mr practices: 2007. AJR Am J Roentgenol. 2007;188:1447–1474. doi: 10.2214/AJR.06.1616. [DOI] [PubMed] [Google Scholar]
- 12.Wang DJ, Alger JR, Qiao JX, Hao Q, Hou S, Fiaz R, et al. The value of arterial spin-labeled perfusion imaging in acute ischemic stroke: Comparison with dynamic susceptibility contrast-enhanced mri. Stroke. 2012;43:1018–1024. doi: 10.1161/STROKEAHA.111.631929. [DOI] [PMC free article] [PubMed] [Google Scholar]
- 13.Bokkers RP, Hernandez DA, Merino JG, Mirasol RV, van Osch MJ, Hendrikse J, et al. Whole-brain arterial spin labeling perfusion mri in patients with acute stroke. Stroke. 2012;43:1290–1294. doi: 10.1161/STROKEAHA.110.589234. [DOI] [PMC free article] [PubMed] [Google Scholar]
- 14.Furlan A, Higashida R, Wechsler L, Gent M, Rowley H, Kase C, et al. Intra-arterial prourokinase for acute ischemic stroke. The proact ii study: A randomized controlled trial. Prolyse in acute cerebral thromboembolism. Jama. 1999;282:2003–2011. doi: 10.1001/jama.282.21.2003. [DOI] [PubMed] [Google Scholar]
- 15.The penumbra pivotal stroke trial: Safety and effectiveness of a new generation of mechanical devices for clot removal in intracranial large vessel occlusive disease. Stroke. 2009;40:2761–2768. doi: 10.1161/STROKEAHA.108.544957. [DOI] [PubMed] [Google Scholar]
- 16.The interventional management of stroke (ims) ii study. Stroke. 2007;38:2127–2135. doi: 10.1161/STROKEAHA.107.483131. [DOI] [PubMed] [Google Scholar]
- 17.Higashida RT, Furlan AJ, Roberts H, Tomsick T, Connors B, Barr J, et al. Trial design and reporting standards for intra-arterial cerebral thrombolysis for acute ischemic stroke. Stroke. 2003;34:e109–137. doi: 10.1161/01.STR.0000082721.62796.09. [DOI] [PubMed] [Google Scholar]
- 18.Wang J, Zhang Y, Wolf RL, Roc AC, Alsop DC, Detre JA. Amplitude-modulated continuous arterial spin-labeling 3.0-t perfusion mr imaging with a single coil: Feasibility study. Radiology. 2005;235:218–228. doi: 10.1148/radiol.2351031663. [DOI] [PubMed] [Google Scholar]
- 19.Chalela JA, Alsop DC, Gonzalez-Atavales JB, Maldjian JA, Kasner SE, Detre JA. Magnetic resonance perfusion imaging in acute ischemic stroke using continuous arterial spin labeling. Stroke. 2000;31:680–687. doi: 10.1161/01.str.31.3.680. [DOI] [PubMed] [Google Scholar]
- 20.Wu O, Ostergaard L, Weisskoff RM, Benner T, Rosen BR, Sorensen AG. Tracer arrival timing-insensitive technique for estimating flow in mr perfusion-weighted imaging using singular value decomposition with a block-circulant deconvolution matrix. Magn Reson Med. 2003;50:164–174. doi: 10.1002/mrm.10522. [DOI] [PubMed] [Google Scholar]
- 21.Dardzinski BJ, Sotak CH, Fisher M, Hasegawa Y, Li L, Minematsu K. Apparent diffusion coefficient mapping of experimental focal cerebral ischemia using diffusion-weighted echo-planar imaging. Magn Reson Med. 1993;30:318–325. doi: 10.1002/mrm.1910300307. [DOI] [PubMed] [Google Scholar]
- 22.Schaefer PW, Hassankhani A, Putman C, Sorensen AG, Schwamm L, Koroshetz W, et al. Characterization and evolution of diffusion mr imaging abnormalities in stroke patients undergoing intra-arterial thrombolysis. AJNR Am J Neuroradiol. 2004;25:951–957. [PMC free article] [PubMed] [Google Scholar]
- 23.Olivot JM, Mlynash M, Zaharchuk G, Straka M, Bammer R, Schwartz N, et al. Perfusion mri (tmax and mtt) correlation with xenon ct cerebral blood flow in stroke patients. Neurology. 2009;72:1140–1145. doi: 10.1212/01.wnl.0000345372.49233.e3. [DOI] [PMC free article] [PubMed] [Google Scholar]
- 24.Dai W, Garcia D, de Bazelaire C, Alsop DC. Continuous flow-driven inversion for arterial spin labeling using pulsed radio frequency and gradient fields. Magn Reson Med. 2008;60:1488–1497. doi: 10.1002/mrm.21790. [DOI] [PMC free article] [PubMed] [Google Scholar]
- 25.St Lawrence KS, Frank JA, McLaughlin AC. Effect of restricted water exchange on cerebral blood flow values calculated with arterial spin tagging: A theoretical investigation. Magn Reson Med. 2000;44:440–449. doi: 10.1002/1522-2594(200009)44:3<440::aid-mrm15>3.0.co;2-6. [DOI] [PubMed] [Google Scholar]
- 26.Petersen ET, Lim T, Golay X. Model-free arterial spin labeling quantification approach for perfusion mri. Magn Reson Med. 2006;55:219–232. doi: 10.1002/mrm.20784. [DOI] [PubMed] [Google Scholar]
- 27.Buxton RB, Frank LR, Wong EC, Siewert B, Warach S, Edelman RR. A general kinetic model for quantitative perfusion imaging with arterial spin labeling. Magn Reson Med. 1998;40:383–396. doi: 10.1002/mrm.1910400308. [DOI] [PubMed] [Google Scholar]
- 28.Kiselev VG. On the theoretical basis of perfusion measurements by dynamic susceptibility contrast mri. Magn Reson Med. 2001;46:1113–1122. doi: 10.1002/mrm.1307. [DOI] [PubMed] [Google Scholar]
- 29.Jochimsen TH, Newbould RD, Skare ST, Clayton DB, Albers GW, Moseley ME, et al. Identifying systematic errors in quantitative dynamic-susceptibility contrast perfusion imaging by high-resolution multi-echo parallel epi. NMR Biomed. 2007;20:429–438. doi: 10.1002/nbm.1107. [DOI] [PMC free article] [PubMed] [Google Scholar]
- 30.Wong EC, Cronin M, Wu WC, Inglis B, Frank LR, Liu TT. Velocity-selective arterial spin labeling. Magn Reson Med. 2006;55:1334–1341. doi: 10.1002/mrm.20906. [DOI] [PubMed] [Google Scholar]
Associated Data
This section collects any data citations, data availability statements, or supplementary materials included in this article.