Summary
The OmpF porin from the Escherichia coli outer membrane folds into a trimer of β-barrel, each forming a wide aqueous pore allowing the passage of ions and small solutes. A long loop (L3) carrying multiple acidic residues folds into the β-barrel pore to form a narrow “constriction zone”. A strong and highly conserved charge asymmetry is observed at the constriction zone, with multiple basic residues attached to the wall of the β-barrel (Lys16, Arg42, Arg82 and Arg132) on one side, and multiple acidic residues of L3 (Asp107, Asp113, Glu117, Asp121, Asp126, Asp127) on the other side. Several computational studies have suggested that a strong transverse electric field could exist at the constriction zone as a result of such charge asymmetry, giving rise to separate permeation pathways for cations and anions. To examine this question, OmpF was expressed, purified and crystallized in the P63 space group and two different data sets were obtained at 2.6 Å and 3.0 Å resolution with K+ and Rb+, respectively. The Rb+ soaked crystals were collected at the rubidium anomalous wavelength of 0.8149 Å and cation positions were determined. A PEG molecule was observed in the pore region for both the K+ and Rb+ soaked crystals, where it is interacting with the loop L3. The results reveal the separate pathways of anions and cations across the constriction zone of the OmpF pore.
INTRODUCTION
OmpF porins are cation-selective aqueous pores found in the outer membrane (OM) of E. coli.1 Their main function is to facilitate the translocations of hydrophilic solutes with molecular mass up to 600 Da across the OM.2,3 Functionally, OmpF porins display only a weak preference for cations at moderate and high salt concentrations. However, they become highly cation selective at low concentrations.4,5,6,7 Structurally, OmpF porins are homotrimers formed by three hollow β-barrels consisting of 16 anti-parallel beta sheets.8 Each monomer exhibits a wide aqueous pore, narrowed by a loop called L3 (residues 103 to 134) folding into the barrel to form a constriction zone at about half-way through the membrane.8,9,10 Below the constriction zone, the width of the pore increases abruptly. The loop L3 carries many aspartic (107, 113, 121, 126, 127) and glutamic (117) acidic residues on one side of the constriction zone; one lysine (16) and three arginine side chains (42, 82 and 132) are clustered and stacked together on the opposite side to the constriction zone. Site-directed mutations of the two carboxylates and three arginine residues in the constriction zone and of adjacent residues imply a function of L3 in ionic conductance as well as colicin interactions.11,12,13,14
It has been suggested that the charge asymmetry in the constriction zone could give rise to a strong electric field, transverse to the pore axis, and that it could aid the permeation of dipolar solute sheets.6,8,15 Consistent with the concept of the strong transverse electric field, simulation studies using molecular dynamics (MD), Brownian dynamics (BD) and Poisson-Nernst-Planck (PNP) indicate that permeation could proceed via two well-separated pathways for the cations and anions inside OmpF.7,16 The separate pathways for K+ and Cl− extend in a screw-like fashion over the height of the β-barrel, but are most distinct at the constriction zone where the pore is the narrowest; K+ is close to Asp113 and Glu117 in L3 and Cl− is close to Arg42, Arg82, and Arg132.7,16 While the separated pathway for cations and anions has, so far, been supported by the computational studies, this intriguing feature has never been directly observed experimentally. Here, we report the first results from native and rubidium anomalous X-ray scattering data revealing the pathway of cations near the constriction zone of OmpF.
RESULTS
OmpF porin was crystallized in the P63 space group containing two monomers in the asymmetric unit, with crystallographic symmetry related positions fulfilling the trimeric structure. The crystals were grown with NaCl and subsequently soaked with KCl and RbCl, which are hereafter referred to as the “native” KCl-OmpF and RbCl-OmpF structures, respectively. The structures were solved using the molecular replacement method using the program Phaser17 implemented in the CCP4 suite.18 The structure PDB id 2OMF8 was used as starting model. Each monomer consists of 16 anti-parallel β strands as previously determined.8
Native KCl-OmpF Structure
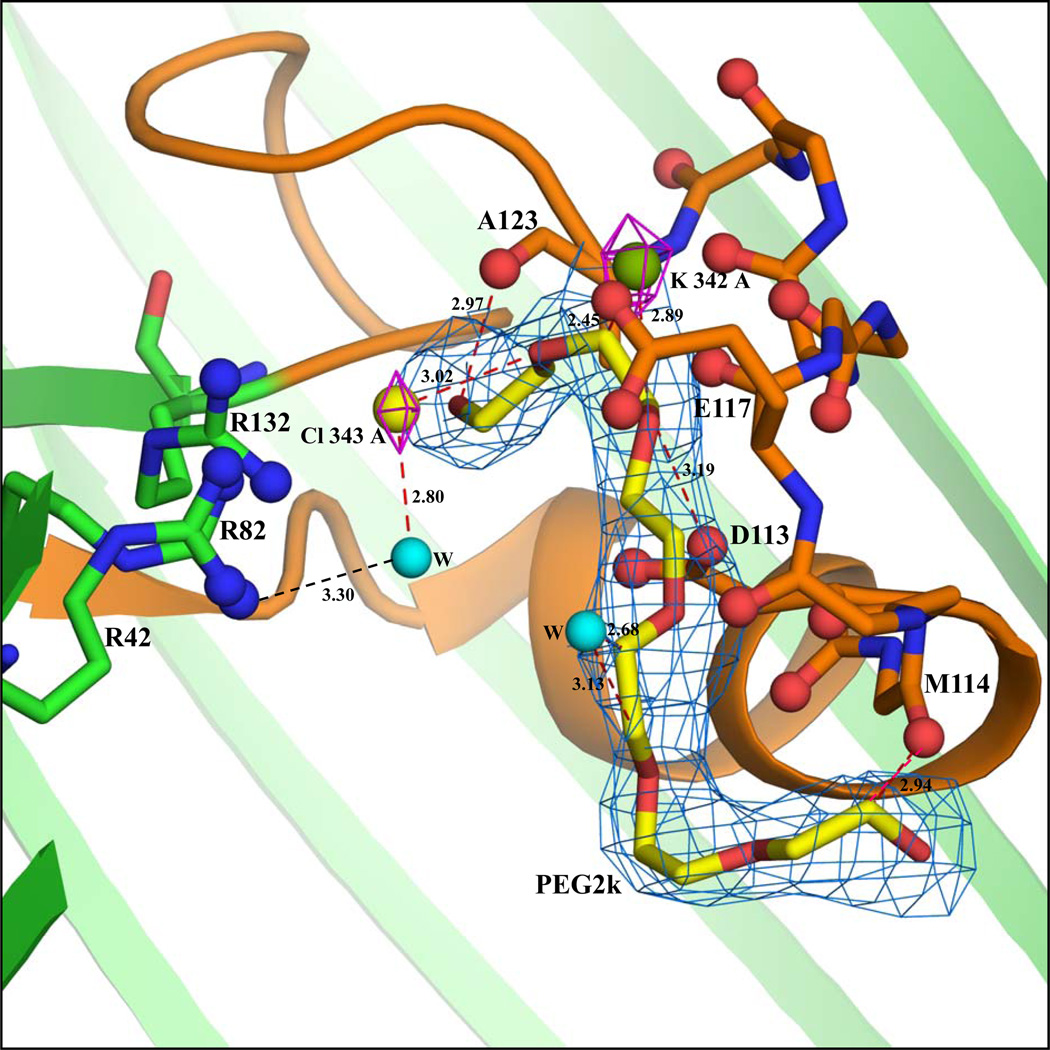
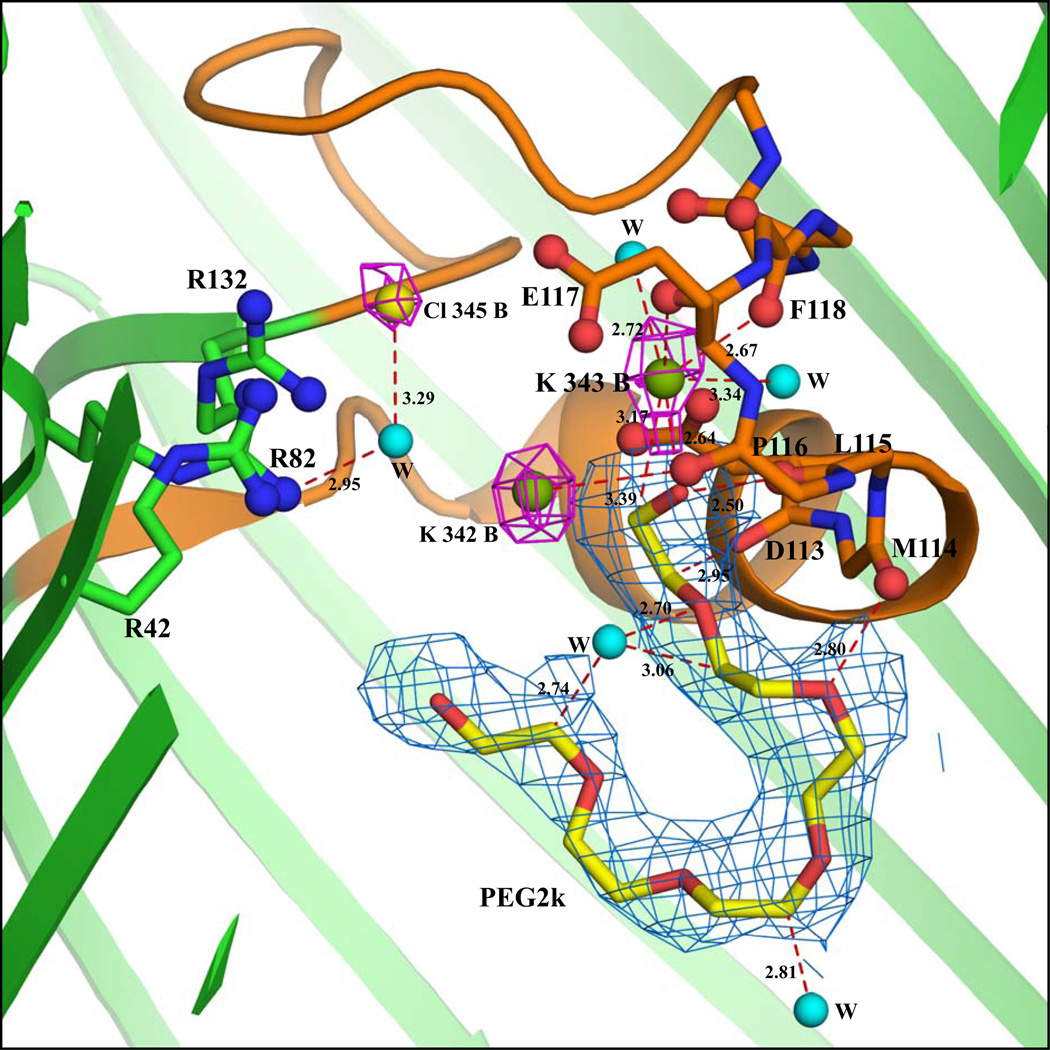
The KCl-OmpF structure was determined at 2.6 Å resolution. The asymmetric unit comprises two protein chains (A and B), 2 PEG molecules, 4 K+, 2 Cl− and 79 water molecules. The K+ and Cl− ions in both chains (Figure 1a and 1b) were determined by examining the |Fo-Fc| difference map peaks at a 4.0σ contour level. These are located only by using Fo-Fc difference map and the densities are observed in the 2Fo-Fc map as shown in Figure 1a and 1b. The positions of the 2 Cl− ions are identical in the chains A and B, with a water molecule forming hydrogen bonded network with Arg82. Of the four K+ ions, three are located inside the pore. One K+ ion (labeled K342A) is located in the pore formed by chain A, and 2 K+ ions (labeled K342B and K343B) are located in the pore formed by chain B near to the loop L3 region. A third K+ ion (labeled K344B) is outside the pore and interacts with backbone oxygen atoms of Asn316, Ile318 and Ser328 at the edge of the β-barrel. In both the A and B chains, an elongated density was observed inside the pore near the loop L3. As shown in Figure 1a, a PEG molecule could be fitted well inside the density. Unbiased omit maps are shown in supplementary figures 1 and 2. The PEG molecule in chain B interacts with backbone oxygen atoms of Asp113, Met114, Leu115, side chain atom OH of Tyr302 and to NH1 atom of Arg270 (Figure 1b). The presence of a bound PEG in the pore, though not observed or reported in previous structural studies of the OmpF porin, is consistent with the crystallization precipitant and with experimental studies showing the conductance of OmpF with different molecular weights of PEG.19 The PEG molecule and the K+ and Cl− ions are positioned near the loop L3 region of the selectivity filter. One K+ ion is inside the pore formed by chain A (K342A) where it interacts with atoms O19, C20 and C21 of the PEG molecule. The C20 atom of the PEG molecule is positioned such that it could form weak hydrogen bonding interactions with atom Oδ1 of Asp113. The remainder of the PEG molecule interacts mainly with the backbone oxygen atoms of Met114, Leu115, Glu117, Phe118, Gly119 and Ala123 (Figure 1a). Two K+ ions (K342B and K343B) are inside the pore formed by chain B. One (K343B) has a pentacoordinated interaction20 with the backbone oxygen atoms of Glu117, Phe118, and O7 of PEG, and with 2 water molecules. The other (K342B) interacts with the main chain oxygen atom of Pro116 at the tip of the L3 loop.
Figure 1.
(a) Cross-sectional close-up view of the interactions inside the pore of chain A in the KCl-OmpF structure. The view is from the side with the extracellular end of the pore at the top and the intracellular end at the bottom. The protein structure is drawn in cartoon representation (green color) and the constriction zone (residues 100–131) is colored orange. The backbone atoms of residues in the loop 3 region (112–123) interacting with K, PEG and water molecules are represented by sticks and the backbone carbonyl oxygens are represented by ball and stick model. The three Arg residues (R42, R82 and R132) stacked over each other are represented by ball and stick model. The K (green sphere) and the Cl (yellow sphere) densities are shown at 3.5σ contour level in the 2Fo-Fc map (magenta). The 2Fo-Fc electron density at 0.9σ contour level for the PEG2k molecule is indicated by marine color. Water molecules are shown as cyan spheres. (b) Cross-sectional close-up view of the interactions inside the pore of chain B in the KCl-OmpF structure. A water molecule is shown as a cyan sphere (all other drawing conventions are same as in part a). The peaks were located in the Fo-Fc map using the program COOT. In this figure as the densities are observed after refinement in 2Fo-Fc map, the density is displayed at 3.5σ contour level. The 2Fo-Fc electron density diagram at 0.9σ contour level for the PEG2k molecule is indicated by marine color.
The cross-section of the limiting aperture for chains A and B is the same as observed by the 2.4 Å OmpF structure8, except between Arg82 (NH) and Asp113 (Oδ2), where a deviation of ±0.2 Å is observed. Key distances limiting the aperture at the constriction zone are given in Table 2. There is a slight shift in the cross-section of the limiting aperture, which might be caused by the binding of PEG molecules along the Loop L3 region (Figure 1a and 1b). The superposition of the backbone Cα atoms of chains A and B differ by 0.33 Å RMS.
Table 2.
Key distances in the constriction zone
| Residues | Distances (Å) | |||||||
|---|---|---|---|---|---|---|---|---|
| RbCl-OmpF | KCl-OmpF | 2OMF | 2ZLD | 2ZFG | ||||
| A | B | A | B | A | B | |||
| Arg82 NH-Asp113 Oδ2 | 7.68 | 7.30 | 8.01 | 8.25 | 8.12 | 7.95 | 7.96 | 7.82 |
| Lys16 NZ- Leu115 O | 9.25 | 8.68 | 9.14 | 9.14 | 9.13 | 8.63 | 8.62 | 8.83 |
| Tyr310 OH-Tyr 106 OH | 14.75 | 14.72 | 14.86 | 14.86 | 14.86 | 14.54 | 14.56 | 14.44 |
RbCl-OmpF Structure
The RbCl-OmpF structure was determined at 3.0 Å resolution. The asymmetric unit consists of two chains A and B, 2 PEG molecules, 19 Rb+ and 24 water molecules. The densities attributed to water molecules were detected in the Fo-Fc omit map. These water molecules were included in the final model for the sake of consistency despite the moderate resolution. No structural implications are drawn from these water molecules. 19 Rb+ ions were detected at a 10.0σ contour level and their positions were determined by carefully monitoring the RbCl-OmpF anomalous map (see Methods for details). The analysis follows essentially the protocol of Tereshko et al21 to detect alkali metal ions in DNA crystals.
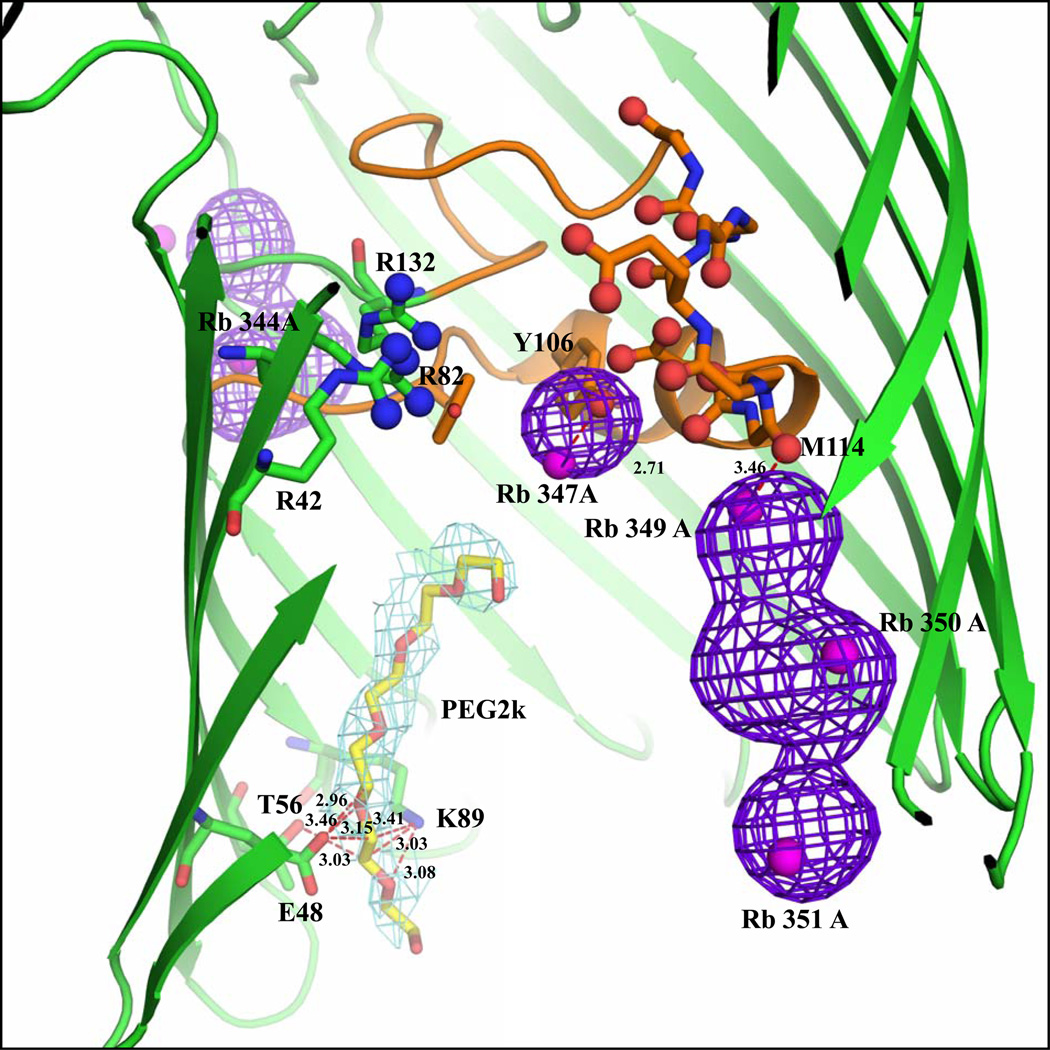
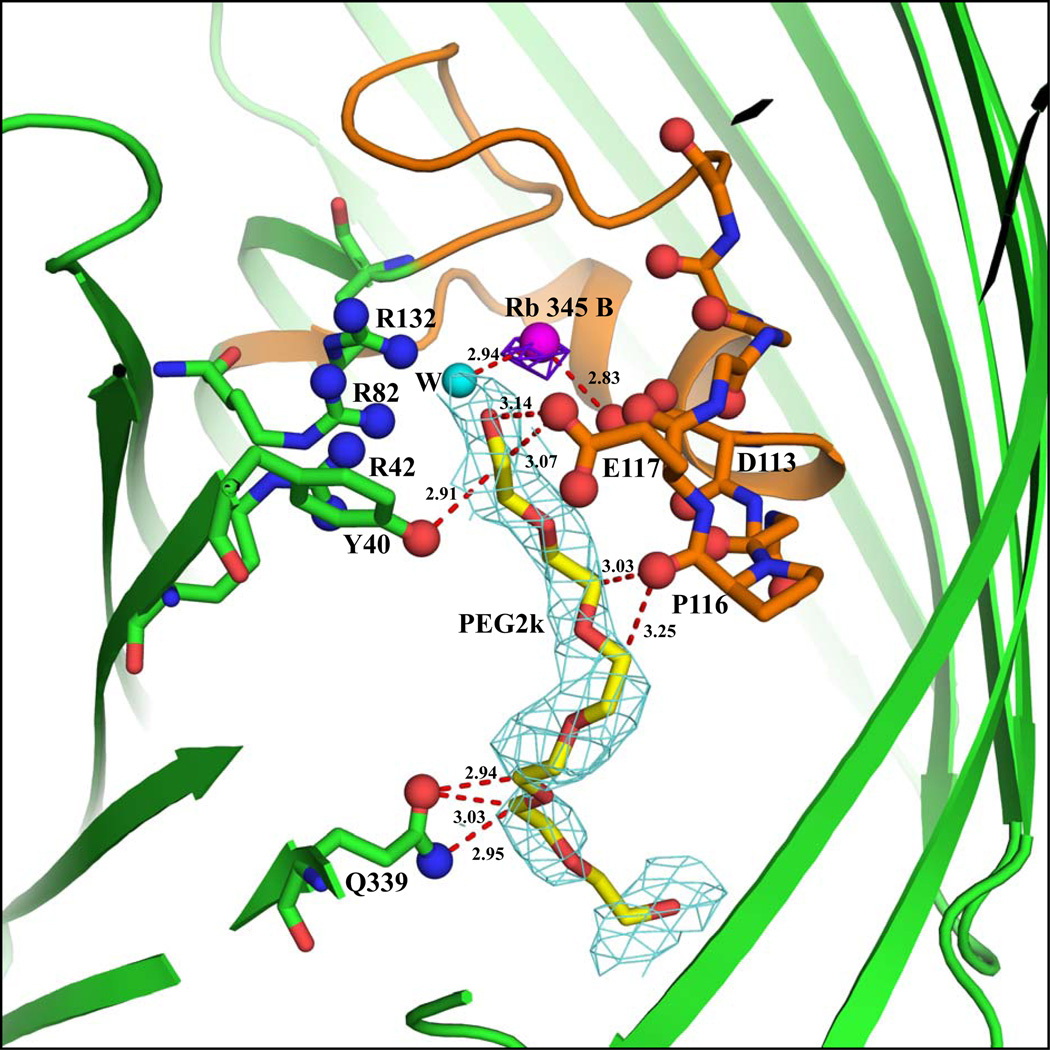
Of the 19 Rb+ ions, 15 are associated with chain A and 4 with chain B. The anomalous map clearly shows the Rb+ ions peaks as shown in Figure 2a. Due to their low occupancy, the densities of several Rb+ ions (14 out of 19) are not detected in the 2Fo-Fc map. The densities of 5 Rb+ ions can be observed in the 2|Fo|-|Fc| or |Fo|-|Fc| omit maps. Of those 5 Rb+, only one (labeled Rb345) is located inside the pore formed by chain B; the others are located near the extra-cellular surface. This is shown in Figure 2b and supplementary figures 5, 6, 9, and 10. An omit map density and simulated annealing omit map density for all ions included in our models is shown in Figures 5–12 in the Supplementary Material. A total of 6 Rb+ ions are located inside the OmpF pore. In chain A, five Rb+ ions labeled Rb344A, Rb347A, Rb349A, Rb350A and Rb351A are located inside the pore (Figure 2a). Rb344A is located at the start of the constriction zone interacting with backbone atoms of Gly99, Arg100, Gly135, Val136, and with a water molecule. Rb347A is located between Tyr102 and Tyr106, at distances of 3.95 and 4.78 Å, respectively. Rb349A, Rb350A and Rb351A are clustered near the tip of the loop 3 region. Rb351A interacts with the backbone oxygen atom of Met114. Only a single Rb+ ion (Rb345B) is seen in chain B, where it interacts with a water molecule and the Oδ2 atom of Asp113 (Figure 2b).
Figure 2.
(a) Cross-sectional view of the RbCl-OmpF interactions inside the pore of chain A. The view is from the side with the extracellular end of the pore at the top and the intracellular end at the bottom. The protein structure is shown by cartoon (green color) representation and the constriction zone (residues 100–131) is colored orange. The Rb+ ions are shown as magenta spheres. The backbone atoms of residues in the loop 3 region (112–123) interacting with K ions, PEG and water molecules are represented by lines and the backbone carbonyl oxygens are represented by ball and stick model. The three Arg residues (R42, R82 and R132) stacked over each other are represented by ball and stick model. The rubidium anomalous difference map is shown in purple blue at 10.0σ contour level. Refinement while imposing partial occupancy of the Rb+ ions decreased their B-factor but shifted their positions only slightly (they remain inside the anomalous density). The 2Fo-Fc electron density diagram at 0.9σ contour level for the PEG2k molecule is indicated by aquamarine. (b) Cross-sectional and close-up view of the RbCl-OmpF interactions inside the pore of chain B. A water molecule is shown as a cyan sphere (all other drawing conventions are same as in part a). The Rb+ inside the pore of chain B (Rb 345) was not detected in the anomalous map but was detected from the Fo-Fc map. In this figure the Rb+ density is shown using the 2Fo-Fc map.
As with the native KCl-OmpF structure, an elongated density inside the pore is observed in the |Fo-Fc| map at 3.0σ contour level in both the A and B chains. As shown in Figures 2a and 2b, a PEG molecule could be fitted well inside the density. An unbiased omit map is shown in Figures 3 and 4 of Supplementary Material. In the A chain, the PEG molecule interacts with Lys89, Thr56 and Glu48 near the periplasmic region. In the B chain, the PEG molecule is located near the loop L3 region at the constriction zone where it interacts with Gln339, Ser308, Pro116, Tyr40 and Glu117. The presence of a PEG molecule in chain B near the constriction zone affects the binding of Rb+ ions. In chain A, the PEG molecule is bound near the tip of the β-barrel where it interacts with residues Glu48, Thr56 and Lys89. This appears to favor the binding of the Rb+ ions near the loop L3, as inferred from the anomalous density peaks. In chain B, however, the PEG molecule is bound near the constriction zone where it interacts with the residues Tyr40, Pro116 and Glu117 of L3. This appears to disfavor the binding of Rb+ ions near L3. Key distance reflecting the width of the limiting aperture of the constriction zone for both chains are shown in Table 2. The superposition of the backbone Cα atoms of chains A and B differ by 0.36 Å RMS.
DISCUSSION
Identification of the electron density and the PEG molecule
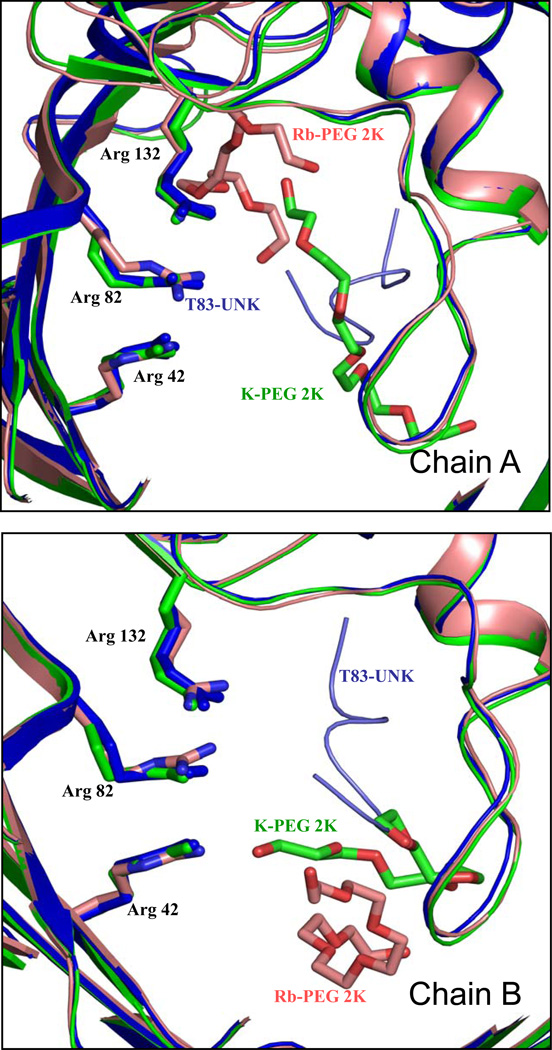
An elongated electron density is observed near the loop L3 in both the native KCl- and RbCl-OmpF structures. In the present studies, the co-crystallizing agent contains only the precipitating agent, PEG, and the detergent. Since detergent is bound only to the exterior of the OmpF structure8 and the elongated density is seen near the Loop 3 region inside the pore, attempts were made to fit a PEG molecule inside the density (Figures 1a, 1b, 2a and 2b; unbiased omit maps of the bound PEG are shown in Figures 1–4 of the Supplementary Material). The PEG molecule matches the density well. Mainly the carbon atoms of the PEG molecule interact with the carbonyl oxygens and with the side chains of the loop L3 in the constriction zone (residues 100–134). In the RbCl-OmpF structure, the PEG molecule is bound near the periplasmic surface in chain A. In chain B the PEG molecule is bound near the loop L3 interacting with Pro116, Glu117, Tyr40 and Tyr310. Due to the binding of the PEG molecule at different positions in the Rb-OmpF structure, the cross-section of the limiting aperture varies, showing a deviation of ± 0.3 Å in Arg82 NH-Asp113 Oδ2 and a deviation of ± 0.6 Å in Lys16 NZ- Leu 115O (Table 2). Interestingly, Yamashita et al14 also identified an elongated electron density near the Loop 3 region and have described the binding of the T-83 (colicin) fragment, represented as 'UNK' near the Loop 3 region in OmpF/T83 structure (PDB id:2ZLD). The positions of the binding of the T83 peptide fragment (labeled UNK) in both chains are the same.
Although the K+ and Rb+ do not occupy identical positions, this should not be interpreted as an evidence of ion specificity in the wide aqueous OmpF pore. Rather, it is likely that the differences in the positions of K+ and Rb+ result from the RbCl and KCl soaking, and are also affected by the binding of a PEG molecule into the pore. It is somewhat surprising that the two pore contents (chains A and B) differ, in spite of highly similar protein scafold. Nonetheless, we are confident about the lack of perfect symmetry because Rfree dropped only to 30.0%. when non-crystallographic symmetry restraints (NCS) were enforced during refinement for the KCl-OmpF structure. A possible explanation for this observation is suggested by the lattice packing. There are 2 β-barrels in the asymmetric unit, which form two families of homo-trimers by virtue of the crystallographic symmetry. By visual inspection of the 3-dimensional lattice, it is manifest that the environment experienced by each family of trimers is not identical. Because electrostatic interactions act at very long range, it is plausible that the distribution of the loosely bound K+ and Rb+ ions inside the two pores is not identical.
Superposition of KCl and RbCl OmpF structures
The overall superposition of the OmpF/T83 structure and the KCl and RbCl OmpF structure is shown in Figure 3. In all the structures, the β-barrel fold is very well maintained. The overall superposition of all four chains from the native and RbCl structure differ only by 0.306 Å RMSD. Since the binding of PEG molecule inside the pore varies in all four chains, the positions of the ions inside the pore are not identical. This intriguing variability indicates that the crystallization conditions are highly sensitive to the occupancy of the pore and that the ions are not strongly bound to the protein. Furthermore, the differences in position are consistent with the possibility of translocation of PEG molecules through the pore, in accord with bilayer experiments.19 The position of the PEG molecules bears some similarities to the T83 peptide fragment observed in the OmpF/T83 structure (pdb id 2ZLD).14 In the structure 2ZLD, the T83 peptide fragment (UNK-T83) was built as 7-mer peptide fragment, to fit in the observed electronic density. However, the density does not reveal the side chain of the peptide fragment, which was constructed only as a linear backbone chain. The present results revealing the presence of PEG molecules bound in a similar region of the OmpF pore raise the intriguing question of whether the density in 2ZLD might correspond to PEG 6000, which was also used in the crystallization condition.
Figure 3.
Superposition of RbCl-OmpF (pink) and KCl-OmpF (green) with OmpF-T83 from PDB id:2ZLD (purple).14 The position of PEG2k molecules in RbCl- and KCl-OmpF and the position of the T83 fragment (UNK) in OmpF-T83 are indicated by sticks. The secondary structure of the OmpF porin is indicated by cartoon representation. The view is from the extracellular side along the pore axis.
Cation selective pathway
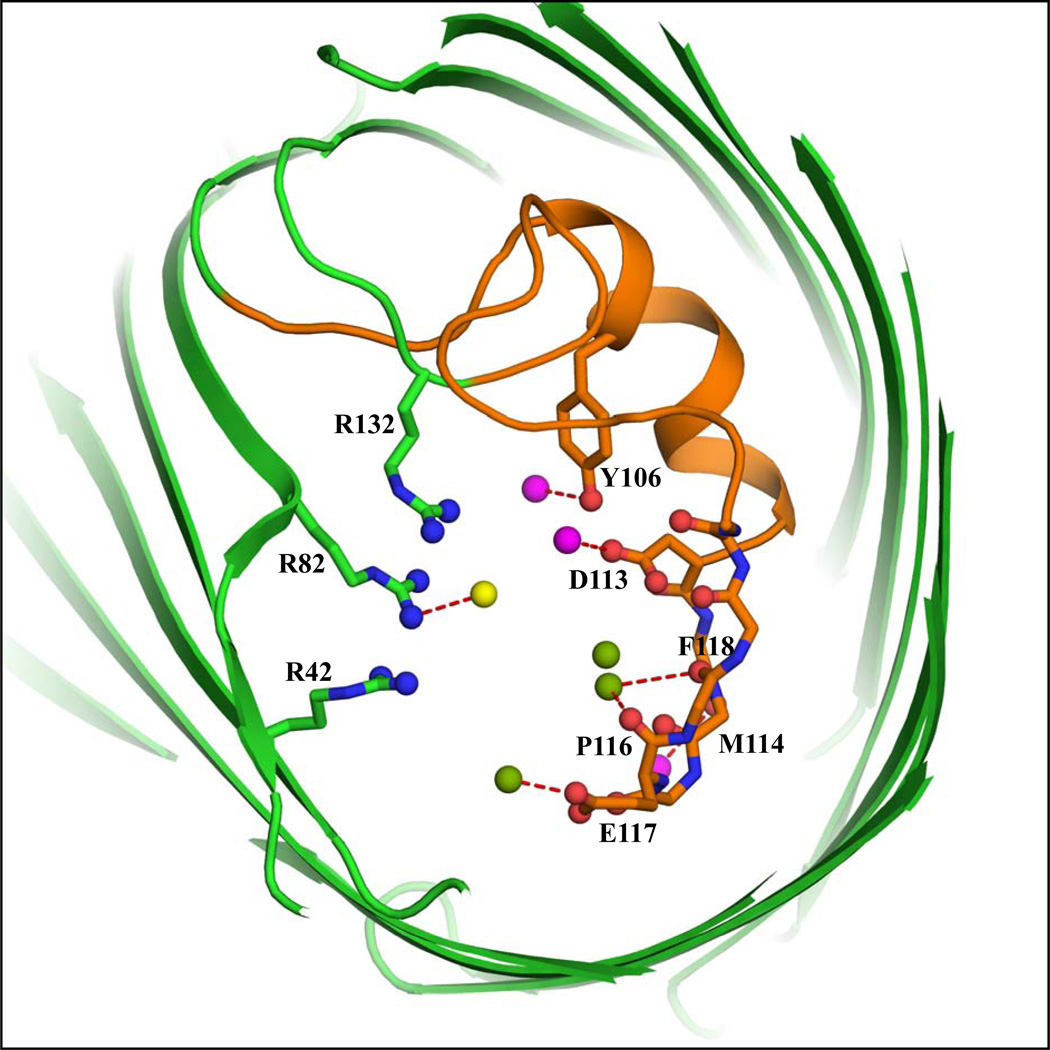
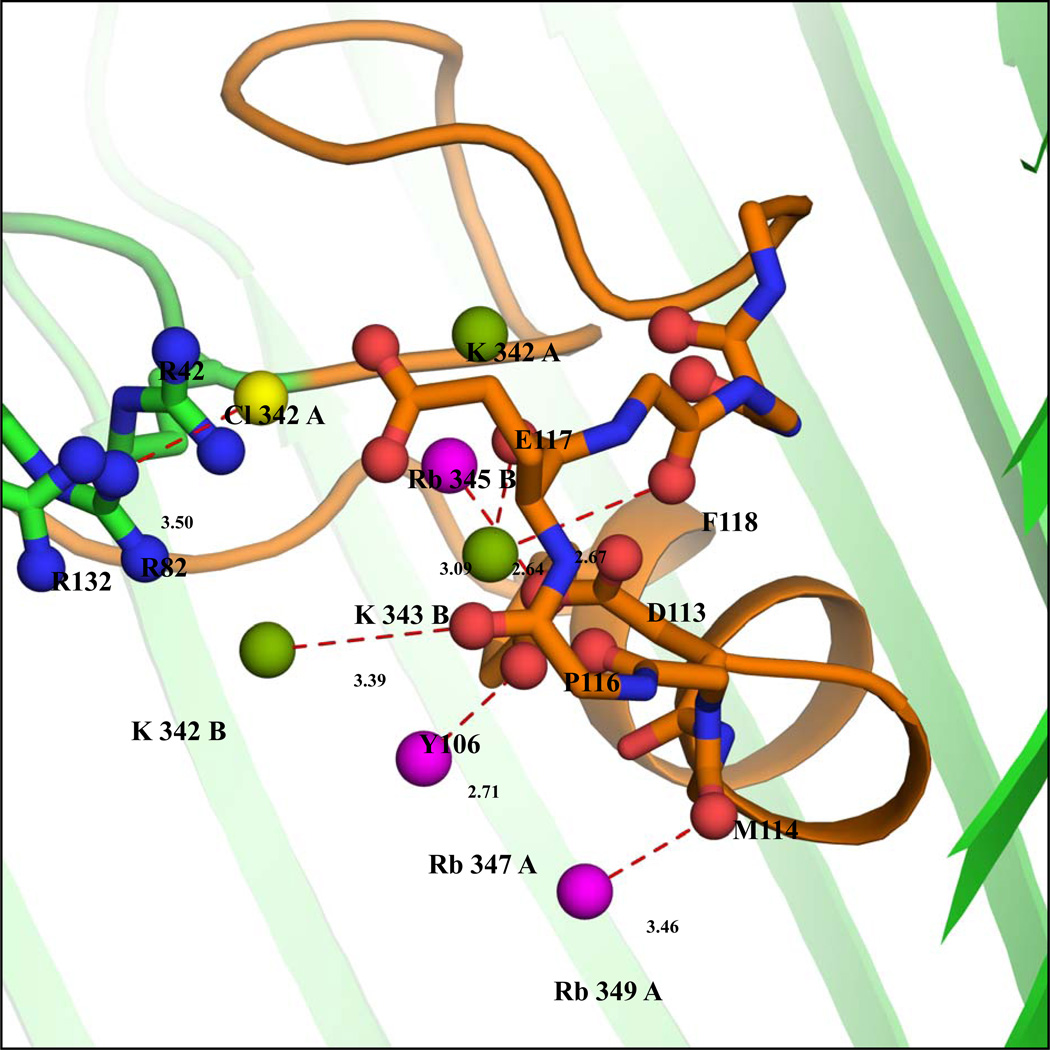
The detailed positions of cations and anions are obtained by collecting all information by a superposition of the four monomers of the native KCl and RbCl OmpF structures. The result is shown in Figure 4a and 4b. For the sake of clarity, the PEG molecules are removed and only the ions bound near the loop L3 are shown. The overall superposition clearly shows the permeation of ions through the pore. The K+ and Rb+ ions are bound at the constriction zone near the negatively charged L3 loop, comprising Asp113, Glu117 and carbonyl oxygens. The Cl− ion is bound on the opposite side of the constriction zone, near the cluster of basic residues. This confirms that OmpF has separate ion-specific pathways at the constriction zone. The positions of the monovalent ions near the loop L3 in the constriction zone correlate well with results from previous MD and BD studies.7,16
Figure 4.
(a) Overall superposition of the ions cumulated from all four chains taken from the native KCl-OmpF and RbCl-OmpF structures. The figure shows a slab of 20 Å thickness viewed from the extracellular side along the pore axis. The Rb+, K+ and Cl− ions are colored respectively magenta, green and yellow spheres and the constriction zone (residues 100–131) is colored orange. The atoms of residues in the loop L3 (112–123) interacting with the ions, PEG, and water molecules are ball and stick model and the interactions are indicated by dash lines. The three Arg residues (R42, R82 and R132) stacked over each other are represented by ball and stick model (blue). (b) Cross-sectional close-up view of the same superposition.
Despite the moderate resolution of the diffraction data, there is nonetheless good confidence about the positions of the ions inside the OmpF pore. All but one of the Rb+ ions located inside the pore are detected from the Fourier anomalous and gradient maps (see also Figures 5–12 in the Supplementary Material). Among the 5 Rb+ constructed on the basis of the Fo-Fc omit map, only Rb345 is located inside the pore of chain B. In addition, several ions are found at very similar positions in chain A and B, even though there is no exact symmetry between the content of the two monomers. For example, the Rb+ ions positioned near Asn207 and Gln317 are replicated in both the A and B chains. Furthermore, Rb353 and Rb354 in chain A occupy positions corresponding to Rb343 and Rb344 in chain B near the outer rim of the β-barrel (Rb343 and Rb354 are close to Asn316 and Ser328 in chains B and A, respectively, while Rb344 and Rb353 are close to Glu210 and Gly206 in chains B and A respectively). See also Table 1 in the Supplementary Material.
Upon refining the model, it was noted that the B-factors of several Rb+ ions were higher (100–150 Å2) than the average for the rest of structure (~38 Å2). Such high B-factors reflect the large fluctuations as well as the partial occupancy of the Rb+ ions loosely bound inside the aqueous OmpF pore. For example, reducing the B-factors of the Rb+ ions to values similar to those of nearby protein sidechains leads to partial occupancy on the order of 0.1 to 0.2. No significant variation of the Cartesian coordinates of the ions occurs when the occupancy is reduced (i.e., the actual positions of the ions in the pore deduced from the anomalous scattering data are unchanged). While it is clear that higher resolution X-ray data would be needed for a quantitative determination of occupancy, the low values are qualitatively consistent with the concept of low affinity cation binding sites inside the aqueous pore.
In the computational studies, the screw-like pathways of the cations and anions extended over the height of the β-barrel, leading to the hypothesis that the charge specificity of OmpF arises from a number of residues distributed over a large fraction of the aqueous pore rather than a few interactions localized near the constriction zone.7,16 Here, the first hints of the separate cation and anion permeation pathways near the constriction zone have been detected. Based on the computational studies and the present results based on X-ray diffraction data, it is likely that the particular crystallographic positions of K+, Rb+ and Cl− resolved here reflect only a sample of the range of the possible low affinity locations of cations and anions at the constriction zone of OmpF. In this sense, the crystallographic positions cumulated in Figure 4 should not be interpreted as a definitive set of discrete binding sites outlining some strict pathways, with the suggestion that permeation proceeds with the anions or cations “hopping” from site to site along their respective pathway. As indicated by the computational studies, there is a continuum of ion positions consistent with the electrostatic charge specificity of OmpF that are visited by diffusion during permeation within the wide aqueous pore. Additional discrete positions reflecting the anion/cation propensity at the constriction zone could probably be observed by altering the crystallization conditions, and it seems likely that one will need to accumulate the information from several X-ray structures to achieve a complete perspective on the electrostatics inside the pore. Further studies are currently in progress to determine exactly the positions of the cations and anions at other locations and at different salt concentrations. It hoped that such efforts will help better understand the detailed ion permeation in OmpF porins, and clarify the rules governing electrostatic interactions at molecular lengthscales in confined molecular pores.
Methods and Experimental Procedures
Expression, purification and crystallization of OmpF
The purification was done as described by Pauptit et al.22 OmpF was expressed in MH225 cells carrying plasmid pPR272. The cells were grown overnight at 37°C in LB medium in the presence of 50µg/ml kanamycin. The cells were collected by centrifugation at 5000Xg for 10 min and homogenized in the presence of Dnase I and protease inhibitor in cell resuspension buffer (20mM sodium phosphate and 50mM NaCl). The pellet containing the membrane was collected after centrifuging the lysate at 40,000g for an hour. The pellet was resuspended in extraction buffer (20mM Sodium phosphate, 3mM sodium azide, 3mM DTT, 25mM EDTA and 50mM NaCl), stirred and incubated at 37°C for 30min and then centrifuged at 40,000g for 1hr. The pre-extraction was carried out for three rounds at a low detergent concentration (0.5% octylPOE). Finally, OmpF was extracted from the membrane by adding 9ml of extraction buffer containing 3% octylPOE per 0.6–0.9g of wet membrane material. Three rounds of extractions were performed, which were then analyzed by SDS PAGE. The extracts containing OmpF were pooled and concentrated and the buffer was exchanged to DE53 low buffer (20mM HEPES, pH 7.6 and 0.5% octylPOE). The extract was concentrated to a workable volume to load on Ultrogel AcA34 column equilibrated by the DE53 low buffer. The peak fractions were collected and checked for purity using SDS PAGE. The OmpF fractions were pooled and concentrated to 8mg/ml. OmpF native crystals were grown in buffer containing 0.5M NaCl, 0.1M sodium phosphate, pH 6.5, 0.9% BOG, 0.09% octylPOE, 1mM sodium azide and 14% PEG2000. The crystals (grown in NaCl) were then soaked in 300mM RbCl and KCl.
Data collection and refinement
Data collection was carried out at beamline 23 SER/CAT ID-B of the Advanced Photon Source (Argonne National Laboratory). Data collection and refinement statistics are given in Table 1. The very thin and fragile RbCl-soaked crystals diffracted to 2.4 Å when glycerol was added to a final concentration of 40%. The crystals, which diffracted to a good resolution, were thin and the mosaicity was a bit high. The I/sigma ratio for the KCl-OmpF is 28.9(5.57) and for the RbCl-OmpF is 9.64(2.34). Anomalous data was collected at the rubidium edge (λ=0.8149 Å). Native KCl-soaked crystals diffracted to 2.2 Å. Both the KCl- and RbCl-soaked crystals were crystallized in P63 space group and the datasets were integrated and scaled using the HKL-2000 package.23 The data sets from the KCL- and RbCl-soaked crystals were 89% and 100% complete at resolution limits of 2.6 and 3.0 Å, at which the two structures were refined, respectively. 5% and 10% of the Rfree reflections from the native KCl and the RbCl datasets were selected randomly for refinement. The native structure was solved by the molecular replacement method using the program Phaser17 implemented in the CCP4 suite.18 The structure PDB id 2OMF8 was used as starting model and refined using REFMAC to a final R-factor of 24% and Rfree of 30%.
Table 1.
Data Collection and refinement statistics for KCl-OmpF and RbCl-OmpF
| KCl-OmpF | RbCl-OmpF | |
|---|---|---|
| Space group | P63 | P63 |
| Unit cell (Å, °) | a=117.545 | a=117.192 |
| b=117.545 | b=117.192 | |
| c=121.287 | c=116.885 | |
| γ=120.0 | γ=120.0 | |
| Solvent Content (%) | 61.12 | 59.42 |
| Number of molecules in ASU | 2 | 2 |
| Resolution range (outer shell) | 50-2.6(2.69-2.6) | 50-3.0 (3.11-3.0) |
| No. of independent reflections | 176648 | 173107 |
| Redundancy | 6.8(4.0) | 9.6(9.6) |
| Completeness (%) | 89.2(74.5) | 100.0(100. 0) |
| Rmerge | 14.7(40.0) | 16.0(56.4) |
| Refinement and model correction | ||
| Resolution (Å) | 50-2.6 | 50-3.0 |
| No. of reflections used for refinement | 24632 | 33492 |
| Rfactor (%) | 23.5 | 23.06 |
| No. of reflections used for Rfree | 1336 | 3266 |
| Rfree (%) | 30.0 | 28.51 |
| Average B-factor (Å2) | 48.6 | 41.81 |
| RMS deviation from ideal geometry | ||
| Bond lengths (Å) | 0.037 | 0.007 |
| Bond lengths (Å) | 2.795 | 1.307 |
TYR 06OH has to be changed to TYR
106OH in the limiting aperture distance table 1.
The RbCl-OmpF anomalous datasets were used to locate 19 Rb atoms using the SAD method of CNS.24 By inference, those are identified as Rb+ ions. Briefly, the anomalous data sets were processed and scaled using HKL-2000. A Patterson map was calculated and a heavy atom search was done using the CNS-SAD protocol, yielding 20 hits. SAD phasing was done using the Rb+ peaks and the Fourier anomalous and gradient maps were calculated. Upon examination, a total of 14 Rb+ peaks were located using the anomalous map; 12 Rb+ from chain A (341, 342, 343, 344, 345, 345, 346, 347, 348, 349, 350, 351, 352) and 2 Rb+ from chain B (341, 342). Fo-Fc and 2Fo-Fc maps were calculated for the refined model. The structure was refined from the RbCl-OmpF data set with the CNS molecular replacement protocol using 2OMF as search model. The density for the OmpF model was checked against the 2Fo-Fc map. Based on the Fo-Fc omit map at a 4–5σ cutoff, 5 additional Rb+ peaks were located; 2 Rb+ in chain A (353, 354) and 3 Rb+ in chain B (343, 344, 345) were located and included for further refinement (n.b., only Rb 345 is located inside the OmpF pore). There is a total of 19 Rb+ ions in the final RbCl-OmpF model. Linear elongated densities were also observed in both of the pores formed by chain A and B, and were modeled as PEG molecules. The Rb+ peaks (from anomalous diffraction) and the molecular replacement model of OmpF were merged, yielding a starting RbCl-OmpF model for further rigid body and annealing refinement using CNS. A few water molecules were located and constructed in the model during refinement. The rigid body and simulated annealing refinement was done using CNS, yielding a final R-factor of 23% and Rfree of 28.5%. Model building was carried out using the COOT program.25 More information (omit maps) is provided in the Supplementary Material.
Supplementary Material
Acknowledgements
X-ray diffraction data were collected at beam line 23 SER/CAT ID-B at the Advanced Photon Source, Argonne National Laboratory. GM/CA CAT has been funded in whole or in part with Federal funds from the National Cancer Institute (Y1-CO-1020) and the National Institute of General Medical Sciences (Y1-GM-1104). Use of the Advanced Photon Source was supported by the U.S. Department of Energy, Basic Energy Sciences, Office of Science, under contract No.W-31-109-ENG-38. The authors are grateful to Tilman Schirmer and Patrick Loll for providing the OmpF vectors and for useful discussions. We thank Brigitte Ziervogel, Albert Lau and the staff at beam line 23ID-B for their kind help during data collection. These studies were supported by grant GM-62342 from the NIH.
List of abbreviations
- OMPF
outer membrane protein F
- PEG
Poly Ethylene Glycol
- SAD
single-wavelength anomalous dispersion
Footnotes
Accession Numbers
Coordinates have been deposited in the PDB with accession codes 3HW9 and 3HWB.
References
- 1.Benz R, Bauer K. Permeation of hydrophilic molecules through the outer membrane of Gram-negative bacteria. Eur. J. Biochem. 1988;176:1–19. doi: 10.1111/j.1432-1033.1988.tb14245.x. [DOI] [PubMed] [Google Scholar]
- 2.Jap B, Wallan P. Biophysics of the structure and functional of porins. Quart. Rev. Biophys. 1990;23:367–403. doi: 10.1017/s003358350000559x. [DOI] [PubMed] [Google Scholar]
- 3.Nikaido H. Transport across the bacterial outer membrane. J. Bioenerg. Biomembr. 1993;25:581–589. doi: 10.1007/BF00770245. [DOI] [PubMed] [Google Scholar]
- 4.Benz R, Schmid A, Hancock R. Ion selectivity of Gram-negative bacterial porins. J. Bacteriol. 1985;162:722–727. doi: 10.1128/jb.162.2.722-727.1985. [DOI] [PMC free article] [PubMed] [Google Scholar]
- 5.Saint N, Lou K, Widmer C, Luckey M, Schirmer T, Rosenbusch J. Structural and functional characterization of OmpF porin mutants selected for larger pore size. II. Functional characterization. J. Biol. Chem. 1996;271:20676–20680. [PubMed] [Google Scholar]
- 6.Schirmer T, Phale P. Brownian dynamics simulation of ion flow through porin channels. J. Mol. Biol. 1999;294:1159–1167. doi: 10.1006/jmbi.1999.3326. [DOI] [PubMed] [Google Scholar]
- 7.Im W, Roux B. Ion permeation and selectivity of OmpF Porin: A theoretical study based on molecular dynamics, and continuum electro diffusion theory. J. Mol. Biol. 2002;322:851–859. doi: 10.1016/s0022-2836(02)00778-7. [DOI] [PubMed] [Google Scholar]
- 8.Cowan S, Schirmer T, Rummel G, Steiert M, Ghosh R, Pauptit R. Crystal structures explain functional properties of two E. coli porins. Nature. 1992;358:727–733. doi: 10.1038/358727a0. [DOI] [PubMed] [Google Scholar]
- 9.Schirmer T. General and specific porins from bacterial outer membranes. J. Struct. Biol. 1998;121:101–109. doi: 10.1006/jsbi.1997.3946. [DOI] [PubMed] [Google Scholar]
- 10.Phale SP, Philippsen A, Kiefhaber T, Koebnik R, Phale PV, Schirmer T, Rosenbuch PJ. Stability of trimeric OmpF porin: The contributions of latching loop L2. Biochemistry. 1998;37:15663–15670. doi: 10.1021/bi981215c. [DOI] [PubMed] [Google Scholar]
- 11.Jeanteur D, Schirmer T, Fourel D, Simonet V, Rummel G, Widmer C, Rosenbusch JP, Pattus F, Pages JM. Structural and functional alterations of a colicin-resistant mutant of OmpF porin from Escherichia coli. Proc. Natl. Acad. Sci. USA. 1994;91:10675–10679. doi: 10.1073/pnas.91.22.10675. [DOI] [PMC free article] [PubMed] [Google Scholar]
- 12.Phale P, Philippsen A, Widmer C, Phale V, Rosenbusch J, Schirmer T. Role of charged residues at the OmpF porin channel constriction probed by mutagenesis and simulation. Biochemistry. 2001;40:6319–6325. doi: 10.1021/bi010046k. [DOI] [PubMed] [Google Scholar]
- 13.Bredin J, Simonet V, Iyer R, Delcour AH, Pages JM. Colicins, spermine and cephalosporins: a competitive interaction with the OmpF eyelet. Biochem. J. 2003;376:245–252. doi: 10.1042/BJ20030814. [DOI] [PMC free article] [PubMed] [Google Scholar]
- 14.Yamashita E, Zhalnina MV, Zakharov SD, Sharma O, Cramer WA. Crystal structures of the OmpF porin: function in a colicin translocon. EMBO. J. 2008;27:2171–2180. doi: 10.1038/emboj.2008.137. [DOI] [PMC free article] [PubMed] [Google Scholar]
- 15.Karshikoff A, Spassov V, Cowan SW, Ladenstein R, Schirmer T. Electrostatic properties of two porin channels from Escherichia coli. J. Mol.Biol. 1994;240:372–384. doi: 10.1006/jmbi.1994.1451. [DOI] [PubMed] [Google Scholar]
- 16.Im W, Roux B. Ions and counter ions in a biological channel: a molecular dynamics simulation of OmpF porin from Escherichia coli in an explicit membrane with 1 M KCl aqueous salt solution. J. Mol. Biol. 2002;319:1177–1197. doi: 10.1016/S0022-2836(02)00380-7. [DOI] [PubMed] [Google Scholar]
- 17.McCoy AJ, Grosse-Kunstleve RW, Adams PD, Winn MD, Storoni LC, Read RJ. Phaser Crystallographic Software. J. Appl. Cryst. 2007;40:658–674. doi: 10.1107/S0021889807021206. [DOI] [PMC free article] [PubMed] [Google Scholar]
- 18.Collaborative Computational Project, Number 4. The CCP4 Suite: Programs for Protein Crystallography. Acta Crystallogr. D: Biol. Crystallogr. 1994;50:760–763. doi: 10.1107/S0907444994003112. [DOI] [PubMed] [Google Scholar]
- 19.Rostovtseva TK, Nestorovich EM, Bezrukov SM. Partitioning of differently sized poly (ethylene glycol)s into OmpF porin. Biophys. J. 2002;82:160–169. doi: 10.1016/S0006-3495(02)75383-6. [DOI] [PMC free article] [PubMed] [Google Scholar]
- 20.Fries DC, Sundaralingam M. Molecular structure of aminoacids and peptides. III. The molecular structure and conformation of potassium L-Tyrosine-O-Sulfate Dihydrate. Acta Cryst. 1970;B27:401–410. [Google Scholar]
- 21.Tereshko V, Wilds CJ, Minasov G, Prakash TP, Maier MA, Howard A, Wawrzak Z, Manoharan M, Egli M. Detection of alkali metal ions in DNA crystals using state-of-the-art X-ray diffraction experiments. Nucleic Acids Res. 2001;29:1208–1215. doi: 10.1093/nar/29.5.1208. [DOI] [PMC free article] [PubMed] [Google Scholar]
- 22.Pauptit RA, Zhang H, Rummel T, Schirmer T, Jansonious JN, Rosenbusch JP. Trigonal crystals of porin from Escheichia coli. J.Mol.Biol. 1991;218:505–507. doi: 10.1016/0022-2836(91)90696-4. [DOI] [PubMed] [Google Scholar]
- 23.Otwinowski Z, Minor W. Processing of X-ray Diffraction Data Collected in Oscillation Mode. In: Carter CW, Sweet RM, editors. Methods in Enzymology: Macromolecular Crystallography, part A. Vol. 276. NewYork: Academic Press; 1997. pp. 307–326. In methods in Enzymology: Macromolecular Crystallography, part A. [DOI] [PubMed] [Google Scholar]
- 24.Brunger AT. Version 1.2 of the Crystallography and NMR system. Nat. Protocols. 2007;2:2728–2733. doi: 10.1038/nprot.2007.406. [DOI] [PubMed] [Google Scholar]
- 25.Emsley P, Cowtan K. Coot: model-building tools for molecular graphics. Acta Crystallogr. D: Biol. Crystallogr. 2004;60:2126–2132. doi: 10.1107/S0907444904019158. [DOI] [PubMed] [Google Scholar]
Associated Data
This section collects any data citations, data availability statements, or supplementary materials included in this article.


