

Abstract

Fluorescent nanoparticles have enabled many discoveries regarding how molecular machines function. Quantum dots have been the dominant class of fluorescent nanoparticles but suffer from blinking and from a substantial dark fraction—particles where the fluorescence is never seen—complicating any analysis of biological function. Nanoparticles composed of conjugated fluorescent polymers (Pdots) have recently been shown to have high brightness and no blinking. Here we develop a robust and efficient means to measure the dark fraction of Pdots, conjugating Atto dyes to the nanoparticles and testing fluorescence colocalization of dye and Pdot puncta. This established that the Pdots we generated had minimal dark fraction: ∼3%. The application of nanoparticles in biological environments is highly sensitive to surface functionalization. For Pdots we found that passivation with uncharged hydroxy-terminated polyethylene glycol caused a dramatic reduction in nonspecific cell binding and aggregation compared to a charged coating. Using carbonyl di-imidazole the hydroxy-Pdots were functionalized efficiently with streptavidin for high stability targeting, allowing specific labeling of mammalian cells. Type I insulin-like growth factor receptor (IGF1R) regulates cell survival and development, with roles in aging, heart disease, and cancer. We used hydroxy-Pdots to track the dynamics of IGF1R on a breast cancer cell-line, determining the diffusion characteristics and showing cholesterol-containing membrane nanodomains were important for receptor mobility at the plasma membrane. The near-unity bright fraction and low nonspecific binding of hydroxy-Pdots, combined with Pdot photostability and lack of blinking, provides many advantages for investigations at the single molecule level.
Keywords: microscopy, QDs, nanotechnology, cellular imaging, IGF-1R, tumor
In evaluating a fluorophore, one must assess many virtues. Brightness is the obvious virtue, helping the resolution of light microscopy go even below 1 nm.1,2 Similarly, increased brightness will allow temporal resolution to move to the millisecond time-scale of conformational changes of molecular machines, or even to the microsecond time-scale in which such machines can diffuse. Brighter fluorophores also mean that excitation can be less intense, minimizing photodamage.3 However, one must also consider how the fluorescent output varies over time: transient or irreversible loss of emission is a major limiting factor. To improve brightness and photostability beyond what can be achieved using small-molecule dyes or fluorescent proteins, nanoparticles have been explored. Encapsulation of dyes often improves photostability, such as trapping in silica,4 latex,5 or polystyrene nanoparticles.6 Fluorescent nanoparticles have also been generated based on very different chemistry, notably CdSe/ZnS quantum dots (QDs),7 silver nanodots,8 or nanodiamond.9 Of these nanoparticles, only QDs have been widely applied for single molecule experiments.7 However, a major flaw of QDs is intermittent emission. This QD blinking can be overcome by toxic 2-mercaptoethanol,10 or at the cost of greater QD size by adding thick shells or gradation of the crystal lattice.10
A further important virtue is that each individual particle should emit, that there are few “ghost” particles which are present but never seen by fluorescence, termed the dark fraction. When QDs were evaluated, it was a surprise to find that their dark fraction was substantial: 30% by colocalization with a fluorescent ligand,11 49% by correlating fluorescence with atomic force microscopy,12 and 20–92% by fluorescence correlation spectroscopy.13 Similarly fluorescent proteins have a dark fraction from a nonemissive chromophore conformation, misfolding of the domain, or incomplete reaction to form the chromophore.14,15 A dark fraction disrupts many applications; for example, when imaging molecular motors moving on tracks (e.g., FtsK moving on DNA),16 it is hard to know whether pauses or reversals of the observed QD17 are intrinsic to the motor, or caused by collision with a dark QD on a motor running in the opposite direction. Similarly for absolute counting of molecules18 a dark fraction would lead to underestimation or assigning inappropriate variability. On the basis of the limitations of existing fluorophores, there is a great need to explore new kinds of imaging probes.
Polymers with electronic conjugation of their backbone have been used for many years for organic light-emitting diodes (LEDs) and photovoltaic cells.19 More recently, conjugated-polymer nanoparticles (polymer dots or Pdots) were generated for fluorescence imaging.19−22 Exceptional brightness of Pdots (greater than QDs), photostability thousands of times greater than dyes, and cellular labeling were demonstrated.23−25 Since fluorescence of conjugated polymers can be quenched by long-range intrachain and interchain energy transfer26 and Pdots have heterogeneous brightness,27 indicating that all fluorescent polymer chains do not emit with equal efficiency, it is important to test if there are Pdots which are fully quenched, that is, dark. In this report, we evaluate the dark fraction and biocompatibility of Pdots and we harness Pdots to probe the membrane dynamics of the type I insulin-like growth factor receptor (IGF1R).
Results and Discussion
Green-emitting polyfluorenylbenzothiadiazole (PFBT) and red-emitting polyfluorenyl-dithienylbenzothiadiazole (PF–DBT5) π-conjugated hydrophobic polymers (Figure 1a) were mixed to form the fluorescent core of Pdots, giving a large Stokes shift with red emission, as described.24 We surrounded the core fluorescent polymers by an amphiphilic coating nonfluorescent polymer: polystyrene–polyethylene glycol (PS–PEG) terminating with hydroxyl (PS–PEG–OH, giving hydroxy-Pdots) or carboxyl groups (PS–PEG–COOH, giving carboxy-Pdots) (Figure 1a). The hydrophobic polystyrene interacts with the core fluorescent polymers while the flexible hydrophilic PEG chain is exposed at the surface of Pdots (Figure 1a). We separately dissolved the polymer components in tetrahydrofuran (THF) and then mixed individual components, before rapidly injecting the mixture into water under sonication, to generate Pdots through nanoprecipitation.23
Figure 1.
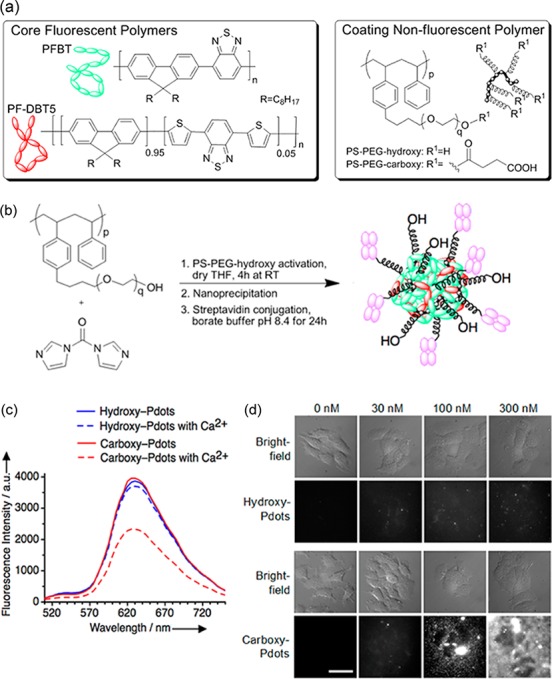
(a) Conjugated core fluorescent polymers were coassembled with hydroxy- or carboxy-terminated coating nonfluorescent polymer; transfer to water led to nanoparticle assembly. (b) Conjugation of streptavidin to activated hydroxy-Pdots. (c) Hydroxy- or carboxy-Pdots were incubated in aqueous buffer with or without 2 mM calcium chloride for 24 h, before removing aggregates and quantifying fluorescence. (d) MCF-7 cells were incubated with the indicated concentration of hydroxy- or carboxy-Pdots for 10 min, before wide-field fluorescence imaging. Scale bar, 10 μm.
We characterized absorbance and fluorescence of the synthesized hydroxy-Pdots: the absorbance spectrum was broad with maxima at ∼400 nm and ∼470 nm, while the emission spectrum had a maximum at ∼635 nm (Supporting Information, Figure S1a). To obtain a high quantum yield and no blinking, we used gentle conditions for Pdot purification, avoiding any heating after dilution into aqueous solution, to minimize the oxidation of polymer chains, which would lead to sites for exciton quenching.28 Pdot quantum yield was calculated as 57 ± 3% (Supporting Information, Figure S1b). Single-particle fluorescence intensity of Pdots fluctuated with time but we observed no disappearance of fluorescence, in contrast to QDs (Supporting Information, Figure S1c). QDs act like virtual atoms, with a single electronic state for the whole core nanoparticle,7 but Pdots of this size contain multiple polymer chains and so if one chain is in a transient nonemitting state, other chains can still emit.27
Nanoparticles have complex interactions with biological components, determined by factors including hydrophobicity, surface curvature and terminal functional groups.29,30 Nanoparticles are conventionally functionalized through surface amines or carboxyls29,31 but for QDs this surface charge promotes nonspecific interactions with biomolecules and cells.29,32 For Pdots, these charged sites for attachment are generally linked to an amphiphilic PEG polymer24 or a PEG–phospholipid coating.33 We generated hydroxy-coated Pdots to remove such a surface charge, even though subsequent conjugation of ligands is more challenging. Zeta potential measurement using electrophoretic light scattering confirmed that hydroxy-Pdots had minimal zeta potential, compared to a strong negative zeta potential seen on the carboxy-Pdot control (Supporting Information, Figure S2). By activating the PS–PEG–OH with carbonyl di-imidazole (CDI) in organic solvent, after nanoprecipitation into aqueous solvent the CDI-activated polymer can undergo slow reaction with amines on the target ligand, to form a carbamate (Figure 1b).34 Residual activating groups on the polymer spontaneous hydrolyze,34 minimizing subsequent nonspecific labeling (vide infra). We first compared carboxy- and hydroxy-Pdots for their stability over time in biological media. Ca2+ is present at high levels in the blood and in interstitial fluid and has the potential to bridge functional groups at the surface of nanoparticles, promoting aggregation.29,35 In particular Ca2+ at typical extracellular concentrations caused substantial aggregation of carboxy-Pdots (40 ± 1.7%) in comparison to hydroxy-Pdots (4.0 ± 0.6%) (P < 0.0001) (Figure 1c). Similarly carboxy-Pdots showed substantial nonspecific binding to mammalian cells and to the glass coverslip, whereas there was minimal binding of hydroxy-Pdots up to extreme concentrations (Figure 1d).
We established a way to determine the bright fraction of Pdots using single-particle fluorescence colocalization analysis after dye conjugation. We activated hydroxy-Pdots using CDI and reacted with Atto647N-amine (Figure 2a). Atto647N is ideal because it has no absorption at the ∼470 nm excitation peak of Pdots and maximal absorption at 644 nm where Pdots do not absorb (Figure 2b). Hydroxy-Pdot-Atto647N was purified using gel filtration and tested by steady-state UV–vis spectroscopy. The absorption spectrum of Pdot-Atto647N showed a characteristic peak due to both Pdots and the dye; the emission spectrum was consistent with efficient energy transfer from Pdots to Atto647N (Figure 2b). Fluorescent lifetimes of Pdots, Atto647N, and the Pdot-Atto647N conjugate were also measured, using time-correlated single photon counting (TCSPC). Fluorescence lifetime data were also consistent with energy transfer from PFBT to PF–DBT5 within the Pdots, as well as from the Pdots to Atto647N (Supporting Information, Figure S3 and Table S1).
Figure 2.
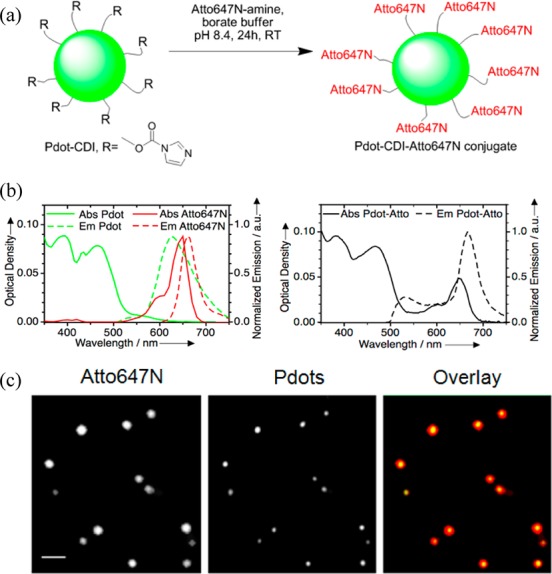
Determining bright fraction of Pdots. (a) CDI-activated hydroxy-Pdots were reacted with dye to make all nanoparticles visible. (b) Absorption and emission spectra of hydroxy-Pdots alone and dye alone are overlaid (left) and compared to the Pdot-dye conjugate (right). (Pdot and Pdot-dye excitation 460 nm; Atto647N excitation 580 nm. (c) Single-particle colocalization of hydroxy-Pdots with Atto647N by fluorescent microscopy. Dye fluorescence (left, grayscale), Pdot fluorescence (middle, grayscale), and an overlay (right, dye in red and Pdot in green) are shown. Scale bar, 5 μm.
To determine the bright fraction, we imaged hydroxy-Pdot-Atto647N particles by fluorescence microscopy. Every nanoparticle should be visible from being coated with dye, but will every particle give Pdot emission? We analyzed 842 fluorescent spots from multiple fields of view (representative image in Figure 2c). The total number of fluorescent spots due to hydroxy-Pdots was divided by the total number of Atto647N-amine fluorescent spots. This yielded a 96.8 ± 0.6% bright fraction.
The carboxy-Pdot bright fraction was similarly determined as 98.5 ± 0.4% (Supporting Information, Figure S4). A control where carboxy-Pdots were mixed with Atto647N-amine in the absence of carbodiimide activation did not show any spots in the Atto647N channel after Pdots were purified by gel filtration (Supporting Information, Figure S4). This clean background is consistent with the absence of noncovalent Pdot/dye association and the lack of bleed-through between the dye and Pdot fluorescence signals. This approach to measure the dark fraction is robust because large numbers of dyes can be conjugated per nanoparticle, so one needs neither to detect small numbers of photobleachable dyes per nanoparticle, nor to functionalize the nanoparticle with any particular protein.11
We determined the size of the hydroxy-Pdots by dynamic light scattering. Pdots before conjugation had a compact and uniform hydrodynamic diameter of 12.6 ± 0.2 nm and after streptavidin conjugation the hydrodynamic diameter was 19.0 ± 0.5 nm (Supporting Information, Figure S5). The substantial increase in size of the Pdots indicates efficient streptavidin conjugation on the Pdot surface via CDI.
To initially evaluate the compatibility of hydroxy-Pdots with a complex cellular environment, we established specific binding to human cells through chemical targeting. Hydroxy-Pdot–streptavidin was incubated with HeLa cells with or without biotin-N-hydroxysuccinimide (biotin–NHS) (Figure 3a). Pdots were efficiently targeted to the biotinylated cells and minimal nonspecific binding of Pdot–streptavidin was observed (Figure 3a), emphasized by the fact that nonspecific binding of individual Pdots would be visible. Using A431 cells, we also targeted Pdots to the epidermal growth factor receptor (EGFR), a tyrosine kinase important in cell proliferation and cancer (Figure 3b), so confirming that hydroxy-Pdots could label specific endogenously expressed receptors on mammalian cells and that hydroxy-Pdots showed low nonspecific binding in two distinct mammalian cell-lines. Streptavidin has been previously applied for Pdot targeting to cells with carboxy-Pdots and using biotinylated antibody recognition of α-tubulin or plasma membrane EpCAM.24 Pdots have also been targeted through RGD peptide to integrins, although the majority of these Pdots, assembled from a different conjugated polymer, underwent blinking.36
Figure 3.
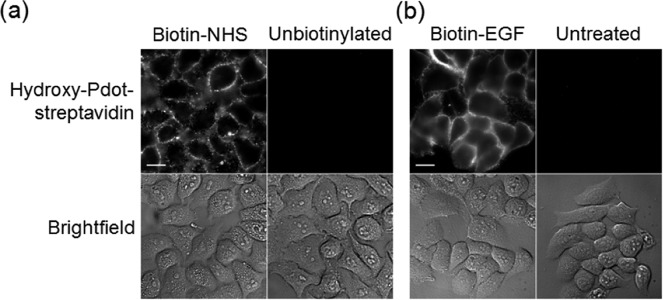
Low nonspecific cellular binding of hydroxy-Pdots. (a) HeLa cells incubated with 10 nM hydroxy-Pdot–streptavidin, with or without chemical biotinylation. (b) A431 cells were treated with biotin-EGF or untreated, followed by incubation with hydroxy-Pdot–streptavidin. The top row shows the Pdot fluorescence and the bottom row the brightfield image. Scale bars, 20 μm.
IGF1R is a tyrosine kinase regulating cell survival and differentiation, as well as a therapeutic target in diabetes and neurodegeneration; inhibitors of IGF1R have already showed success in cancer clinical trials.37 IGF1R activation at the plasma membrane takes place in a heterogeneous environment containing cholesterol-poor liquid-dynamic regions along with cholesterol-rich liquid-ordered regions (lipid rafts) having nanoscale dimensions (<200 nm). Bulk-scale analysis, based on lysed or fixed cells, indicates that ligand binding may promote IGF1R association with rafts38 and the presence of IGF1R in raft or nonraft regions can lead to different downstream pathway activation,38 but this is a phenomenon where study on live cells at the single particle level would enable new insight. Pdots have been previously imaged at the single molecule level and the brightness gives the potential for very high spatial resolution, down to 1 nm,39 but this was applied to nonspecifically targeted Pdots on fixed cells39 and may be complicated by fluctuations in the center of emission from the nanoparticle.40 There has been little use of Pdots to track individual proteins over time on live cells and gain insight into protein function. We used hydroxy-Pdots to determine the dynamics of IGF1R in the plasma membrane of live cells and to interrogate the cholesterol-dependence of IGF1R. We first validated that hydroxy-Pdot–streptavidin bound specifically to MCF-7 breast cancer cells (Figure 4a). We tracked hydroxy-Pdot movement at the single molecule level over time, fostered by the stable nonblinking Pdot emission. Single particle trajectories showed that hydroxy-Pdots bound to IGF1R underwent Brownian diffusion (Figure 4b). Methyl-β-cyclodextrin is a macrocycle widely used to deplete cholesterol from the plasma membrane of cells.38,41 With cholesterol depletion, diffusion of the hydroxy-Pdots was dramatically curtailed (Figure 4b), as quantitated by the significant decrease in diffusion coefficients and total velocity (Figure 4c), indicating the key role of cholesterol for organization of IGF1R nanodomains in the plasma membrane, which is expected to regulate protein movement and downstream signaling.42
Figure 4.
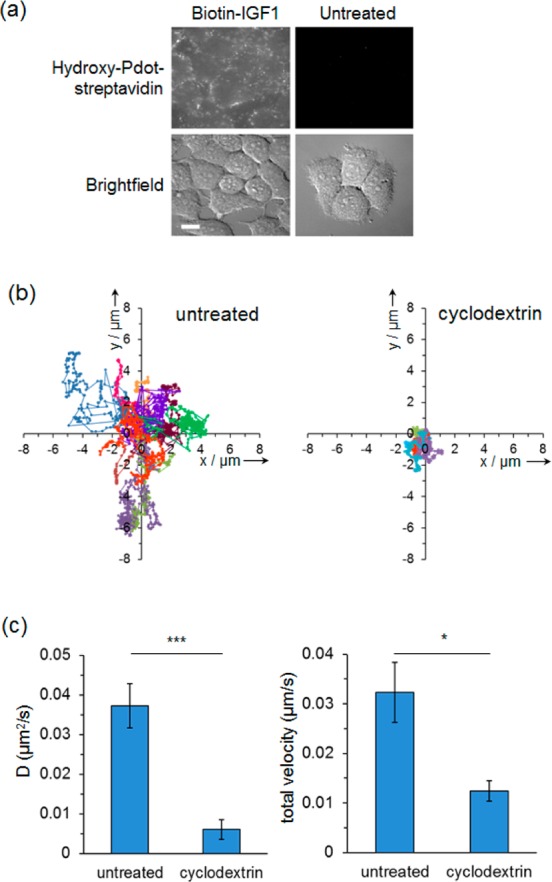
Effects of cholesterol depletion on IGF1R motility in the plasma membrane. (a) MCF-7 cells were incubated with biotin–IGF1 (left) or untreated (right), followed by hydroxy-Pdot–streptavidin, before live-cell wide-field fluorescence microscopy. Scale bar, 20 μm. (b) MCF-7 cells were labeled with biotin–IGF1 and Pdot–streptavidin and tracked at the apical surface. Trajectories in untreated (left) or cyclodextrin-treated cells (right) set to originate from (0, 0), with each of 10 trajectories given a different color. (c) Diffusion coefficient (mean ± s.e.m.) in untreated and cyclodextrin-treated cells: (∗∗∗), P < 0.001. (c) Total velocity (mean ± s.e.m.) in untreated and cyclodextrin-treated cells: (∗) P < 0.05.
Conclusion
We have demonstrated the generation of hydroxy-terminated conjugated polymer nanoparticles which have near-unity bright fraction. This minimal dark fraction will overcome a barrier to the use of fluorescent nanoparticles for quantitative single-molecule biological investigation. These hydroxy-Pdots have convenient 488 nm excitation, good quantum yield, do not blink, and the large Stokes shift facilitates seeing single particles amidst an autofluorescent or scattering environment. Their size is comparable to large proteins such as IgG antibodies. Surface functionalization with hydroxy-PEG led to high colloidal stability and low untargeted cell binding, but still allowed covalent functionalization with targeting ligands. Disadvantages of Pdots are that they bleach faster than QDs (but Pdots are substantially more photostable than dyes or fluorescent proteins)27 and Pdots have wider emission spectra than QDs.7,27 However, the majority of single molecule experiments use only 1 or 2 colors, where hydroxy-Pdots should perform well. Thus hydroxy-Pdots should be powerful tools for single molecule microscopy and ultrasensitive assays.
Methods
Materials
Semiconducting polymer poly[(9,9-dioctylfluorenyl-2,7-diyl)-co-(1,4-benzo-{2,1′,3}-thiadiazole)] (PFBT, Mw = 157 000, polydispersity = 3.0) was from American Dye Source. Poly[poly[(9,9-dioctylfluorenyl-2,7-diyl)0.95]-co-[4,7-di(thien-2-yl)-(1,4-benzo-{2,1′,3}-thiadiazole)0.05]] (PF–DBT5, Mw = 109 000, polydispersity = 3.1) polymer was synthesized and characterized by NMR, gel filtration chromatography, elemental analysis, and UV–visible spectroscopy according to previous reports.43,44 Amphiphilic comb-like polymers, polystyrene grafted with polyethylene glycol bearing terminal hydroxyl (PS–PEG–OH, main chain Mw = 6000, graft chain Mw = 4000, total chain Mw = 21 000, polydispersity = 1.24) or carboxyl groups (PS–PEG–COOH, main chain Mw = 8500, graft chain Mw = 4000, total chain Mw = 21 700, polydispersity = 1.25) were from Polymer Source.
Analytical grade organic solvents, including tetrahydrofuran (THF) and methanol, and 1,1′-carbonyl di-imidazole (CDI) were from Sigma-Aldrich. THF was dried before use using molecular sieves with an effective pore opening of 4 Å (Sigma-Aldrich). Core streptavidin was purified from Escherichia coli by inclusion body isolation and refolding, as described previously.45,46 Casein was purchased from Calbiochem and 10% solution in phosphate buffered saline pH 7.4 (PBS) was dialyzed overnight against PBS before use. All other reagents for buffer preparation were purchased from Fisher Scientific.
Pdot Synthesis and Streptavidin Conjugation
Red-emitting polymer semiconductor nanoparticles (Pdots) were synthesized from a blend of green and red-emitting semiconducting polymers PFBT and PF–DBT5 using a modified nanoprecipitation method.21,47 All experiments were performed at ambient temperature unless mentioned otherwise. An amount of 10 mg of PS–PEG–OH in 5 mL of dry THF was activated using 5 mg of CDI for 4 h with constant stirring at 25 °C, to give PS–PEG–CDI, which was immediately used without any further purification. In a typical Pdot synthesis, semiconducting core conjugated polymers PFBT, PF–DBT5, and amphiphilic functional coating polymer PS–PEG–CDI or PS–PEG–COOH were first dissolved individually in dry THF to make 1 mg/mL stock solutions. These three polymer solutions were then mixed in THF to give a PFBT concentration of 50 μg/mL, a PF–DBT5 concentration of 30 μg/mL, and PS–PEG–CDI or PS–PEG–COOH concentration of 150 μg/mL. Then the mixture was sonicated at 40 MHz at 25 °C for 5 min in a bath sonicator (Ultrawave Ltd.) filled with water. We quickly injected 3 mL polymer mixture into 10 mL Milli-Q water and sonicated again for 5 min in a bath sonicator. THF was removed at 25 °C in the dark using a rotary evaporator (Heidolph) with manual pressure control. The solution was filtered through a 0.2 μm filter (Millipore), concentrated to 2 mL using a 10 kDa cutoff filter (Millipore), and equilibrated in 50 mM sodium borate pH 8.4. The Pdot solution was stable for months stored at 4 °C without signs of aggregation. Immediately after synthesis of CDI-activated Pdots, 10 mg/mL core streptavidin in PBS was added to give a final concentration of 2 mg/mL and incubated at 25 °C for at least 24 h. Unconjugated core streptavidin was purified from Pdot–streptavidin using gel filtration chromatography, with an ÄKTAprime Plus chromatography system from Amersham Biosciences equipped with a Superose 6 10/300 GL column (GE Healthcare). PBS with 10% sucrose was the mobile phase with a flow rate of 0.3 mL/min and a typical injection volume of 1 mL. Protein elution was detected from A280 and Pdot elution from A460.
Pdot Dye Conjugation
Carboxy-Pdot (200nM) was activated with 1-ethyl-3-(3-dimethylaminopropyl)carbodiimide-hydrochloride (EDC, Sigma-Aldrich) and N-hydroxysulfosuccinimide (sulfoNHS, Sigma-Aldrich) in 50 mM 2-(N-morpholino)ethanesulfonic acid (MES, Fisher Scientific) at pH 6.0 for 30 min at 25 °C. Then 2 mM Atto647N amine dye (Atto-Tec GmbH) in 50 mM NaHCO3 pH 8.4 was added to the activated Pdot-COOH solution and reacted for 2 h at 25 °C in the dark. For hydroxy-Pdots, CDI-activated Pdots were incubated with 2 mM Atto647N amine in 50 mM sodium borate pH 8.4 and reacted for 24 h in the dark. Free Atto647N amine was purified from Pdot-dye conjugate using gel filtration chromatography as above. Elution of Pdots was monitored from A460 and elution of Pdot-dye conjugate from A647. In the control conjugation reaction, no EDC was added during activation.
Absorption and Fluorescence of Pdots
UV–vis absorption and fluorescence spectra were measured at 25 °C in PBS using a Spectramax M5 plate reader (Molecular Devices) and SoftMax Pro software. A clear flat-bottom 96-well plate from Fisher Scientific was used and both UV and fluorescence spectra were measured from the bottom of the plate. All spectra were measured on triplicate samples and were corrected for the intrinsic absorption and fluorescence from PBS. Absorption spectra were measured from 350 to 750 nm with 5 nm intervals. Atto647N amine dye was excited at 580 nm to acquire the emission spectrum. Fluorescence of Pdots and Pdot–dye conjugate was monitored from 510 to 750 nm, after 470 nm excitation.
The fluorescence quantum yield of Pdots was measured by comparison to a dilute solution (A460 = 0.09) of 4-(dicyanomethylene)-2-methyl-6-(p-dimethylaminostyryl)-4H-pyran (DCM, Sigma-Aldrich) in methanol, using the published DCM quantum yield of 0.43 as a standard.48 Solutions of Pdots in PBS and dye in methanol were optically matched at 460 nm, the excitation wavelength. Both absorption and fluorescence spectra of Pdots and dye were taken under identical measurement conditions. The integrated intensities of fluorescence spectra and corrected refractive index were used to calculate the quantum yield using the equation: QYPdot(PBS) = QYDCM(methanol) × (absorbanceDCM/absorbancePdot) × (integrated areaPdot/integrated areaDCM) × (ηPdot PBS)2/(ηDCM methanol)2.48 Our quantum yield was consistent with literature values for conjugated polymer nanoparticles.23
Lifetime Measurement
Samples in MQ water were excited at 407 nm using a picosecond diode laser (IBH-NanoLED-405, Horiba). The emission was collected in the perpendicular direction using magic angle polarization and a Hamamatsu MCP photomultiplier (model R-3809U-50). The instrument response function (IRF) was measured before fluorescence lifetime measurement using the scattered laser light from a dilute suspension of Ludox colloidal silica (Sigma). The time-correlated single photon counting (TCSPC) setup consisted of an Ortec 9327 pico-timing amplifier. The data were collected with a PCI-6602 interface card (National Instruments) as a multichannel analyzer. The typical full width at half maximum (fwhm) of the system response was ∼140 ps. Lifetime decay data were fitted using the IBH software to a single exponential function, except for the indicated traces fitted with a double exponential function. Quality of the fit was judged from the reduced chi-square value (χ2), calculated using the IBH software.
Hydrodynamic Size of Pdots
Dynamic light scattering was performed using a Viscotek 802 (Malvern Instruments). All samples and buffers were filtered through a 0.2 μm filter (Millipore) before analysis. Typical count rates were 100–300 kHz. Each autocorrelation function was acquired for 10 s, and averaged for 10 measurements. The resulting autocorrelation function was fitted using OmniSize 3.0 software (Malvern Instruments). Data were fit using the autocorrelation function with polystyrene as a mass model. Hydrodynamic diameters were obtained in PBS from a mass-weighted size distribution analysis and reported as the mean of triplicate measurements.
Zeta Potential Measurement
Zeta potential was determined with a Beckman Coulter Delsa Nano S Particle Analyzer, using a flow cell at 25 °C in PBS (pH 7.4), with an equilibration time of 60 s. Measurements were performed in triplicate with 20 accumulations with cell position at 0.7, 0.35, 0, −0.35, and −0.70 using a pinhole diameter of 20 μm. Data were analyzed using the Smoluchowski conversion equation in Delsa Nano Version 2.31/2.03 (Beckman Coulter Inc., India).
Effect of Calcium on the Stability of Pdots
A 10 μL portion of stock solution of 1.5 μM hydroxy-Pdots or carboxy-Pdots were added to 200 μL of Hank’s Balanced Salt Solution (HBSS) (137 mM NaCl, 5 mM KCl, 4.5 mM KH2PO4, 4 mM Na2HPO4, 5.5 mM glucose, and 4 mM NaHCO3) at pH 7.5 with and without 2 mM CaCl2. After 24 h at 25 °C in the dark, solutions were centrifuged at 23 °C for 10 min at 17 000g. The supernatant fluorescence was measured on the plate-reader as described above.
Microscopy
Imaging was performed using a wide-field DeltaVision Core fluorescent microscope (Applied Precision) with a 40× oil-immersion lens using softWoRx 3.6.2 software (Applied Precision). Pdots and QDs were imaged with 490DF20 excitation, 617DF73 emission, and a Chroma 84100bs polychroic filter set, using 0.5 s exposure. Atto647N was imaged with 640DF20 excitation, 685DF40 emission, and a Chroma 84100bs polychroic filter set, with 2 s exposure.
Fluorescence Intermittency Testing
Single-particle fluorescent emission over time for single Pdots was compared with single quantum dot 605-streptavidin conjugates (QD605-SA, Life Technologies). QD605-SA (1 nM) or 1 nM hydroxy-Pdots in PBS was centrifuged at 17 000g for 5 min at 4 °C and diluted to 10 pM in PBS. Then 300 μL of solutions were added on the top of an unmodified glass coverslip placed in a 48 well-plate and incubated for 10 min, sufficient to achieve adherence of occasional nanoparticles on the glass. Coverslips were washed with 500 μL of PBS and imaged in PBS with 0.2 s exposure time. The fluorescence intensity in each time frame was plotted as a percentage of the maximal intensity over the imaging period, after subtraction of the background signal from a nearby part of the coverslip.
Test of Pdot Bright Fraction
A glass coverslip (Fisher Scientific, coverslip no. 1 glass 22 mm × 22 mm) was cleaned with 1 M HCl for 2 h and washed thoroughly with Milli-Q water. Then the glass coverslip was dried using nitrogen flow. Purified Pdot-Atto647N conjugate at ∼0.5 μM was diluted 5000 times with PBS and pipetted onto a cleaned glass coverslip. After 10 min incubation, the coverslip was washed with 500 μL of PBS and imaged in PBS using a fluorescent microscope as above. A z-stack of 21 images was taken with 0.5 μm spacing, to avoid any impact from chromatic aberration. Stacked images were merged to an individual image and processed with the “smoothening” function in ImageJ. Then the image was mean-filtered with radius of 2 pixels and the brightness was adjusted in ImageJ. We analyzed 805 fluorescent spots for carboxy-Pdots and 842 spots for hydroxy-Pdots. The number of fluorescent puncta from Pdots was divided by the number of Atto647N puncta to give the bright fraction. The bright fraction plus the dark fraction equals 100%.
Cells and Cell Culture
MCF-7 (human breast adenocarcinoma cell line) and A431 (human epithelial carcinoma cell line) were from Cancer Research UK, Lincoln’s Inn Fields. HeLa (human cervical adenocarcinoma cell line) were from the American Type Culture Collection (ATCC). All cells were maintained in DMEM (Sigma-Aldrich) with 10% fetal calf serum (PAA), 50 U/mL penicillin. and 50 μg/mL streptomycin (Life Technologies) in a humidified atmosphere of 5% CO2/95% air at 37 °C.
Nonspecific Binding of Hydroxy- versus Carboxy-Pdots
MCF-7 cells, cooled to 4 °C in PBS for 5 min to minimize endocytosis, were incubated with 0–300 nM hydroxy-Pdots or carboxy-Pdots in PBS for 10 min at 4 °C. Cells were then washed four times with ice-cold PBS and imaged live in PBS with 5 mM MgCl2 (PBS–Mg).
Binding Specificity of Pdots to Mammalian Cells
In a 48-well plate HeLa cells were grown to 70–80% confluency. Biotin–NHS was generated by incubating 1 mM biotin (Sigma-Aldrich) with 500 mM EDC and 100 mM sulfoNHS in 50 mM MES pH 6.5 for 30 min at 25 °C and used without purification. The cells were washed with 500 μL of PBS–Mg three times. Then 5 μL of the above biotin–NHS solution was added to a well containing 500 μL of PBS–Mg and incubated for 15 min at 25 °C, before washing three times with PBS–Mg. Pdot–streptavidin (10 nM) in PBS with 1% bovine serum albumin (BSA, Merck Calbiochem) was added to each well and incubated for 30 min on ice. Cells were washed again three times with PBS–Mg and imaged live using a wide-field fluorescent microscope as described above. Different samples presented in the same figure were prepared, imaged, and analyzed under identical conditions.
EGF Receptor Imaging with Pdots
A431 cells were plated onto glass coverslips to give ∼50% confluency. Prior to experiments, cells were serum-starved in DMEM with 50 U/mL penicillin and 50 μg/mL streptomycin for 16 h. The cells were then placed on ice, washed with ice-cold PBS–Mg and treated with 50 nM biotin–EGF (Life Technologies) in PBS–Mg for 5 min on ice, or left untreated. After three washes in cold PBS–Mg, 20 nM hydroxy-Pdot–streptavidin in PBS–Mg with 1% dialyzed BSA was added to cells and allowed to bind for 5 min on ice. The cells were then washed again three times in PBS–Mg and imaged live in PBS–Mg.
IGF1R Imaging with Pdots
We plated 200 000 MCF-7 cells onto glass coverslips in a 48-well plate. Cells were incubated in DMEM with 50 U/mL penicillin and 50 μg/mL streptomycin for 16 h. The cells were then treated with DMEM with or without 10 mM methyl-β-cyclodextrin (Sigma-Aldrich) for 1 h at 37 °C. Cells were washed with PBS–Mg and treated with 20 nM biotinylated human des(1–3) insulin-like growth factor 1 (biotin–IGF1 from IBT) in PBS–Mg with 1% dialyzed casein for 15 min at 25 °C. Des(1–3) IGF1 binds to IGF1R as normal but minimizes interaction with IGF binding proteins (IGFBPs).49 Cells were washed three times in PBS–Mg and 30 nM hydroxy-Pdot–streptavidin in PBS–Mg with 1% casein was added to cells for 15 min at 25 °C. The cells were then washed again three times in PBS–Mg and imaged live in PBS–Mg at 37 °C.
Image Analysis
Time-lapse movies were processed using the fast Fourier transform (FFT) bandpass filter in ImageJ (v.1.46r; National Institutes of Health, USA), before the particles were tracked using View5D, an ImageJ plug-in developed by R. Heintzmann (King’s College London, UK). The quality of the tracking was verified visually for each frame. Particle coordinates, total velocity (distance between the first and last time point of the trajectory divided by the time between the first and last time point of the trajectory), and mean square displacement (MSD) values were calculated by View5D. Diffusion coefficients (D) were acquired by either fitting the whole MSD curve or the linear region (first six points) of the MSD curve using the equation MSD = 4DΔt.50
Statistical Testing
To calculate the standard error of the bright fraction, we used the equation for the standard error of binary variables:
where p is the percentage of bright Pdots and n is the number of observations. Statistical analysis on single particle tracking (unpaired t test) was performed using GraphPad Prism v. 5.02 (GraphPad Software) with n = 27 for untreated cells and n = 11 for cyclodextrin-treated cells. Statistical analysis on stability in calcium-containing buffers (mean ±1 s.d., n = 3, unpaired t test) was performed using GraphPad online calculator (http://www.graphpad.com/quickcalcs/ttest1.cfm).
Acknowledgments
A.L.K. was supported by the Human Frontier Science Program (ref LT000452/2010-C), Q.H. by the National Science Foundation China (Grant No. 50803021), and A.L.K., D.K., D.J.S., and M.H. by the Wellcome Trust. A.L.K thanks Central Instrumentation Facility (CIF), IISER, Bhopal, for assistance with TCSPC and zeta potential experiments.
Author Present Address
§ Department of Chemistry, IISER Bhopal, ITI (Gas Rahat) Building, Govindpura, Bhopal, 462 023, Madhya Pradesh, India.
Supporting Information Available
Figures S1–S5 and Table S1 as described in the text. This material is available free of charge via the Internet at http://pubs.acs.org.
The authors declare no competing financial interest.
Supplementary Material
References
- Pertsinidis A.; Zhang Y.; Chu S. Subnanometre Single-Molecule Localization, Registration and Distance Measurements. Nature 2010, 466, 647–651. [DOI] [PubMed] [Google Scholar]
- Patterson G.; Davidson M.; Manley S.; Lippincott-Schwartz J. Superresolution Imaging Using Single-Molecule Localization. Annu. Rev. Phys. Chem. 2010, 61, 345–367. [DOI] [PMC free article] [PubMed] [Google Scholar]
- Carlton P. M.; Boulanger J.; Kervrann C.; Sibarita J. B.; Salamero J.; Gordon-Messer S.; Bressan D.; Haber J. E.; Haase S.; Shao L.; et al. Fast Live Simultaneous Multiwavelength Four-Dimensional Optical Microscopy. Proc. Natl. Acad. Sci. U.S.A. 2010, 107, 16016–16022. [DOI] [PMC free article] [PubMed] [Google Scholar]
- Burns A.; Sengupta P.; Zedayko T.; Baird B.; Wiesner U. Core/Shell Fluorescent Silica Nanoparticles for Chemical Sensing: Towards Single-Particle Laboratories. Small 2006, 2, 723–726. [DOI] [PubMed] [Google Scholar]
- Taylor J. R.; Fang M. M.; Nie S. Probing Specific Sequences on Single DNA Molecules with Bioconjugated Fluorescent Nanoparticles. Anal. Chem. 2000, 72, 1979–1986. [DOI] [PubMed] [Google Scholar]
- Lisse D.; Wilkens V.; You C.; Busch K.; Piehler J. Selective Targeting of Fluorescent Nanoparticles to Proteins inside Live Cells. Angew. Chem., Int. Ed. 2011, 50, 9352–9355. [DOI] [PubMed] [Google Scholar]
- Pinaud F.; Clarke S.; Sittner A.; Dahan M. Probing Cellular Events, One Quantum Dot at a Time. Nat. Methods 2010, 7, 275–285. [DOI] [PubMed] [Google Scholar]
- Choi S.; Dickson R. M.; Yu J. Developing Luminescent Silver Nanodots for Biological Applications. Chem. Soc. Rev. 2012, 41, 1867–1891. [DOI] [PubMed] [Google Scholar]
- Vaijayanthimala V.; Chang H. C. Functionalized Fluorescent Nanodiamonds for Biomedical Applications. Nanomedicine (London) 2009, 4, 47–55. [DOI] [PubMed] [Google Scholar]
- Lee S. F.; Osborne M. A. Brightening, Blinking, Bluing and Bleaching in the Life of a Quantum Dot: Friend or Foe?. ChemPhysChem 2009, 10, 2174–2191. [DOI] [PubMed] [Google Scholar]
- Yao J.; Larson D. R.; Vishwasrao H. D.; Zipfel W. R.; Webb W. W. Blinking and Nonradiant Dark Fraction of Water-Soluble Quantum Dots in Aqueous Solution. Proc. Natl. Acad. Sci. U.S.A. 2005, 102, 14284–14289. [DOI] [PMC free article] [PubMed] [Google Scholar]
- Ebenstein Y.; Mokari T.; Banin U. Fluorescence Quantum Yield of CdSe/ZnS Nanocrystals Investigated by Correlated Atomic-Force and Single-Particle Fluorescence Microscopy. Appl. Phys. Lett. 2002, 80, 4033–4035. [Google Scholar]
- Pons T.; Medintz I. L.; Farrell D.; Wang X.; Grimes A. F.; English D. S.; Berti L.; Mattoussi H. Single-Molecule Colocalization Studies Shed Light on the Idea of Fully Emitting versus Dark Single Quantum Dots. Small 2011, 7, 2101–2108. [DOI] [PubMed] [Google Scholar]
- Garcia-Parajo M. F.; Segers-Nolten G. M.; Veerman J. A.; Greve J.; van Hulst N. F. Real-Time Light-Driven Dynamics of the Fluorescence Emission in Single Green Fluorescent Protein Molecules. Proc. Natl. Acad. Sci. U.S.A. 2000, 97, 7237–7242. [DOI] [PMC free article] [PubMed] [Google Scholar]
- Moerner W. E. Single-Molecule Optical Spectroscopy of Autofluorescent Proteins. J. Chem. Phys. 2002, 117, 10925–10937. [Google Scholar]
- Crozat E.; Meglio A.; Allemand J. F.; Chivers C. E.; Howarth M.; Venien-Bryan C.; Grainge I.; Sherratt D. J. Separating Speed and Ability to Displace Roadblocks During DNA Translocation by FtsK. EMBO J. 2010, 29, 1423–1433. [DOI] [PMC free article] [PubMed] [Google Scholar]
- Lee J. Y.; Finkelstein I. J.; Crozat E.; Sherratt D. J.; Greene E. C. Single-Molecule Imaging of DNA Curtains Reveals Mechanisms of KOPS Sequence Targeting by the DNA Translocase FtsK. Proc. Natl. Acad. Sci. U.S.A. 2012, 109, 6531–6536. [DOI] [PMC free article] [PubMed] [Google Scholar]
- Scholl B.; Liu H. Y.; Long B. R.; McCarty O. J.; O’Hare T.; Druker B. J.; Vu T. Q. Single Particle Quantum Dot Imaging Achieves Ultrasensitive Detection Capabilities for Western Immunoblot Analysis. ACS Nano 2009, 3, 1318–1328. [DOI] [PubMed] [Google Scholar]
- Pecher J.; Mecking S. Nanoparticles of Conjugated Polymers. Chem. Rev. 2010, 110, 6260–6279. [DOI] [PubMed] [Google Scholar]
- Feng X. L.; Liu L. B.; Wang S.; Zhu D. B. Water-Soluble Fluorescent Conjugated Polymers and their Interactions with Biomacromolecules for Sensitive Biosensors. Chem. Soc. Rev. 2010, 39, 2411–2419. [DOI] [PubMed] [Google Scholar]
- Szymanski C.; Wu C.; Hooper J.; Salazar M. A.; Perdomo A.; Dukes A.; McNeill J. Single Molecule Nanoparticles of the Conjugated Polymer MEH-PPV, Preparation and Characterization by Near-Field Scanning Optical Microscopy. J. Phys. Chem. B 2005, 109, 8543–8546. [DOI] [PubMed] [Google Scholar]
- Green M.; Howes P.; Berry C.; Argyros O.; Thanou M. Simple Conjugated Polymer Nanoparticles as Biological Labels. Proc. R. Soc. A 2009, 465, 2751–2759. [Google Scholar]
- Wu C.; Hansen S. J.; Hou Q.; Yu J.; Zeigler M.; Jin Y.; Burnham D. R.; McNeill J. D.; Olson J. M.; Chiu D. T. Design of Highly Emissive Polymer Dot Bioconjugates for in Vivo Tumor Targeting. Angew. Chem., Int. Ed. 2011, 50, 3430–3434. [DOI] [PMC free article] [PubMed] [Google Scholar]
- Wu C.; Schneider T.; Zeigler M.; Yu J.; Schiro P. G.; Burnham D. R.; McNeill J. D.; Chiu D. T. Bioconjugation of Ultrabright Semiconducting Polymer Dots for Specific Cellular Targeting. J. Am. Chem. Soc. 2010, 132, 15410–15417. [DOI] [PMC free article] [PubMed] [Google Scholar]
- Feng X. L.; Tang Y. L.; Duan X. R.; Liu L. B.; Wang S. Lipid-Modified Conjugated Polymer Nanoparticles for Cell Imaging and Transfection. J. Mater. Chem. 2010, 20, 1312–1316. [Google Scholar]
- Kaeser A.; Schenning A. P. Fluorescent Nanoparticles Based on Self-Assembled Pi-Conjugated Systems. Adv. Mater. 2010, 22, 2985–2997. [DOI] [PubMed] [Google Scholar]
- Wu C.; Bull B.; Szymanski C.; Christensen K.; McNeill J. Multicolor Conjugated Polymer Dots for Biological Fluorescence Imaging. ACS Nano 2008, 2, 2415–2423. [DOI] [PMC free article] [PubMed] [Google Scholar]
- Yan M.; Rothberg L. J.; Papadimitrakopoulos F.; Galvin M. E.; Miller T. M. Defect Quenching of Conjugated Polymer Luminescence. Phys. Rev. Lett. 1994, 73, 744–747. [DOI] [PubMed] [Google Scholar]
- Lynch I.; Cedervall T.; Lundqvist M.; Cabaleiro-Lago C.; Linse S.; Dawson K. A. The Nanoparticle-Protein Complex as a Biological Entity; A Complex Fluids and Surface Science Challenge for the 21st Century. Adv. Colloid Interface Sci. 2007, 134–135, 167–174. [DOI] [PubMed] [Google Scholar]
- Rivera-Gil P.; Jimenez De Aberasturi D.; Wulf V.; Pelaz B.; Del Pino P.; Zhao Y.; De La Fuente J. M.; Ruiz De Larramendi I.; Rojo T.; Liang X. J.; et al. The Challenge to Relate the Physicochemical Properties of Colloidal Nanoparticles to their Cytotoxicity. Acc. Chem. Res. 2012, 10.1021/ar300039j. [DOI] [PubMed] [Google Scholar]
- Hennig A.; Borcherding H.; Jaeger C.; Hatami S.; Wurth C.; Hoffmann A.; Hoffmann K.; Thiele T.; Schedler U.; Resch-Genger U. Scope and Limitations of Surface Functional Group Quantification Methods: Exploratory Study with Poly(acrylic acid)-Grafted Micro- and Nanoparticles. J. Am. Chem. Soc. 2012, 134, 8268–8276. [DOI] [PubMed] [Google Scholar]
- Zhang X.; Yu J.; Wu C.; Jin Y.; Rong Y.; Ye F.; Chiu D. T. Importance of Having Low-Density Functional Groups for Generating High-Performance Semiconducting Polymer Dots. ACS Nano 2012, 6, 5429–5439. [DOI] [PMC free article] [PubMed] [Google Scholar]
- Howes P.; Green M.; Levitt J.; Suhling K.; Hughes M. Phospholipid Encapsulated Semiconducting Polymer Nanoparticles: Their Use in Cell Imaging and Protein Attachment. J. Am. Chem. Soc. 2010, 132, 3989–3996. [DOI] [PubMed] [Google Scholar]
- Pathak S.; Choi S. K.; Arnheim N.; Thompson M. E. Hydroxylated Quantum Dots as Luminescent Probes for in Situ Hybridization. J. Am. Chem. Soc. 2001, 123, 4103–4104. [DOI] [PubMed] [Google Scholar]
- Hofer A. M.; Brown E. M. Extracellular Calcium Sensing and Signalling. Nat. Rev. Mol. Cell Biol. 2003, 4, 530–538. [DOI] [PubMed] [Google Scholar]
- Li Y.; Liu J.; Liu B.; Tomczak N. Highly Emissive PEG–Encapsulated Conjugated Polymer Nanoparticles. Nanoscale. 2012, 4, 5694–5702. [DOI] [PubMed] [Google Scholar]
- Chitnis M. M.; Yuen J. S.; Protheroe A. S.; Pollak M.; Macaulay V. M. The Type 1 Insulin-like Growth Factor Receptor Pathway. Clin. Cancer Res. 2008, 14, 6364–6370. [DOI] [PubMed] [Google Scholar]
- Manes S.; Mira E.; Gomez-Mouton C.; Lacalle R. A.; Keller P.; Labrador J. P.; Martinez A. Membrane Raft Microdomains Mediate Front-Rear Polarity in Migrating Cells. EMBO J. 1999, 18, 6211–6220. [DOI] [PMC free article] [PubMed] [Google Scholar]
- Yu J.; Wu C.; Sahu S. P.; Fernando L. P.; Szymanski C.; McNeill J. Nanoscale 3D Tracking with Conjugated Polymer Nanoparticles. J. Am. Chem. Soc. 2009, 131, 18410–18414. [DOI] [PubMed] [Google Scholar]
- Yu J.; Wu C.; Tian Z.; McNeill J. Tracking of Single Charge Carriers in a Conjugated Polymer Nanoparticle. Nano Lett. 2012, 12, 1300–1306. [DOI] [PubMed] [Google Scholar]
- Christian A. E.; Haynes M. P.; Phillips M. C.; Rothblat G. H. Use of Cyclodextrins for Manipulating Cellular Cholesterol Content. J. Lipid Res. 1997, 38, 2264–2272. [PubMed] [Google Scholar]
- Orr G.; Hu D.; Ozcelik S.; Opresko L. K.; Wiley H. S.; Colson S. D. Cholesterol Dictates the Freedom of EGF Receptors and HER2 in the Plane of the Membrane. Biophys. J. 2005, 89, 1362–1373. [DOI] [PMC free article] [PubMed] [Google Scholar]
- Hou Q.; Zhou Q. M.; Zhang Y.; Yang W.; Yang R. Q.; Cao Y. Synthesis and Electroluminescent Properties of High-Efficiency Saturated Red Emitter Based on Copolymers from Fluorene and 4,7-Di(4-hexylthien-2-yl)-2,1,3-Benzothiadiazole. Macromolecules 2004, 37, 6299–6305. [Google Scholar]
- Huang J.; Xu Y. S.; Hou Q.; Yang W.; Yuan M.; Cao Y. Novel Red Electroluminescent Polymers Derived from Carbazole and 4,7-Bis(2-thienyl)-2,1,3-benzothiadiazole. Macromol. Rapid Commun. 2002, 23, 709–712. [Google Scholar]
- Chivers C. E.; Crozat E.; Chu C.; Moy V. T.; Sherratt D. J.; Howarth M. A Streptavidin Variant with Slower Biotin Dissociation and Increased Mechanostability. Nat. Methods 2010, 7, 391–393. [DOI] [PMC free article] [PubMed] [Google Scholar]
- Howarth M.; Ting A. Y. Imaging Proteins in Live Mammalian Cells with Biotin Ligase and Monovalent Streptavidin. Nat. Protoc. 2008, 3, 534–545. [DOI] [PMC free article] [PubMed] [Google Scholar]
- Kurokawa N.; Yoshikawa H.; Hirota N.; Hyodo K.; Masuhara H. Size-Dependent Spectroscopic Properties and Thermochromic Behavior in Poly(substituted thiophene) Nanoparticles. ChemPhysChem 2004, 5, 1609–1615. [DOI] [PubMed] [Google Scholar]
- Eaton D. F. Reference Materials for Fluorescence Measurement. Pure Appl. Chem. 1988, 60, 1107–1114. [Google Scholar]
- Ross M.; Francis G. L.; Szabo L.; Wallace J. C.; Ballard F. J. Insulin-like Growth Factor (IGF)-Binding Proteins Inhibit the Biological Activities of IGF-1 and IGF-2 but Not Des-(1–3)-IGF-1. Biochem. J. 1989, 258, 267–272. [DOI] [PMC free article] [PubMed] [Google Scholar]
- Saxton M. J.; Jacobson K. Single-Particle Tracking: Applications to Membrane Dynamics. Annu. Rev. Biophys. Biomol. Struct. 1997, 26, 373–399. [DOI] [PubMed] [Google Scholar]
Associated Data
This section collects any data citations, data availability statements, or supplementary materials included in this article.