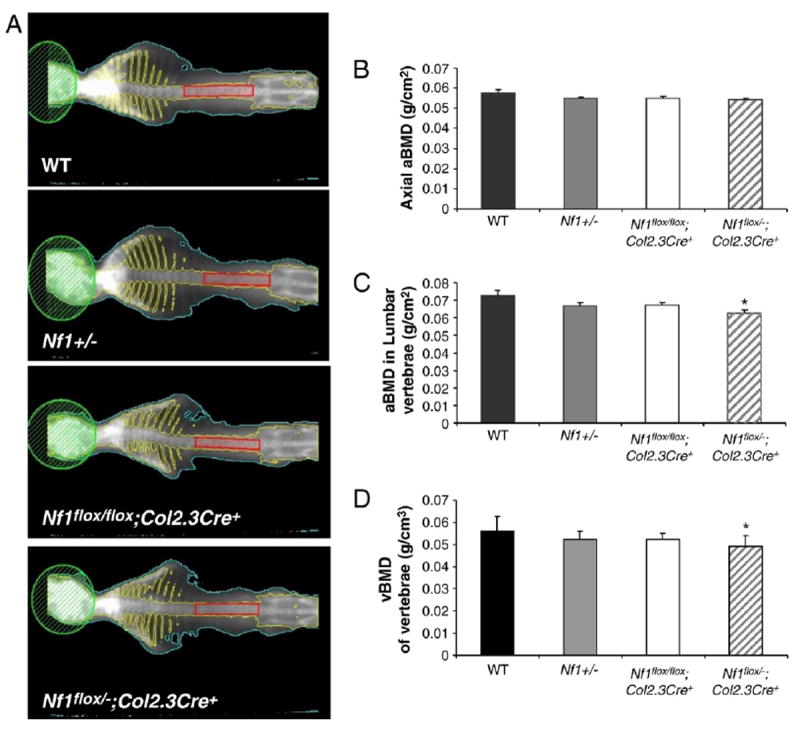
Fig. 2.

Reduced bone mineral density (BMD) in the L1–L5 vertebrae of Nf1flox/−;Col2.3Cre+ mice. (A) Representative photographs of DEXA. Skull area was excluded from the total axial bone scan. The region enclosed by the red rectangle includes the L1–L5 vertebrae. (B) Total axial BMD (g/cm2). Data represent the mean ± SEM of 9 mice in each genotype group. (C) BMD of the L1–L5 region. Data are the mean ± SEM of 9 mice in each genotype group. *p<0.05 for Nf1flox/−;Col2.3Cre+ mice vs. WT controls as determined by ANOVA and multiple-comparison post-hoc t-tests. (D) Lumbar vBMD of L1–L5 region. Data are the mean ± SEM of 9 mice in each genotype group. *p<0.05 for Nf1flox/−;Col2.3Cre+ mice vs. WT controls as determined by ANOVA and multiple-comparison post-hoc t-tests.
