

Abstract
Oligonucleotide hybridization was used as a cell-labeling method to significantly amplify the loading of magnetic probes onto target cells. The method utilized short oligonucleotides as the binding agents between antibodies and superparamagnetic iron oxide. This method not only enabled multiplexed analysis, but also allowed detection of multiple markers on a single sample containing only scant cell numbers.
Keywords: magnetic labeling, oligonucleotide hybridization, magnetic resonance, multiplexed analysis, signal amplification
Magnetic cell labeling has become an important biodiagnostic tool for cell separation,[1, 2] magnetic sensing,[3–7] therapeutic applications,[8] and magnetic resonance imaging.[9, 10] Targeting magnetic nanoprobes (MNPs) to select cell types usually relies on the use of antibodies or other smaller molecules as affinity ligands, which bind the MNPs either via a one-step conjugate addition[11, 12] or via a two-step method.[13] Irrespective of the approach used, further improvement on existing technology has proven challenging, particularly when such questions need to be addressed: (i) can the labeling technique be used for multiplexing, i.e. can it identify multiple biomarkers in the same cells? (ii) how successfully does the method amplify analytical signals to detect scarce targets? and (iii) how biocompatible and stable is the method for use on live or fixed cells? In a bid to address these challenges, we herein report on a highly sensitive and multiplexable cell-labeling method that considerably amplifies MNP-loading onto targeted cells. Based on the magnetic barcoding approach,[14] the method utilizes oligonucleotides to link affinity ligands to MNPs. The sequence-specific hybridization between oligonucleotides then enables highly selective amplification of MNP-loading onto target cellular markers. To validate this method, we initially performed surface plasmon resonance measurements. We subsequently demonstrated that the method can be used not only for labeling of specific growth factor receptors, but also for in vitro detection and molecular profiling of human cancer cells from biological samples.
The developed method has three components (Figure S1): 1) oligonucleotide modified monoclonal antibodies (mAb-DNA), 2) linker oligonucleotide strands (L-DNA), and 3) oligonucleotide modified MNPs (MNP-DNA).[15–17] Cellular markers of interest are first labeled with mAb-DNA, before L-DNA and MNP-DNA with complementary sequences are sequentially applied. This method offers high versatility in magnetic labeling. For example, L-DNA and MNP-DNA can be repeatedly applied to form multiple MNP-layers and can thus amplify particle loading onto cells (Figure S1a). By using pairs of L-DNA and MNP-DNA with different complementary sequences, biomarkers can be selectively and individually labeled for multiplexed molecular profiling (Figure S1b).
We initially characterized the affinity and binding kinetics of the new labeling method using surface plasmon resonance (SPR). Magnetic probes were prepared by conjugating thiol-modified oligonucleotides to cross-linked dextran coated iron oxide particles via heterobifunctional crosslinker (see Methods). Using fluorescein-labeled oligonucleotides for conjugation, we determined that each MNP-DNA probe had approximately 50 oligonucleotide strands. Mimicking mAb-DNA, biotinylated oligonucleotides were immobilized onto a streptavidin-coated SPR sensor chip. The subsequent sequential injection of L-DNA and MNP-DNA probes led to an increase in SPR signal (Figure 1), confirming probe binding. Furthermore, the repeated addition of L-DNA and MNP-DNA with complementary oligonucleotides resulted in a linear increase in signal intensity, which served as an indicator for the formation of multilayers of MNPs. We also compared the binding kinetics of MNP-DNA conjugates to that of the free oligonucleotides (Figure S2). MNP-DNA showed a faster association with the immobilized strands as well as higher binding stability compared to the free oligonucleotides. Consequently, MNP-DNA assumed much lower binding dissociation constant KD (56 pM) than the free oligonucleotides (1400 pM). This higher binding affinity is presumably the result of the multiple binding valency of MNP-DNA compared to that of a free oligonucleotide.[18]
Figure 1.
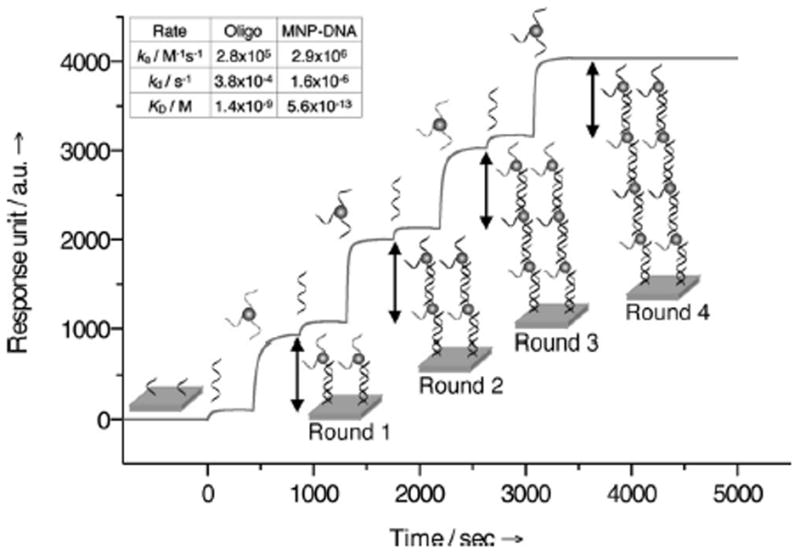
Binding kinetics of MNP-DNA probes measured by surface plasmon resonance. L-DNA and MNP-DNA flowed over the immobilized oligonucleotide strands to initiate the layering (round 1). The processes were then repeated for multiple layering rounds. The small and large increase in the sensorgram reflects the binding of L-DNA and MNP-DNA, respectively. The rate constants (inset) for the free oligonucleotides and MNP-DNA were determined by flowing them at different concentrations (see Supporting Information).
We next applied this three-component method to the labeling of cellular targets. Here, we showed that the method resulted in amplification of both the magnetization and fluorescence signal intensity. As a model system, we targeted the HER2/neu receptors on SK-BR-3 breast cancer cells (~2×10⁶ receptors/cell). Thiol-modified oligonucleotides were conjugated to anti-HER2 antibodies (HER2-DNA) using a similar procedure to that of MNP conjugation. Each antibody had approximately 8 oligonucleotides as measured by absorbance and protein assays. Cells were initially incubated with HER2-DNA, before L-DNA and MNP-DNA were sequentially added. For signal amplification, the latter steps (L-DNA and MNP-DNA addition) were then repeated. Figure 2a shows a series of fluorescent micrographs during three rounds of MNP labeling. To determine whether subsequent rounds of labeling targeted the same structural components, we used MNP-DNA constructs containing different fluorophores (VT680, FITC, and AF568 for the first, second and third round, respectively). Co-localization of the three colors (Figure 2a) confirmed a highly specific amplification of the select marker (HER2/neu). Control experiments showed negligible fluorescence in identically treated non-targeted cells (Figure S3).
Figure 2.
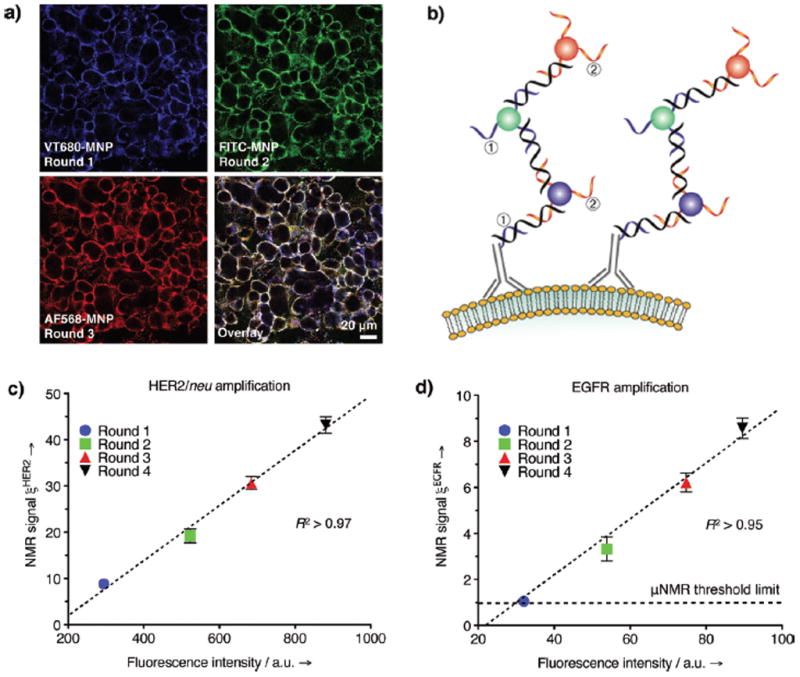
Amplification via successive labeling of the same receptor. (a) Multiple rounds of labeling using fluorescent MNP-DNA targeted to HER2/neu: VT680-MNP for first round, FITC-MNP for second round, and AF568-MNP for third round; a schematic of the process is shown in (b). μNMR measurements of SK-BR-3 cells labeled with MNP-DNA targeted to either (c) HER2/neu or (d) EGFR receptors. The displayed NMR signal ξmAb was determined by the ratio between the targeted sample Δr2mAb and the nontargeted control Δr2ø. The increase in NMR signal following multiple rounds of labeling was correlated with separate flow cytometry measurements (Figure S7, S9).
To test the stability of the probes against enzymatic digestion, we next added DNase to the samples during the labeling process. Although the presence of a large excess of DNAse resulted in a substantial decrease in labeling, it was possible to circumvent this problem by substituting L-DNA with morpholino oligonucleotides (Figure S4). We also tested alternative MNP-DNA probes, which were designed to directly hybridize with targeted mAb-DNA without the need for L-DNA (Figure S5). Although this alternative labeling method was satisfactory and required less time, the overall signal amplification was lower compared to the method using L-DNA. In addition, the multi-step labeling with oligonucleotide hybridization was far more effective than direct labeling with MNP-mAb immunoconjugates (Figure S6).
The labeling efficacy of the oligonucleotide method was quantitatively analyzed using flow cytometry and micro nuclear magnetic resonance (μNMR; Figure 2c).[19] Samples were prepared by targeting SK-BR-3 cells in suspension with HER2-DNA, followed by multiple rounds of L-DNA and fluorescent MNP-DNA probe applications. For the μNMR detection, a miniature NMR system (1 μL detection volume) was used to measure the changes in transverse relaxation rate (Δ R2) of samples.[19] The measured Δ R2 value was then converted to depict cellular relaxivity Δ r2 (R2 divided by cell concentration), a value which is proportional to the number of MNPs per cell.[4, 19] The expression level of the target marker was then measured as ξmAb = Δr2mAb/Δr2ø, where Δr2mAb and Δr2ø represent cellular relaxivities for marker-specific and control MNPs, respectively. From our results, an excellent correlation was observed between fluorescence intensity and the μNMR signal (ξHER2; Figure 2c). Furthermore, both signals increased linearly with each round of labeling (Figure S7), reflecting the linear increase of targeted MNPs as seen in SPR measurements (Figure 1). Importantly, the multiple rounds of MNP-loading were found to significantly enhance the detection sensitivity of μNMR. Indeed, after four rounds of magnetic labeling, the MNP-DNA targeting the HER2/neu marker, was able to detect fewer than 20 cells (Figure S8). In contrast, a single round of labeling had a detection threshold of 150 cells.
Since HER2/neu on SK-BR-3 cells represents an abundant cellular target, we subsequently chose to apply the method to the detection of a less abundant cellular marker. Given its low expression level (8×10⁴ receptors/cell) in SK-BR-3 cells, we thus selected epidermal growth factor receptor (EGFR) as our target. After a single round of magnetic targeting, the measured ξEGFR was only slightly higher than that of control samples (Figure 2d). However, after four rounds of MNP-DNA labeling, the NMR signal was markedly higher (9-fold), which enabled robust identification of the marker in small number of cells (~200; Figure S8) Concurrent experiments, using fluorescence methods, supported this signal amplification (Figure S9); the cells showed only negligible staining after the first round of labeling, but had distinct fluorescence after four rounds.
In a recent clinical study, we showed that accurate clinical diagnosis is possible from a sample containing a few hundred cells.[19] Since the current method potentially increases overall signal intensity with continuing rounds of labeling (Figure S10), it is perceivable that such diagnosis could be extended to scant cell populations that have low expression of disease markers. It is also worth noting that the detection sensitivity could also be enhanced by using nanomaterials with higher magnetization, and by applying the same amplification scheme.[5, 20]
After demonstrating the effectiveness of the amplification method, we subsequently designed a set of labeling experiments, in which we combined multiplexed analysis with signal amplification, to take advantage of the hybridization specificity between oligonucleotide strands. For multiplexed labeling, we initially prepared separate mAb-DNA conjugates targeted to three cancer markers of interest: HER2/neu, EGFR, and EpCAM (epithelial cell adhesion molecule). Fluorescent secondary antibodies were then used to verify that the chemically modified antibodies retained their binding efficacy (Figure S11). For fluorescence detection, cells were incubated with all three mAb-DNA conjugates, together with L-DNA. This was followed by the simultaneous addition of their respective complementary MNP-DNAs. With each MNP-DNA probe containing a distinct fluorophore (FITC for HER2/neu, VT680 for EpCAM, and AF568 for EGFR), all labeled biomarkers could be distinguished concurrently (Figure 3a). All probes showed specific binding to their corresponding surface markers, and negligible crosstalk occurred (as validated in control inhibition experiments; Figure S12)
Figure 3.
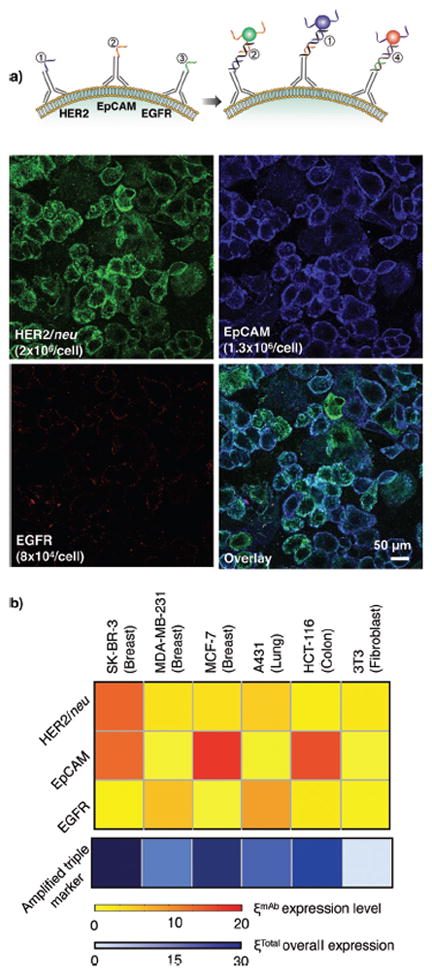
Multiplexed labeling of different receptors. a) Incubation of SK-BR-3 cells with multiple mAb-DNA conjugates allowed for their specific labeling with complementary MNP-DNA conjugates. While HER2/neu and EpCAM were highly expressed, EGFR was poorly expressed, in these cells. b) A panel of cancer cell lines and a fibroblast control (3T3) were mixed with all mAb-DNA conjugates, sequentially labeled with MNP-DNA conjugates, and individually profiled with μNMR. The increase in ξmAb corresponded to the marker expression level during each successive measurement on the same cell sample. Combining and amplifying the labeled triple marker signals enhanced diagnostic accuracy.
Lastly, we applied multiplexed profiling, together with a round of amplification, to μNMR-based cellular detection. After simultaneously labeling three extracellular markers with different mAb-DNAs (and their respective L-DNA), we then added MNP-DNAs specific for HER2-DNA strands and performed a μNMR assay to measure the HER2/neu expression level (ξHER2). We subsequently repeated the labeling and μNMR measurement of the same sample in order to sequentially screen for EpCAM and EGFR expression. Once the magnetic labeling of all three markers was complete, a further round of MNP-DNA probes was added to amplify the overall μNMR signal from all markers. The expression level of each marker was then estimated by the difference in NMR signal between consecutive μNMR measurements. For example, after a round of HER2/neu and EpCAM labeling, the μNMR measurements yielded ξHER2 and ξHER2+EpCAM, from which ξEpCAM (=ξHER2+EpCAM − ξHER2) could be obtained. Using this approach, we were able to profile the expression level of multiple markers from a single sample (Figure 3b), in a similar manner to fluorescence detection but with far fewer cell numbers (<1,000 cells). The μNMR results likewise showed a good correlation with those from flow cytometry (Figures S13 and S14). Furthermore, the signal amplification after three-marker targeting enhanced the overall NMR signal (ξTotal), which significantly improved the detection accuracy. Note that the minimal receptor density detectable without amplification (i.e., ξmAb > 1) was ~1×10⁴ receptors/ cell. This value was estimated from Δr2ø/r2, where Δr2ø (= 1×10⁻¹¹ L·s−1) is the cellular relaxivity with control MNPs and r2 (= 1×10⁻¹⁵ L·s−1) is the relaxivity of MNPs used.
In summary, we demonstrate that a three-component oligonucleotide method can be used for multiplexed magnetic labeling as well as for signal amplification. Kinetics measurements showed that the binding of MNP-DNAs was fast, stable, and specific. Subsequent magnetic labeling using the MNP-DNA conjugates then allowed for selective amplification of MNP-loading on target cellular markers. It is likely that the described method could enhance magnetic cell labeling for a broad range of diagnostic, therapeutic, and imaging applications.
Supplementary Material
Footnotes
We thank S. S. Agasti, R. Mazitschek, T. Reiner, and H. Shao for helpful discussions; I. Bagayev, A. Chudnovskiy, V. Cortez-Retamozo, and A. Newton for assistance in cell experiments; N. Sergeyev for providing the cross-linked iron oxide particles; Y. Fisher-Jeffes for reviewing the manuscript. This work was supported in part by National Institute of Health Grants R01-EB004626, U54-CA119349, and TPEN contract (HHSN268201000044C). Supporting information is available online from Wiley InterScience or from the author.
Contributor Information
Dr. Monty Liong, Center for Systems Biology, Massachusetts General Hospital/Harvard Medical School, 185 Cambridge St., Boston, MA 02114 (USA)
Dr. Carlos Tassa, Center for Systems Biology, Massachusetts General Hospital/Harvard Medical School, 185 Cambridge St., Boston, MA 02114 (USA)
Dr. Stanley Y. Shaw, Center for Systems Biology, Massachusetts General Hospital/Harvard Medical School, 185 Cambridge St., Boston, MA 02114 (USA)
Prof. Hakho Lee, Email: hlee@mgh.harvard.edu, Center for Systems Biology, Massachusetts General Hospital/Harvard Medical School, 185 Cambridge St., Boston, MA 02114 (USA)
Prof. Ralph Weissleder, Email: rweissleder@mgh.harvard.edu, Center for Systems Biology, Massachusetts General Hospital/Harvard Medical School, 185 Cambridge St., Boston, MA 02114 (USA). Department of Systems Biology, Harvard Medical School, 200 Longwood Ave., Alpert 536, Boston, MA 02115 (USA)
References
- 1.Sha MY, Xu H, Natan MJ, Cromer R. J Am Chem Soc. 2008;130:17214. doi: 10.1021/ja804494m. [DOI] [PMC free article] [PubMed] [Google Scholar]
- 2.Galanzha EI, Shashkov EV, Kelly T, Kim J-W, Yang L, Zharov VP. Nat Nanotechnol. 2009;4:855. doi: 10.1038/nnano.2009.333. [DOI] [PMC free article] [PubMed] [Google Scholar]
- 3.Lee H, Sun E, Ham D, Weissleder R. Nat Med. 2008;14:869. doi: 10.1038/nm.1711. [DOI] [PMC free article] [PubMed] [Google Scholar]
- 4.Lee H, Yoon T-J, Figueiredo J-L, Swirski FK, Weissleder R. Proc Natl Acad Sci U S A. 2009;106:12459. doi: 10.1073/pnas.0902365106. [DOI] [PMC free article] [PubMed] [Google Scholar]
- 5.Lee H, Yoon T-J, Weissleder R. Angew Chem Int Ed. 2009;48:5657. doi: 10.1002/anie.200901791. [DOI] [PMC free article] [PubMed] [Google Scholar]
- 6.Osterfeld SJ, Yu H, Gaster RS, Caramuta S, Xu L, Han S-J, Hall DA, Wilson RJ, Sun S, White RL, Davis RW, Pourmand N, Wang SX. Proc Natl Acad Sci U S A. 2008;105:20637. doi: 10.1073/pnas.0810822105. [DOI] [PMC free article] [PubMed] [Google Scholar]
- 7.Gaster RS, Hall DA, Nielsen CH, Osterfeld SJ, Yu H, Mach KE, Wilson RJ, Murmann B, Liao JC, Gambhir SS, Wang SX. Nat Med. 2009;15:1327. doi: 10.1038/nm.2032. [DOI] [PMC free article] [PubMed] [Google Scholar]
- 8.Thiesen B, Jordan A. Int J Hyperthermia. 2008;24:467. doi: 10.1080/02656730802104757. [DOI] [PubMed] [Google Scholar]
- 9.Harisinghani MG, Barentsz J, Hahn PF, Deserno WM, Tabatabaei S, van de Kaa CH, de la Rosette J, Weissleder R. N Engl J Med. 2003;348:2491. doi: 10.1056/NEJMoa022749. [DOI] [PubMed] [Google Scholar]
- 10.Weissleder R, Pittet MJ. Nature. 2008;452:580. doi: 10.1038/nature06917. [DOI] [PMC free article] [PubMed] [Google Scholar]
- 11.Huh Y-M, Jun Y-w, Song H-T, Kim S, Choi J-s, Lee J-H, Yoon S, Kim K-S, Shin J-S, Suh J-S, Cheon J. J Am Chem Soc. 2005;127:12387. doi: 10.1021/ja052337c. [DOI] [PubMed] [Google Scholar]
- 12.Park J-H, von Maltzahn G, Zhang L, Schwartz MP, Ruoslahti E, Bhatia SN, Sailor MJ. Adv Mater. 2008;20:1630. doi: 10.1002/adma.200800004. [DOI] [PMC free article] [PubMed] [Google Scholar]
- 13.Haun JB, Devaraj NK, Hilderbrand SA, Lee H, Weissleder R. Nat Nanotechnol. 2010;5:660. doi: 10.1038/nnano.2010.148. [DOI] [PMC free article] [PubMed] [Google Scholar]
- 14.Hill HD, Mirkin CA. Nat Protocols. 2006;1:324. doi: 10.1038/nprot.2006.51. [DOI] [PubMed] [Google Scholar]
- 15.Josephson L, Perez JM, Weissleder R. Angew Chem Int Ed. 2001;40:3204. doi: 10.1002/1521-3773(20010903)40:17<3204::AID-ANIE3204>3.0.CO;2-H. [DOI] [PubMed] [Google Scholar]
- 16.Park S-J, Lazarides AA, Mirkin CA, Letsinger RL. Angew Chem Int Ed. 2001;40:2909. doi: 10.1002/1521-3773(20010803)40:15<2909::AID-ANIE2909>3.0.CO;2-O. [DOI] [PubMed] [Google Scholar]
- 17.Cutler JI, Zheng D, Xu X, Giljohann DA, Mirkin CA. Nano Lett. 2010;10:1477. doi: 10.1021/nl100477m. [DOI] [PMC free article] [PubMed] [Google Scholar]
- 18.Tassa C, Duffner JL, Lewis TA, Weissleder R, Schreiber SL, Koehler AN, Shaw SY. Bioconjug Chem. 2009;21:14. doi: 10.1021/bc900438a. [DOI] [PMC free article] [PubMed] [Google Scholar]
- 19.Haun JB, Castro CM, Wang R, Peterson VM, Marinelli BS, Lee H, Weissleder R. Sci Transl Med. 2011;3:71ra16. doi: 10.1126/scitranslmed.3002048. [DOI] [PMC free article] [PubMed] [Google Scholar]
- 20.Jang J-t, Nah H, Lee J-H, Moon SH, Kim MG, Cheon J. Angew Chem Int Ed. 2009;48:1234. doi: 10.1002/anie.200805149. [DOI] [PubMed] [Google Scholar]
Associated Data
This section collects any data citations, data availability statements, or supplementary materials included in this article.