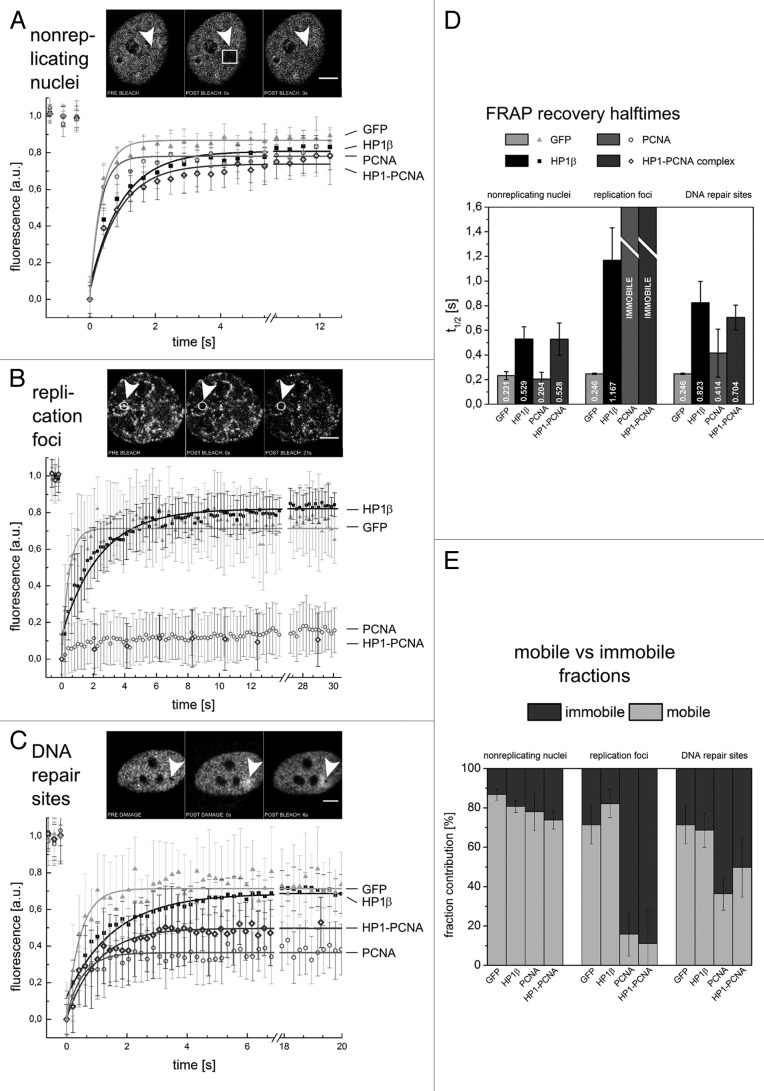
Figure 2. Dynamics of HP1β, PCNA and the HP1-PCNA complexes during DNA replication and repair. FRAP curves (A–C) and the averaged recovery halftimes (D) recorded in experiments on nonreplicating nuclei (A), at replication foci (B) and in DNA repair regions (C). Insets in A–C present images from representative experiments: arrowheads indicate FRAP ROIs (A–C) and sites of DNA damage induced by blue light (C). Mobile and immobile protein fractions (E) were calculated based on A–C; Scale bars 5 μm. GFP serves as an internal, highly mobile standard.18

An official website of the United States government
Here's how you know
Official websites use .gov
A
.gov website belongs to an official
government organization in the United States.
Secure .gov websites use HTTPS
A lock (
) or https:// means you've safely
connected to the .gov website. Share sensitive
information only on official, secure websites.
