

Background: The tumorigenic potential of mTOR has not been established.
Results: Mutations of the mTOR gene confer gain-of-function to it and induce cell transformation, anchorage-independent growth, invasion, and tumorigenesis.
Conclusion: The mTOR gene is tumorigenic upon mutation.
Significance: The results demonstrate for the first time the tumorigenicity of mTOR, hence establishing its oncogenicity and important role in human tumorigenesis.
Keywords: Cancer, Cancer Biology, mTOR, Oncogene, PI 3-Kinase (PI3K), mTOR Gene, mTOR Mutation, Proto-oncogene, Tumorigenicity
Abstract
Mammalian target of rapamycin (mTOR) is a serine/threonine protein kinase that regulates cell growth, proliferation, and survival. mTOR is frequently activated in human cancers and is a commonly sought anticancer therapeutic target. However, whether the human mTOR gene itself is a proto-oncogene possessing tumorigenicity has not been firmly established. To answer this question, we mutated evolutionarily conserved amino acids, generated eight mutants in the HEAT repeats (M938T) and the FAT (W1456R and G1479N) and kinase (P2273S, V2284M, V2291I, T2294I, and E2288K) domains of mTOR, and studied their oncogenicity. On transient expression in HEK293T cells, these mTOR mutants displayed elevated protein kinase activities accompanied by activated mTOR/p70S6K signaling at varying levels, demonstrating the gain of function of the mTOR gene with these mutations. We selected P2273S and E2288K, the two most catalytically active mutants, to further examine their oncogenicity and tumorigenicity. Stable expression of the two mTOR mutants in NIH3T3 cells strongly activated mTOR/p70S6K signaling, induced cell transformation and invasion, and remarkably, caused rapid tumor formation and growth in athymic nude mice after subcutaneous inoculation of the transfected cells. This study confirms the oncogenic potential of mTOR suggested previously and demonstrates for the first time its tumorigenicity. Thus, beyond the pivotal position of mTOR to relay the oncogenic signals from the upstream phosphatidylinositol 3-kinase/Akt pathway in human cancer, mTOR is capable potentially of playing a direct role in human tumorigenesis if mutated. These results also further support the conclusion that mTOR is a major therapeutic target in human cancers.
Introduction
Mammalian target of rapamycin (mTOR)2 is a serine/threonine protein kinase involved in the regulation of a variety of cellular functions, including cell growth and proliferation (1–3). mTOR belongs to the family of phosphatidylinositol 3-kinase (PI3K)-related kinases and contains a long stretch of protein-protein interaction modules in the N terminus. These modules include the HEAT (Huntington, elongation factor 3, protein phosphatase 2A, and TOR1) repeats and the FAT (FRAP, ATM, and TRRAP) domain. The C terminus of mTOR contains a protein kinase domain as well as a short FAT domain at the extreme C terminus (FATC), which is critical for the kinase activity of mTOR.
In mediating upstream signaling, particularly that of the PI3K/Akt pathway, mTOR exists in two molecular complexes, mammalian target of rapamycin complex 1 (mTORC1) and mammalian target of rapamycin complex 2 (mTORC2). Both mTORC1 and mTORC2 use mTOR as the catalytic subunit. A major distinction between the two is that the former contains the rapamycin-sensitive regulatory associated protein of mTOR (Raptor), whereas the latter contains rapamycin-insensitive companion of mTOR (Rictor) (3). In response to growth factors and nutrients, mTORC1 regulates cell growth and proliferation through the phosphorylation and regulation of downstream effector substrates, among which the most important and best characterized is ribosomal protein S6 kinase 1 (S6K1; also known as p70S6K) (4). The function of mTORC2 is not well understood, but it is involved in the modulation of the PI3K/Akt pathway (3, 5, 6).
Aberrant activation of mTOR signaling, particularly mTORC1, occurs commonly in human cancers (2, 7). Thus, mTOR has become an attractive therapeutic target in the development of cancer treatments in recent years (8), illustrating well the importance of mTOR/p70S6K signaling in human cancers and its clinical relevance. However, there is little genetic evidence to support this, as mutations of the mTOR gene rarely have been found in human cancers. Activation of the mTOR in cancer has been known to be the result mainly of genetics-driven deregulation of upstream signaling, particularly that of the PI3K/Akt and MAP kinase pathways (3, 9, 10).
Several previous studies characterize the activating mutations in the mTOR gene. For example, expression of a deletion mutant, ΔTOR (amino acids 2430–2450 in the kinase domain), in the HEK293 cells displayed a 3.5–10-fold increase in kinase activity accompanied by increased phosphorylation of p70S6K (11). Expression of this ΔTOR deletion mutant in p53−/− MEF cells increased colony formation (12). Caffeine- or rapamycin-resistant mutations were identified in the budding yeast TOR1, and introduction of these mutations in human mTOR resulted in elevated kinase activities (13). An artificial fission yeast screen with a methyl-nitro-nitrosoguanidine mutagen identified a large number of activating mutations in the FAT and kinase domains, which exhibited Rheb independence and hyperactive Tor2 phenotypes. Expression of these mutants in mammalian cells conferred constitutive activation on mTOR/p70S6K signaling (14). Three hyperactive Tor2 mutants have been isolated from the yeast Saccharomyces cerevisiae. Construction of one of these mutants was made (FLAG-mTORSL1) in human mTOR, and its expression in HeLa cells demonstrated its increased kinase activity; when combined with the FRB domain mutant I2017T (FLAG-mTORSL1+IT), it further increased the kinase activity, showing an addictive effect on the mTOR kinase activity, but the hyperactive mTOR mutant did not seem to significantly affect the formations of foci (15). Some of the mTOR mutations (A8S, S2215Y, P2476L, and R2505P) selected from the human cancer genome database have been introduced into WT mTOR and expressed in HEK293T cells. The cells expressing S2215Y and R2505P mutants showed increased mTOR kinase activities and activation of mTOR/p70S6K signaling. These mutants retained the phosphorylation of mTORC1 substrates even under nutrient-starved conditions. An increased number of foci has been observed in Rat 1 cells when the mTOR mutant (S2215Y) co-expressed with mutant K-ras, but not much significant difference was observed with the mutant alone compared with WT mTOR (16).
These previous studies demonstrated the impact of mutations on the function of mTOR and in vitro oncogenicity in some cases. However, the oncogenicity of the human mTOR gene has not been firmly established. This is particularly the case given the lack of in vivo data on the tumorigenicity of the mTOR gene, as in vitro documentation of oncogenicity is only preliminary. In the present study, we introduced mutations into the evolutionarily conserved amino acid residues in key functional domains of human mTOR and examined their impact on the biological activities and tumorigenicity of mTOR.
EXPERIMENTAL PROCEDURES
Multiple Amino Acid Sequence Alignment and Identification of Conserved Amino Acid Residues in mTOR
Original amino acid sequences of mTOR of various species, including Homo sapiens (NP_004949.1), Canis lupus familiaris (XP_535407.2), Bos taurus (XP_001788280.1), Mus musculus (NP_064393.1), Rattus norvegicus (NP_063971.1), Gallus gallus (XP_417614.2), Danio rerio (NP_001070679.2), Drosophila melanogaster (NP_524891.1), and Anopheles gambiae (XP_317619.4), were obtained from the NCBI database. These amino acid sequences were compared using a multiple sequence alignment program.
Based on the functional importance of the domains of the mTOR, the weight given to each domain of mTOR was 12.5% for HEAT repeats, 25% for the FAT domain, and 62.5% for the kinase domain. On this basis, 12, 25, and 63 highly conserved amino acid residues were identified from the HEAT repeats and the FAT and kinase domains, respectively. We then narrowed the selection randomly to 1 of 12 from the HEAT repeats (Met-938), 2 of 25 from the FAT domain (Trp-1456 and Gly-1479), and 5 of 63 from the kinase domain (Pro-2273, Val-2284, Val-2291, Thr-2294, and Glu-2288). These amino acid residues of mTOR were changed by site-directed in vitro mutagenesis as described below. The choices for amino acid change were made based on their speculated possible impact on the function of the mTOR kinase as suggested by the biochemical properties of amino acids or in analogy with known mutations of other oncogenes. This is explained in detail in supplemental Table 1.
Expression Vector and Site-directed Mutagenesis
A mammalian expression vector (pCMV6) containing the human wild-type mTOR cDNA with a c-Myc tag at the C-terminal cRC220457) was obtained from OriGene Technologies, Inc. (Rockville, MD). This expression vector carrying the wild-type mTOR cDNA was used to generate eight mTOR mutants (M938T, W1456R, G1479N, P2273S, V2284M, V2291I, T2294I, and E2288K) with a QuikChange XL II site-directed mutagenesis kit (Stratagene, La Jolla, CA) according to the instructions of the manufacturer. The primers were designed using a template-specific mutagenic primer design program. The primer sequences are as follows: 1) M938T: sense, mTOR-T2813C 5′-TAGTGAAATGCTGGTCAACACGGGAAACTTGCCTC-3′, and antisense, mTOR-T2813C 5′-GAGGCAAGTTTCCCGTGTTGACCAGCATTTCACTA-3′; 2) W1456R: sense, mTOR-T4366C 5′-GAGAAACTGCACGAGCGGGAGGATGCCCTTG-3′, and antisense, mTOR- T4366C 5′-CAAGGGCATCCTCCCGCTCGTGCAGTTTCTC-3′; 3) G1479N: sense, mTOR-G4435+6A 5′-CAGAGCTGATGCTGAACCGCATGCGCTGCC-3′, and antisense, mTOR-G4435+6A 5′-GGCAGCGCATGCGGTTCAGCATCAGCTCTG-3′; 4) P2273S: sense, mTOR-C6817T 5′-CATCATGTTGCGGATGGCTTCGGACTATGACC-3′, and antisense, mTOR-C6817T 5′-GGTCATAGTCCGAAGCCATCCGCAACATGATG-3′; 5) V2284M: sense, mTOR-G6850A 5′-TGACTCTGATGCAGAAGATGGAGGTGTTTGAGCAT-3′, and antisense, mTOR-G6850A 5′-ATGCTCAAACACCTCCATCTTCTGCATCAGAGTCA-3′; 6) V2291I: sense, mTOR-G6871A 5′-AGGTGTTTGAGCATGCCATCAATAATACAGCTGGG-3′, and antisense, mTOR-G6871A 5′-CCCAGCTGTATTATTGATGGCATGCTCAAACACCT-3′; 7) T2294I: sense, mTOR-C6881T 5′-GTTTGAGCATGCCGTCAATAATATAGCTGGGGACGA-3′, and antisense, mTOR-C6881T 5′-TCGTCCCCAGCTATATTATTGACGGCATGCTCAAAC-3′; and 8) E2288K: sense, mTOR-G6862A 5′-ATGCAGAAGGTGGAGGTGTTTAAGCATGCCGTC-3′, and antisense, mTOR-G6862A 5′-GACGGCATGCTTAAACACCTCCACCTTCTGCAT-3′. The mutations were confirmed in the vectors by sequencing with primers SEQ-1(2821)_F 5′-AGTGAACATTGGCATGATAGAC-3′, SEQ-2(4291)_F 5′-GAGTGTTAGAATATGCCATG-3′, and SEQ-3(6671)_F 5′-TTCCTTCTAAAAGGCCATGAAG-3′. Plasmid DNAs for the transfection experiments were purified using a mini prep kit (catalog No. K2100-11, Invitrogen).
Cell Culture, Transient Transfection, and Cell Lysate Preparation
HEK293T cells obtained from American Type Culture Collection (ATCC) were grown at 37 °C in Dulbecco's modified Eagle's medium (DMEM) supplemented with 10% FBS. Cells were transiently transfected with an empty vector, the wild type, or each of the mutant mTOR expression vectors using the Lipofectamine 2000 transfection reagent per the manufacturer's instructions (Invitrogen). The medium was changed 24 h after transfection. After 48 h of transfection, cells were washed twice with ice-cold TBS and lysed on ice using a freshly prepared ice-cold cell lysis buffer containing 50 mm Tris-HCl, pH 7.4, 100 mm NaCl, 50 mm β-glycerophosphate, 10% glycerol (w/v), 1% Tween 20 (w/v), 1 mm EDTA, 20 mm microcystein-LR, 25 mm NaF, and a complete, EDTA-free protease inhibitor mixture (Roche Applied Science) at 20 μl/ml of lysis buffer. Cell lysates were collected in a 1.5-ml Microfuge tube, disrupted by ultrasonication for 15 s on ice, and further incubated on ice for 30 min. Cell lysates were then centrifuged at 20,000 × g for 10 min at 4 °C. The supernatants were collected, and protein concentrations were measured using a DC protein assay kit (Bio-Rad Laboratories). This cell lysate was used for Western blotting and immunoprecipitation.
Immunoprecipitation
For vector, wild-type, and mutant lysates, the protein concentration was adjusted to 1 μg/μl using lysis buffer, and 500 μg of total lysate protein from each sample was used for immunoprecipitation. The 500-μg lysate was precleared by adding 15 μl of protein G-agarose beads (Roche Applied Science) followed by incubation for 15 min at 4 °C. The protein G-agarose beads were pelleted by centrifugation at 4,000 rpm in a microcentrifuge for 5 min at 4 °C. The precleared lysate was transferred to a clean tube, added with 5 μg of anti-c-Myc antibody, and incubated on a rotator for 1 h at 4 °C. The lysate was then added with 50 μl of protein G-agarose and further incubated on the rotator for 90 min at 4 °C. The protein G-agarose beads were pelleted by centrifugation in the microcentrifuge at 4,000 rpm for 5 min at 4 °C. The resulting supernatant was carefully removed and discarded. The pelleted beads were washed four times with 500 μl of lysis buffer and one time with kinase assay buffer supplied with the K-LISA mTOR (recombinant) activity kit (catalog No. CBA104, Calbiochem-EMD Chemicals). Half of the immunoprecipitate was used for an mTOR kinase assay, and the other half was resolved in an SDS-PAGE and subjected to Western blotting analysis.
Protein Kinase Assay of mTOR
The kinase activity of mTOR was assayed as described previously (17–19) using a commercially available K-LISA mTOR (recombinant) activity kit (catalog No. CBA104, Calbiochem-EMD Chemicals) according to the manufacturer's instructions. Briefly, immunoprecipitates obtained as described above were resuspended in 50 μl of 2× kinase buffer and gently mixed with 50 μl of mTOR substrate followed by incubation at 30 °C for 30 min. The mTOR substrate used in this assay was a p70S6K-GST fusion protein, which is phosphorylated at threonine 389 of p70S6K by active mTOR in the presence of ATP. After the reaction, the reaction mixture was incubated in a glutathione-coated 96-well plate to facilitate the binding of GST-fused p70S6K to the plate. The phosphorylated substrate was detected using anti-p70S6K-pT389 antibody followed by detection with an HRP-antibody conjugate and TMB substrate. Sensitivity was increased by the addition of ELISA Stop solution, and relative activities were determined by reading at the absorbance wave length at 450 nm.
Western Blotting
Cells were washed once with phosphate-buffered saline (PBS) and lyzed in radioimmune precipitation assay buffer (catalog No. sc-24948, Santa Cruz Biotechnology, Santa Cruz, CA). Western blotting was performed using 45 μg of cell lysates resolved on SDS-PAGE and transferred to a PVDF membrane (EMD Millipore, Billerica, MA). The membrane was blocked with 5% skim milk/PBS containing 0.1% Tween 20 (PBST) for 1 h at room temperature; the membrane was then sliced based on the molecular weights. Membranes were incubated overnight at 4 °C with primary antibodies including anti-Myc (catalog No. sc-40, Santa Cruz Biotechnology), anti-phospho-p70S6K (catalogue number 9234, Cell Signaling Technology, Danvers, MA), anti-mTOR (catalog No. 2972, Cell Signaling Technology), anti-phospho-4EBP1 (catalog No. 2855, Cell Signaling Technology), anti-phospho-Akt (catalog No. sc-7985, Santa Cruz Biotechnology), anti-phospho-S6 ribosomal protein (catalog No. 4858 and 2215, Cell Signaling Technology), and anti-β-actin (catalog No. sc-1616R, Santa Cruz Biotechnology) antibody. The membranes used for phospho-4EBP1, phospho-p70S6K, phospho-Akt, and phospho-S6 ribosomal protein were stripped off for total 4EBP1 (catalog No. sc-81149, Santa Cruz Biotechnology), p70S6K (catalogue number sc-8418, Santa Cruz Biotechnology), total Akt (catalog No. sc-5298, Santa Cruz Biotechnology), and total S6 ribosomal protein (catalog No. 2217, Cell Signaling Technology), respectively. After washing four times with PBST, blots were incubated with the respective HRP-conjugated anti-rabbit or anti-mouse secondary antibodies (catalog No. sc-2004 and c-2005, Santa Cruz Biotechnology) for 1 h at room temperature. After washing with PBST, the protein bands on the membrane were detected with enhanced chemiluminescence (ECL) reaction reagents (Amersham Biosciences) and exposed to x-ray films.
Cell Culture, Transfection, and Focus Formation Assay of NIH3T3 Cells
NIH3T3 cells (ATCC) were cultured in DMEM supplemented with fetal calf serum (FCS). Focus formation assay was done as described previously (20). Briefly, NIH3T3 cells were transfected with equal amount of empty vector or vectors expressing the wild-type mTOR or mutant mTOR P2273S or E2288K in a 6-well plate (Costar®, Corning, NY) using Lipofectamine 2000 transfection reagent as instructed by the manufacturer (Invitrogen). After 48 h of transfection, cells were washed once with PBS, tripsinized briefly, and transferred to two T-75 plates containing DMEM supplemented with 10% FCS and 800 μg/ml G418. The medium was changed every 3–4 days. After 3 weeks, morphologically transformed, multilayered foci were counted and photographed (Nikon Eclipse Ti-U, Tokyo).
Cell Focus Cloning and Stable Cell Line Establishment
For the vector, wild-type mTOR, mutant mTOR P2273S, and mutant mTOR E2288K, each of the single multilayered foci formed from the aforementioned focus formation assay was cloned using cloning cylinders (catalog No. TR-1004, Millipore). Cells from a single colony were cultured, expanded, and maintained in DMEM containing 10% FCS and 800 μg/ml G418. All of the clones were subjected to genomic DNA isolation, PCR amplification, sequencing, and Western blotting for confirmation of integration and expression of the transfected plasmid constructs. Briefly, a portion of each stably transfected NIH3T3 cell clone was lysed, and genomic DNA was isolated by standard phenol-chloroform extraction using MaXtract high density gel tubes (Qiagen) as described previously (21). Integration of the plasmid and the presence of the mutation in the mTOR ORF and Myc tag were confirmed by PCR amplification of the genomic DNA using a forward primer binding in the mTOR cDNA and a reverse primer binding in the vector back bone of pCMV6. The amplified PCR products were sequenced directly using a BigDye terminator v3.1 cycle sequencing ready reaction kit (Applied Biosystems) and an ABI PRISM 3730 genetic analyzer (Applied Biosystems). All of the single clones were also analyzed by Western blotting as described above for overexpression of mTOR and activation of the mTOR/p70S6K signaling pathway. The verified clones were used in further experiments for functional studies.
Determination of Morphological Transformation
Morphological transformation of NIH3T3 cells expressing mTOR mutants was determined as described previously (22). Briefly, NIH3T3 cells stably transfected with the empty vector, wild-type mTOR, and the indicated mTOR mutants were plated in 60-mm culture plates (Corning) at a density of 3 × 10⁵ cells. After cultivation of the cells for 1 day in regular medium (DMEM+10% FCS+G418 800 μg/ml), cell morphology was examined under a microscope (Nikon Eclipse Ti-U, Tokyo, Japan).
Soft Agar Colony Formation Assay
Soft agar colony formation assay was performed as previously described (20). Briefly, NIH3T3 cells stably expressing the indicated type of mTOR were seeded at 1.0 × 10⁴ cells/well on 6-well plates (Costar®, Corning) in 0.3% agar (catalog No. 214010, BD Biosciences) over a bottom layer of 0.6% agar. After 4 weeks, colonies of >0.1 mm were counted and photographed (Zeiss Axiovert 200M, Carl Zeiss, Germany).
Invasion Assay
A cell invasion assay was performed as described previously (20). Briefly, the assay was performed using Matrigel invasion chambers consisting of BD FalconTM cell culture inserts containing a polyethylene terephthalate membrane with 8-μm pores coated with Matrigel matrix (BD BioCoatTM MatrigelTM Invasion Chamber, BD Biosciences). NIH3T3 cells stably transfected with the empty vector, the wild-type mTOR, or the indicated mutant mTOR were completely serum-starved for 8 h and then collected and resuspended with 5 × 10⁴ cells in 500 μl of serum-free DMEM supplemented with 0.1% BSA. Culture inserts were placed in the wells of a BD Falcon 24-well multiwell companion plate, and 750 μl of DMEM containing 1% serum was added to the lower compartment of each well. Cell suspensions were added to each culture insert. After a 22-h incubation at 37 °C with 5% CO2, the noninvasive cells on top of the Matrigel were removed using a cotton swab, and the invaded cells on the lower side of the membrane were fixed with 70% ethanol and stained with Coomassie Brilliant Blue. The invasive cells were counted and photographed under a microscope with ×10 magnification (Nikon Eclipse Ti-U).
Xenograft Tumorigenicity Assay
Four-week-old female nude mice (Hsd:athymic nude Foxn1nu mice) were purchased (Harlan Laboratories, Frederick, MD) and maintained under standard conditions. In vivo experiments were performed per our institutional guidelines for the use of laboratory animals. NIH3T3 cells stably expressing the empty vector, wild-type mTOR, or the indicated mTOR mutants were washed once with PBS, trypsinized briefly, pelleted, and resuspended in serum-free medium (DMEM). An aliquot of 150 μl of medium containing 2.0 × 10⁷ cells was injected subcutaneously into the right flank of nude mice using 23-gauge needles. Each group consisted of five animals. Tumor formation was monitored. After 2 weeks, tumors were assessed and photographed. Unless otherwise indicated, the data presented are representative of at least three independently performed experiments.
RESULTS
Identification and Selection of Evolutionarily Highly Conserved Amino Acid Residues in mTOR for Site-directed in Vitro Mutagenesis
The goal of this study was to test and definitely confirm the oncogenic potential of the human mTOR gene and its candidacy for proto-oncogene by introducing mutations into mTOR gene and testing their impact on the functions of mTOR. To this end, we first performed amino acid sequence alignment analyses of mTOR from various species as described under “Experimental Procedures” and illustrated in Fig. 1 and identified the evolutionarily most conserved amino acid residues. As shown in Fig. 1A, by giving weight to the importance of the functional domains of the mTOR, we identified and selected eight amino acid residues (Met-938, trp-1456, Gly-1479, Pro-2273, Val-2284, Val-2291, Thr-2294, and Glu-2288) for site-directed in vitro mutagenesis. As illustrated in Fig. 1B, among the eight amino acid residues, one was from the HEAT repeats (Met-938), two from the FAT domain (Trp-1456 and Gly-1479), and five from the kinase domain (Pro-2273, Val-2284, Val-2291, Thr-2294, and Glu-2288). These amino acid residues were randomly mutated to M938T, W1456R, G1479N, P2273S, V2284M, V2291I, T2294I, and E2288K for further analysis of their impact on the function of mTOR and its oncogenicity. We cross-checked somatic mutation (Catalogue of Somatic Mutations in Cancer) and single nucleotide polymorphism (SNP) databases of NCBI and Ensembl to assess whether these mutations had already been identified in human cancers. To date, none of these mutations has been enlisted in these databases.
FIGURE 1.

Identification and selection of evolutionarily conserved wild-type amino acid residues in mTOR for the generation of mTOR mutants. A, amino acid sequence alignment of the mTOR proteins from nine different species. The eight selected amino acid residues (Met-938 in the HEAT repeats, Trp-1456 and Gal-1479 in the FAT domain, and Pro-2273, Val-2284, Glu-2288, Val-2291, and Thr-2294 in the kinase domain) are evolutionarily highly conserved among these different species. The selection criteria are as detailed under “Experimental Procedures.” B, schematic diagram of the major functional domains of the mTOR protein. Shown are the mutations generated by site-directed mutagenesis of the eight amino acids listed in A and the mTOR domains that carry them. The numbers indicate amino acid or codon positions, with the initiation codon (methionine) of the protein defined as number 1.
mTOR Mutations Conferred Gain of Function with Enhanced Protein Kinase Activities
To determine the functional consequences of mTOR mutations, we tested and compared the in vitro protein kinase activities of immunoprecipitated mTOR mutants from transiently expressed HEK293T cells. As shown in Fig. 2A, the eight mTOR mutants, M938T, W1456R, G1479N, P2273S, V2284M, V2291I, T2294I, and E2288K, showed significantly increased protein kinase activity on the substrate p70S6K-GST fused protein in comparison with the wild-type mTOR, ranging from 4- to 11-fold. As expected, the empty vector transfection alone did not show activity. As shown in Fig. 2B, expression of mTOR protein both in immunoprecipitates and in whole cell lysates was confirmed by Western blotting for the wild-type mTOR and all of the eight mTOR mutants. As expected, the empty vector did not express the mTOR protein. Thus, all of these introduced mTOR mutations were gain of function in nature and conferred the mTOR increased protein kinase activities to various extents.
FIGURE 2.
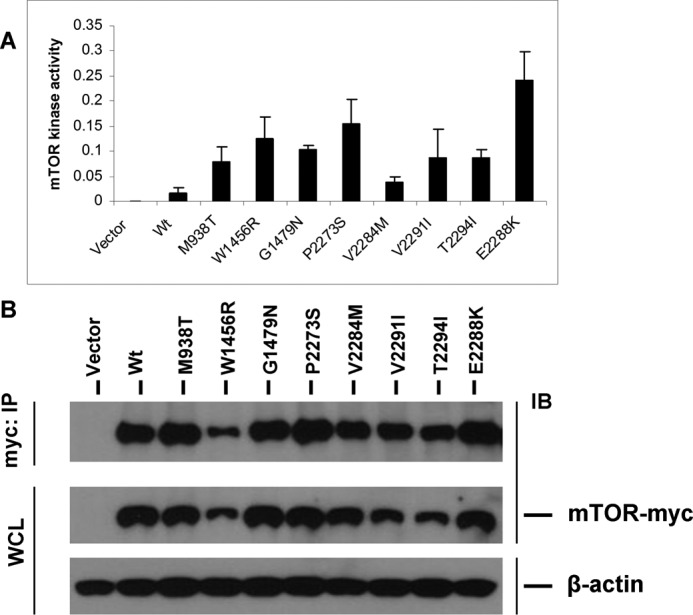
mTOR mutants show increased protein kinase activities. A, in vitro assay of protein kinase activities of mTOR mutants. HEK293T cells were transiently transfected with Myc-tagged vector, wild-type mTOR (Wt), and each of the eight mTOR mutants as indicated. Cell lysates were immunoprecipitated with the anti-c-Myc antibody, and immunoprecipitates were assayed for protein kinase activity of mTOR as described under “Experimental Procedures.” B, expression of mTOR mutants in the HEK293T cells corresponding to the assays shown in A. HEK293T cells transiently transfected with the indicated vector constructs described in A and cell lysate proteins were subjected to immunoprecipitation followed by the corresponding protein kinase assays described in A. Part of these immunoprecipitates (IP) and whole cell lysate (WCL) from the above indicated transfectants were visualized by SDS-PAGE and Western blotting analyses (IB) and for the indicated proteins using appropriate antibodies as described under “Experimental Procedures.” Successful immunoprecipitation of Myc-tagged wild-type mTOR and each of the mTOR mutants is shown in the top row. Successful expression of the wild type and each of the mTOR mutants was reconfirmed by analyzing the whole cell lysate shown in the middle row. β-Actin was used for quality control of the loading proteins.
mTOR Mutants Activated the mTOR/p70S6K and Akt Signaling Pathways in HEK293T Cells
Given the elevated kinase activities of the mTOR mutants on the substrate p70S6K-GST fused protein, we next examined the impact of these mTOR mutants on the endogenous downstream mTOR/p70S6K signaling activities in HEK293T cells. As shown in Fig. 3A, this signaling, as reflected by the elevated phosphorylation level at threonine 389 of the immediate downstream substrate p70S6K in HEK293T cells, was significantly enhanced by transfection with various mTOR mutants in comparison with the wild-type mTOR. As illustrated in Fig. 3B, quantification of the phosphorylation bands of p70S6K with normalization for total protein of p70S6K more clearly shows the dramatic increase in the mTOR/p70S6K signaling activities, up to several hundredfold in some cases compared with the wild-type mTOR. This dramatic increase in mTOR/p70S6K signaling was particularly prominent with mutants W1456R, P2273S, and E2288K, consistent with the finding that these mutants displayed the highest proteins kinase activities on the p70S6K-GST fused protein in the in vitro assay on immunoprecipitated mTOR proteins (Fig. 2). To test whether the mTOR mutants affected the mTORC2 function, we performed Western blotting to examine the phosphorylation of Akt at Ser-473, a direct substrate of mTORC2, in transiently transfected HEK293T cells. As shown in Fig. 3, A and C, these mTOR mutants caused Akt phosphorylation to various extents. Among the eight mutants, W1456R, P2273S, and E2288K displayed the highest impact on both mTOR/p70S6K and Akt signaling. We next examined whether the mTOR mutants confer activation of 4EBP1 and the downstream effector of p70S6K, rpS6. As illustrated in supplemental Fig. 2, these mutants minimally enhanced phosphorylation of 4EBP1 compared with wild-type mTOR. We found a robust phosphorylation of rpS6 in the basal state and could not see any further increase in this phosphorylation by mTOR mutants in HEK293T cells (supplemental Fig. 2).
FIGURE 3.

Activation of the mTOR/p70S6K and Akt signaling pathways by mTOR mutants in HEK293T cells. A, Western blotting analysis of the HEK293T cells transfected with Myc-tagged vector, wild-type mTOR, and each of the mTOR mutants. Activation is reflected by increased phosphorylation of p70S6K (P-p70S6K) and Akt (P-Akt). HEK293T cells were transiently transfected with c-Myc-tagged vector, wild-type mTOR (Wt), and each of the mTOR mutants as indicated. Cell lysates were subjected to Western blotting analyses for the indicated proteins using the appropriate antibodies as described under “Experimental Procedures.” Shown, from top to bottom, are the expression of empty vector, wild-type mTOR, and eight mTOR mutants; phosphorylation levels of p70S6K (Thr-389); total p70S6K; phosphorylation levels of Akt (Ser-473); total Akt; and β-actin for quality controls of loading proteins. B and C, quantitative presentation of the phosphorylation levels of p70S6K and Akt, respectively. The phosphorylation levels of p70S6K and Akt corresponding to the transfection conditions described in A as indicated were normalized by dividing the intensities of P-p70S6K by the total p70S6K and P-Akt by the total Akt described in A. The results represent mean ± S.D. of three independent experiments.
Expression of mTOR Mutants Promoted Focus Formation of NIH3T3 Cells
We took the next step, to explore the oncogenic potential of the mTOR gene, by selecting two kinase domain mutants of mTOR, P2273S and E2288K, which exhibited the highest gained activities (Figs. 2 and 3) and testing their impact on the focus formation of NIH3T3 cells: loss of contact inhibition of cell growth, a cell phenotypic reflection of the oncogenic property of oncogenes. We stably transfected NIH3T3 cells with the corresponding vectors as indicated in Fig. 4. After a 3-week culture, cells transfected with P2273S and E2288K readily formed multilayered foci, whereas in contrast, cells transfected with the wild-type mTOR or empty vector did not (Fig. 4A and supplemental Fig. 1). As shown in Fig. 4B, mutational analysis of the transfected NIH3T3 cell foci showed the presence of the correspondingly introduced mTOR mutations. Fig. 4C quantitatively illustrates the increased focus formation of cells with mTOR mutants in comparison with the wild-type mTOR or empty vector. As a positive control, we also examined the impact of the oncoprotein H-Ras G12V on focus formation of NIH3T3 cells and, as expected, observed results similar to those with mTOR mutants (Fig. 4, A and C). These findings suggest that the mTOR mutants are likely oncogenic.
FIGURE 4.

Focus formation of NIH3T3 cells promoted by mTOR mutants. A, cell focus-forming activities of mTOR mutants. Shown are images of adherent growth of NIH3T3 cells transfected with Myc-tagged vector, wild-type mTOR, and each of the mTOR mutants as indicated. Cells were cultured in regular medium with 10% FCS under standard conditions. Images of cell foci were photographed with ×10 magnification after appropriate culture of cells as described under “Experimental Procedures.” Transfection of cells with H-Ras G12V as a positive control induced cell focus formation. B, a sequencing electropherogram of the mTOR gene. Each of the multilayered foci was cloned and cultured, and genomic DNA was isolated, PCR-amplified, and sequenced as described under “Experimental Procedures.” As expected, the sequencing electropherogram of the empty vector shows no amplification or a junk, the two wild types show no mutation in the corresponding positions of the mutants analyzed, and the mutants show the expected introduced mutations for P2273S and E2288K. C, number of cell foci formed with the indicated transfections. The number of transfected foci was counted 21 days after cell transfection. The results represent mean ± S.D. of three independent experiments.
Expression of mTOR Mutants Caused Transformation of NIH3T3 Cells
The cell focus-forming ability of mTOR mutants demonstrated above suggested that the mTOR mutant-expressing cells might have been transformed. To further test this idea, we also examined the cell morphology that may have been altered as a reflection of transformation. Indeed, as shown in Fig. 5A, we found that NIH3T3 cells stably expressing the vector or the wild-type mTOR resembled the parental cells in morphology, but cells stably expressing mTOR mutants P2273S and E2288K exhibited striking morphological changes with a more aggressive appearance, including the loss of complete adherence, cell thickening and twisting, spindle shaping, and stacking growth (cells “stacked” on one and another). These are all characteristics of cell transformation. As shown in Fig. 5, B and C, Western blotting of lysates from these cells confirmed the increased expression of mTOR in the cells transfected with the wild-type mTOR or mTOR mutants P2273S and E2288K. Overactivated mTOR/p70S6K and Akt signaling, as reflected by the dramatically increased threonine 389 phosphorylation of p70S6K and serine 473 phosphorylation of Akt, respectively, was also seen in cells expressing the mutants but not in cells expressing the empty vector or the wild-type mTOR (Fig. 5, B, D, and E). We also examined whether these mutants confers phosphorylation of 4EBP1 and the downstream effector of p70S6K, rpS6. As illustrated in supplemental Fig. 3, we found strong activation of 4EBP1 as reflected by the phosphorylation of 4EBP1 at Thr-37/Thr-46. We also found robust rpS6 phosphorylation at Ser-235/Ser-236 and Ser-240/Ser-244. These results corroborate that, unlike HEK293T cells, mTOR mutants robustly activate the classical mTOR/p70S6K/rpS6 and 4EBP1 signaling in NIH3T3 cells that leads to protein synthesis, transformation, and oncogenicity.
FIGURE 5.

Morphologic transformation and anchorage-independent growth of cells transfected with mTOR mutants. A, morphologic transformation of NIH3T3 cells stably expressing mTOR mutants. Cells were plated at low density, cultured, maintained, and photographed as detailed under “Experimental Procedures.” Shown are representative images of morphology of NIH3T3 cells stably expressing empty vector, wild-type mTOR, and the indicated mTOR mutants. B, corresponding expression of the mTOR mutants and their activation of mTOR/p70S6K and Akt signaling in NIH3T3 cells. NIH3T3 cells corresponding to those mentioned in A, stably transfected with the empty vector, wild-type mTOR, and the indicated mTOR mutants were subjected to lysis and Western blotting analyses as described in the legend for Fig. 3A. Thus, stable transfection and expression of mTOR mutants in NIH3T3 cells also activated mTOR/p70S6K and Akt signaling, consistent with similar observations in transiently transfected HEK293T cells (Fig. 3). C, relative expression of the mTOR protein in stably transfected NIH3T3 cells. Densitometry was performed to measure the density of the mTOR and β-actin bands shown in B. The relative mTOR levels were obtained by dividing the mTOR band density by the corresponding β-actin band density. D and E, relative phosphorylation of the p70S6K and Akt protein in stably transfected NIH3T3 cells. Densitometry was performed to measure the densities of the phospho-p70S6K, p70S6K, phospho-Akt, and Akt bands shown in B. The relative phospho-p70S6K and phospho-Akt levels were obtained by dividing the phospho-p70S6K and phospho-Akt band densities by the corresponding p70S6K and Akt band density, respectively. F, anchorage-independent cell growth of mTOR mutants on soft agar. NIH3T3 cells stably transfected with the empty vector, wild-type mTOR, and the indicated mTOR mutants as confirmed in B were seeded in soft agar. Colonies formed 4 weeks later and were photographed with ×40 magnification. G, analysis of the number of colonies. The number of cell colonies corresponding to C that were >0.1 mm in diameter was counted. The results represent mean ± S.D. of three independent experiments.
To further examine the cell transforming ability of mTOR mutants P2273S and E2288K, we also performed an anchorage-independent soft agar colony formation assay. As shown in Fig. 5, F and G, NIH3T3 cells stably expressing the two mTOR mutants formed significantly more colonies, of an extremely large size, on soft agar in striking contrast to the empty vector or wild-type mTOR-expressing cells. These results thus demonstrate the strong cell transforming ability of mTOR mutants, further supporting their oncogenicity.
Expression of mTOR Mutants Promoted Invasion of NIH3T3 Cells
Driving cancer cell invasion is characteristic of many oncogenes. A previous study demonstrated an important role of activated p70S6K in cell motility (23). We were therefore interested in finding out whether mTOR mutants could promote cell invasion. As shown in Fig. 6A, NIH3T3 cells stably expressing mTOR mutants P2273S or E2288K exhibited a much more avid invasion on Matrigel matrix-coated membrane than the empty vector or wild-type mTOR-expressing cells. As shown in Fig. 6B, the number of invasive cells was significantly higher with the mTOR mutants than with the vector and wild-type mTOR-expressing cells, again suggesting that these mTOR mutants are oncoproteins.
FIGURE 6.
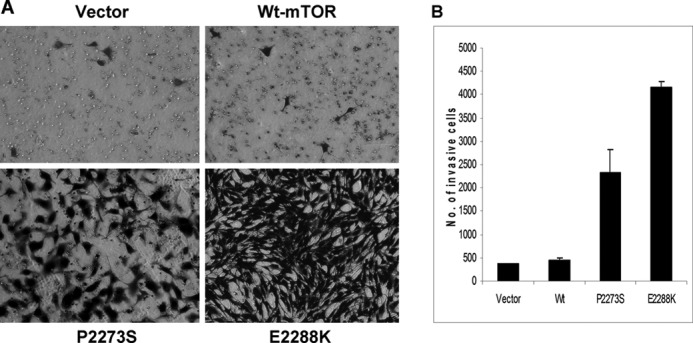
Cell invasion promoted by mTOR mutants. A, in vitro invasion assay of NIH3T3 cells with various transfections. Cells were stably transfected with the empty vector, wild-type mTOR, and the indicated mTOR mutants followed by a cell invasion assay performed as described under “Experimental Procedures.” Shown are the cells that invaded on the Matrigel matrix-coated polyethylene terephthalate membrane after removal of the non-invasive cells. B, the number of invading cells with the indicated transfections. The results of each column represent the mean ± S.D. of the numbers of invasive cells from three independent experiments.
Expression of mTOR Mutants Induced Tumor Formation in Nude Mice
To firmly establish the oncogenicity of strongly activated mTOR, we next tested the tumorigenicity of selected mTOR mutants P2273S and E2288K in nude mice. Shown in Fig. 7A are large tumors that developed at 2 weeks after subcutaneous inoculation into athymic nude mice of NIH3T3 cells stably expressing the two mTOR mutants. All five animals in each of the two mutant groups developed tumors. Tumors in some animals displayed necrotic changes. In contrast, no significant tumor developed at 2 weeks with cells stably transfected with empty vector or the wild-type mTOR, although a small tumor-like structure developed in some animals with wild-type mTOR at 4–5 weeks. Thus, this in vivo result on the tumorigenicity of mTOR mutants definitely demonstrated the oncogenicity of genetically activated mTOR. Fig. 7B schematically illustrates the pivotal position of mTOR in this tumorigenicity.
FIGURE 7.

In vivo tumorigenicity of mTOR mutants in nude mice and mTOR mutant-promoted mTOR/p70S6K signaling. A, in vivo tumorigenic assay of NIH3T3 cells with various transfections. NIH3T3 cells stably transfected with the empty vector, wild-type mTOR, and the mTOR mutants P2273S or E2288K were inoculated subcutaneously into athymic nude mice as described under “Experimental Procedures” and subsequently were observed for tumor formation. Photographs of the tumors and animals were taken 2 weeks after cell inoculation. Tumor necrosis was seen in some cases. Each group consisted of five mice. A representative mouse is shown for each group, and the number shown in parentheses for each group represents the number of animals, of five total mice, that formed tumors. B, schematic illustration of mutant mTOR signaling to promote tumorigenesis. mTOR normally regulates translation initiation and cell proliferation by integrating inputs from upstream signaling pathways, particularly from the PI3K/Akt pathway, that are activated by growth factors and receptor tyrosine kinases through the indicated signaling cascade. Upon mutation, mTOR becomes strongly activated and continuously phosphorylates and activates its substrates, p70S6K and Akt, to promote protein synthesis, cell proliferation, and tumorigenesis.
All of the above in vitro and in vivo experiments with stable cell transfectants used cell foci, including cells transfected with the wild-type mTOR that formed very few foci. However, oncogenicity was seen only with mutant transfectants but not the wild-type mTOR. The formation of small tumors was seen with wild-type mTOR after 3 weeks of cell inoculation in animal studies (data not shown), in contrast to the rapid formation of large tumors with mTOR mutants. The results presented are representative of at least two experiments.
DISCUSSION
As a ubiquitously expressed serine/threonine protein kinase and a key signaling molecule downstream of the PI3K/Akt pathway, mTOR is widely known to play a critical role in controlling human cancer cell growth and proliferation and is being actively tested as a major therapeutic target for cancers both preclinically and clinically (8, 9). The currently known mechanism for persistent activation of mTOR in human cancers is the epigenetic and genetic alteration of the upstream signaling molecules, such as the methylation of PTEN (24), mutations of Ras, PIK3CA, and PTEN (8, 9, 25), and the genetic copy gain of receptor tyrosine kinase genes and other genes in the MAP kinase and PI3K/Akt pathways (10, 26). Mutation of the mTOR gene itself has been found only occasionally in some cancers (27–29). The tumorigenic potential of the human mTOR gene has not been established.
In the present study, by introducing mutations into evolutionarily conserved amino acid residues in major functional domains of the human mTOR, we were able to generate mTOR mutants that possessed dramatically increased protein kinase activity with strong oncogenicity in vitro and tumorigenicity in vivo. We have thus, for the first time, definitively demonstrated that the human mTOR gene is a proto-oncogene that possesses strong tumorigenicity when activated genetically. The present results also provide further support that mTOR lies in a pivotal position to relay the oncogenic signals from constitutively activated upstream signaling cascades in cancer cells, further assuring that mTOR is a key cancer therapeutic target as widely accepted.
It has been suggested that mutations affecting preferentially residues that are highly conserved in evolution are likely of critical functional importance (30). Indeed, the majority of cancer-associated oncogenic mutations identified so far are highly conserved evolutionarily (31, 32). Our strategy of identifying and selecting the highly conserved amino acids through the multiple amino acid sequence alignment approach to create functional mutations in major functional domains of mTOR proved to be successful in studying the oncogenic potential of the mTOR gene. The amino acid residues that we mutated in mTOR in the present study are evolutionarily highly conserved over the divergence of different species. Like mTOR, these amino acid residues are also highly conserved within other members of the PIKK (PI3K-related kinase) family (33). These regions are less evolved because they are located in the catalytically important regions. To date, the three-dimensional structure of mTOR has not been available. Recently, a predicted structure for the C-terminal region of mTOR including the FAT, kinase, and FATC domains was proposed based on the amino acid sequence alignment of the known crystal structure of the PIKK family member PI3KCγ (33). The region consisting of amino acids 2180–2381 of mTOR is considered a similar catalytic loop to that of PI3KCγ. All of the kinase domain mutations analyzed in the present study (P2273S, V2284M, E2288K, V2291I, and T2294I) are located in this catalytic loop and in the predicted helix equivalent to kα5 of PI3KCγ. They are also located adjacent to region kα3, which is one of the three kinase active sites (region I(Kα3), II(kα9), and III(kα11)) of mTOR where activating mutations of fission yeast TOR2 have been found clustered (33, 34). A conformational change associated with mutations may be responsible for the elevated protein kinase activity of mTOR observed in the present study.
The mTOR mutants generated in the present study displayed varying elevated protein kinase activities on the downstream substrate, p70S6K, either in cell-free enzymatic assays or in cell systems, to different extents. Some of the mTOR mutants generated from mutations in the kinase domain, such as P2273S and E2288K, exhibited the highest enzymatic activities and the highest capability of activating p70S6K signaling. Mutant W1456R from a FAT domain mutation also exhibited remarkable activation, whereas mutant M938T from a mutation in the HEAT domain exhibited only a moderate activation. These results are interestingly consistent with a previous observation that mutagen-induced random mutagenesis in fission yeasts results in the accumulation of activating point mutations, mostly in the kinase and FAT domains of TOR2 (14). These results are not surprising, as the kinase and FAT domains, particularly the former, are the most important to the kinase activities of mTOR.
It is striking to see the several hundredfold activation of p70S6K signaling in cells expressing some of the mTOR mutants, suggesting a high oncogenic power of these mutants. Although these mutants enhanced the phosphorylation of 4EBP1 (Thr-37/Thr-46) in HEK293T cells, the effect was small (supplemental Fig. 2). However, stable expression of mutants P2273S and E2288K in NIH3T3 cells strongly phosphorylated 4EBP1 at both Thr-37/Thr-46 and p70S6K (supplemental Fig. 3). Thus, these mTOR mutants seem to signal mainly through p70S6K in some cells but can activate both p70S6K and 4EBP1 in other cells. The preference of the mTOR mutants for p70S6K in HEK293T cells is consistent with a previous report that p70S6K is preferred 10-fold more than 4EBP1 as a substrate by mTOR in these cells (19). A recent study demonstrated that in urothelial cells (RT112 and T24), shRNA-mediated silencing of mTOR resulted in the dephosphorylation of p70S6K1 but had only a minor effect on 4EBP1 (35). This provides further evidence that p70S6K is a much more preferred substrate than 4EBP1 for mTOR in certain cells. Moreover, we found a robust, full phosphorylation of rpS6 in the basal state, which was not changed by mTOR mutants in HEK293T cells, although stable expression of mutants P2273S and E2288K in NIH3T3 cells dramatically phosphorylated rpS6 at both Ser-235/Ser-236 and Ser-240/Ser-244. These results suggest that mTOR might not signal to rpS6 in HEK293T cells, unlike in NIH3T3 cells. It has been suggested in recent years that the classical mTORC1/p70S6K1/rpS6 signaling pathway may not be valid in all cell systems and that an alternative signaling that leads to the phosphorylation of rpS6 independently of mTOR/p70S6K also exists in some cell systems (36). Mutants P2273S and E2288K conferred remarkable oncogenicity on mTOR, as demonstrated by their strong power to cause and promote NIH3T3 cell transformation, reflected by the unique cell morphological changes, contact inhibition-free focus formation, and anchorage-independent cell growth. Moreover, the mTOR mutants also conferred high invasiveness on cells, another common feature of classical oncogenes. Most remarkably, driven by mTOR mutants, NIH3T3 cells developed large tumors in nude mice, which were necrotic in some cases, demonstrating the strong tumorigenicity of these mTOR mutants. Thus, these in vitro and in vivo data all support the interpretation that these mTOR mutants meet the classical criteria for oncoproteins. mTOR is thus another classical example that proto-oncogenes are usually genes that play a critical role in signaling pathways, gene transcription, protein synthesis, and metabolism pathways (37).
The results from several previous functional studies on genetic manipulation of the human mTOR and yeast TOR genes support the conclusion of the present study of mTOR as a proto-oncogene. For example, a small deletion of amino acids 2430–2450 in the kinase domain close to the C terminus of mTOR could moderately increase the kinase activity of mTOR and cause colony formation of p53−/− MEF cells (11, 12). The introduction of mTOR mutations S2215Y and R2505P from the human cancer genome database into the wild-type mTOR could increase its kinase activity and enhance mTOR/p70S6K signaling when expressed in HEK293T cells (16). The introduction of yeast TOR mutations into human mTOR also increased the activities of the latter (13, 15). Interestingly, an artificial fission yeast screen with a methyl-nitro-nitrosoguanidine mutagen identified a large number of activating TOR mutations in the FAT and kinase domains, and expression of these mutants in mammalian cells conferred constitutive activation of the mTOR/p70S6K signaling (14). However, unlike the present study, none of the above studies tested the tumorigenicity of the mTOR gene.
The strong oncogenicity and tumorigenicity of some of the human mTOR mutants demonstrated in the present study, alone with the previous studies discussed above, including the high induciblility of TOR mutations in yeast, suggest that oncogenic mTOR mutations likely exist in certain human cancers. Further, it will be reasonable to search extensively for oncogenic mTOR mutations in human cancers, as recently pursued for renal cancer, which interestingly revealed the intratumor heterogeneity of an occasional mTOR mutation (38). Genetic alterations in the PI3K/Akt pathway confer a poorer prognosis on certain cancers (39–41) and cancer cell sensitivity to the inhibitors of the PI3K/Akt/mTOR pathway (42–45). It is thus expected that the discovery of oncogenic mTOR mutations in human cancers may facilitate molecularly based prognostication and therapeutic targeting of such cancers.
Supplementary Material
This work was supported, in whole or in part, by National Institutes of Health Grant R01CA134225 (to M. X.).

This article contains supplemental Figs. 1–3 and Table 1.
- mTOR
- mammalian target of rapamycin
- mTORC
- mammalian target of rapamycin complex.
REFERENCES
- 1. Wullschleger S., Loewith R., Hall M. N. (2006) TOR signaling in growth and metabolism. Cell 124, 471–484 [DOI] [PubMed] [Google Scholar]
- 2. Sabatini D. M. (2006) mTOR and cancer: insights into a complex relationship. Nat. Rev. Cancer 6, 729–734 [DOI] [PubMed] [Google Scholar]
- 3. Zoncu R., Efeyan A., Sabatini D. M. (2011) mTOR: from growth signal integration to cancer, diabetes and ageing. Nat. Rev. Mol. Cell Biol. 12, 21–35 [DOI] [PMC free article] [PubMed] [Google Scholar]
- 4. Hay N., Sonenberg N. (2004) Upstream and downstream of mTOR. Genes Dev. 18, 1926–1945 [DOI] [PubMed] [Google Scholar]
- 5. Sarbassov D. D., Guertin D. A., Ali S. M., Sabatini D. M. (2005) Phosphorylation and regulation of Akt/PKB by the rictor-mTOR complex. Science 307, 1098–1101 [DOI] [PubMed] [Google Scholar]
- 6. Hresko R. C., Mueckler M. (2005) mTOR·RICTOR is the Ser-473 kinase for Akt/protein kinase B in 3T3-L1 adipocytes. J. Biol. Chem. 280, 40406–40416 [DOI] [PubMed] [Google Scholar]
- 7. Guertin D. A., Sabatini D. M. (2007) Defining the role of mTOR in cancer. Cancer Cell 12, 9–22 [DOI] [PubMed] [Google Scholar]
- 8. Dancey J. (2010) mTOR signaling and drug development in cancer. Nat. Rev. Clin. Oncol. 7, 209–219 [DOI] [PubMed] [Google Scholar]
- 9. Shaw R. J., Cantley L. C. (2006) Ras, PI(3)K and mTOR signalling controls tumour cell growth. Nature 441, 424–430 [DOI] [PubMed] [Google Scholar]
- 10. Xing M. (2010) Genetic alterations in the phosphatidylinositol 3-kinase/Akt pathway in thyroid cancer. Thyroid 20, 697–706 [DOI] [PMC free article] [PubMed] [Google Scholar]
- 11. Sekulić A., Hudson C. C., Homme J. L., Yin P., Otterness D. M., Karnitz L. M., Abraham R. T. (2000) A direct linkage between the phosphoinositide 3-kinase-AKT signaling pathway and the mammalian target of rapamycin in mitogen-stimulated and transformed cells. Cancer Res. 60, 3504–3513 [PubMed] [Google Scholar]
- 12. Edinger A. L., Thompson C. B. (2004) An activated mTOR mutant supports growth factor-independent, nutrient-dependent cell survival. Oncogene 23, 5654–5663 [DOI] [PubMed] [Google Scholar]
- 13. Reinke A., Chen J. C., Aronova S., Powers T. (2006) Caffeine targets TOR complex I and provides evidence for a regulatory link between the FRB and kinase domains of Tor1p. J. Biol. Chem. 281, 31616–31626 [DOI] [PubMed] [Google Scholar]
- 14. Urano J., Sato T., Matsuo T., Otsubo Y., Yamamoto M., Tamanoi F. (2007) Point mutations in TOR confer Rheb-independent growth in fission yeast and nutrient-independent mammalian TOR signaling in mammalian cells. Proc. Natl. Acad. Sci. U.S.A. 104, 3514–3519 [DOI] [PMC free article] [PubMed] [Google Scholar]
- 15. Ohne Y., Takahara T., Hatakeyama R., Matsuzaki T., Noda M., Mizushima N, Maeda T. (2008) Isolation of hyperactive mutants of mammalian target of rapamycin. J. Biol. Chem. 283, 31861–31870 [DOI] [PubMed] [Google Scholar]
- 16. Sato T., Nakashima A., Guo L., Coffman K., Tamanoi F. (2010) Single amino acid changes that confer constitutive activation of mTOR are discovered in human cancer. Oncogene 29, 2746–2752 [DOI] [PMC free article] [PubMed] [Google Scholar]
- 17. Mavrakis M., Lippincott-Schwartz J., Stratakis C. A., Bossis I. (2006) Depletion of type IA regulatory subunit (RIα) of protein kinase A (PKA) in mammalian cells and tissues activates mTOR and causes autophagic deficiency. Hum. Mol. Genet. 15, 2962–2971 [DOI] [PubMed] [Google Scholar]
- 18. Galoian K. A., Temple T. H., Galoyan A. (2011) Cytostatic effect of novel mTOR inhibitor, PRP-1 (galarmin), in MDA 231 (ER−) breast carcinoma cell line. PRP-1 inhibits mesenchymal tumors. Tumour Biol. 32, 745–751 [DOI] [PubMed] [Google Scholar]
- 19. Burnett P. E., Barrow R. K., Cohen N. A., Snyder S. H., Sabatini D. M. (1998) RAFT1 phosphorylation of the translational regulators p70 S6 kinase and 4E-BP1. Proc. Natl. Acad. Sci. U.S.A. 95, 1432–1437 [DOI] [PMC free article] [PubMed] [Google Scholar]
- 20. Murugan A. K., Xing M. (2011) Anaplastic thyroid cancers harbor novel oncogenic mutations of the ALK gene. Cancer Res. 71, 4403–4411 [DOI] [PMC free article] [PubMed] [Google Scholar]
- 21. Murugan A. K., Dong J., Xie J., Xing M. (2009) MEK1 mutations, but not ERK2 mutations, occur in melanomas and colon carcinomas, but none in thyroid carcinomas. Cell Cycle 8, 2122–2124 [DOI] [PubMed] [Google Scholar]
- 22. Fukui Y., Ihara S. (2010) A mutant of SWAP-70, a phosphatidylinositoltrisphosphate-binding protein, transforms mouse embryo fibroblasts, which is inhibited by sanguinarine. PLoS One 5, e14180. [DOI] [PMC free article] [PubMed] [Google Scholar]
- 23. Berven L. A, Crouch M. F. (2000) Cellular function of p70S6K: a role in regulating cell motility. Immunol. Cell Biol. 78, 447–451 [DOI] [PubMed] [Google Scholar]
- 24. Hou P., Ji M., Xing M. (2008) Association of PTEN gene methylation with genetic alterations in the phosphatidylinositol 3-kinase/AKT signaling pathway in thyroid tumors. Cancer 113, 2440–2447 [DOI] [PubMed] [Google Scholar]
- 25. Samuels Y., Wang Z., Bardelli A., Silliman N., Ptak J., Szabo S., Yan H., Gazdar A., Powell S. M., Riggins G. J., Willson J. K., Markowitz S., Kinzler K. W., Vogelstein B., Velculescu V. E. (2004) High frequency of mutations of the PIK3CA gene in human cancers. Science 304, 554. [DOI] [PubMed] [Google Scholar]
- 26. Liu Z., Hou P., Ji M., Guan H., Studeman K., Jensen K., Vasko V., El-Naggar A. K., Xing M. (2008) Highly prevalent genetic alterations in receptor tyrosine kinases and phosphatidylinositol 3-kinase/akt and mitogen-activated protein kinase pathways in anaplastic and follicular thyroid cancers. J. Clin. Endocrinol. Metab. 93, 3106–3116 [DOI] [PubMed] [Google Scholar]
- 27. Cancer Genome Atlas Research Network (2008) Comprehensive genomic characterization defines human glioblastoma genes and core pathways. Nature 455, 1061–1068 [DOI] [PMC free article] [PubMed] [Google Scholar]
- 28. Dalgliesh G. L., Furge K., Greenman C., Chen L., Bignell G., Butler A., Davies H., Edkins S., Hardy C., Latimer C., Teague J., Andrews J., Barthorpe S., Beare D., Buck G., Campbell P. J., Forbes S., Jia M., Jones D., Knott H., Kok C. Y., Lau K. W., Leroy C., Lin M. L., McBride D. J., Maddison M., Maguire S., McLay K., Menzies A., Mironenko T., Mulderrig L., Mudie L., O'Meara S., Pleasance E., Rajasingham A., Shepherd R., Smith R., Stebbings L., Stephens P., Tang G., Tarpey P. S., Turrell K., Dykema K. J., Khoo S. K., Petillo D., Wondergem B., Anema J., Kahnoski R. J, Teh B. T., Stratton M. R., Futreal P. A. (2010) Systematic sequencing of renal carcinoma reveals inactivation of histone-modifying genes. Nature 463, 360–363 [DOI] [PMC free article] [PubMed] [Google Scholar]
- 29. Robbins C. M., Tembe W. A., Baker A., Sinari S., Moses T. Y., Beckstrom-Sternberg S., Beckstrom-Sternberg J., Barrett M., Long J., Chinnaiyan A., Lowey J., Suh E., Pearson J. V., Craig D. W., Agus D. B., Pienta K. J., Carpten J. D. (2011) Copy number and targeted mutational analysis reveals novel somatic events in metastatic prostate tumors. Genome Res. 21, 47–55 [DOI] [PMC free article] [PubMed] [Google Scholar]
- 30. Kang S., Bader A. G., Vogt P. K. (2005) Phosphatidylinositol 3-kinase mutations identified in human cancer are oncogenic. Proc. Natl. Acad. Sci. U.S.A. 102, 802–807 [DOI] [PMC free article] [PubMed] [Google Scholar]
- 31. Davies H., Hunter C., Smith R., Stephens P., Greenman C., Bignell G., Teague J., Butler A., Edkins S., Stevens C., Parker A., O'Meara S., Avis T., Barthorpe S., Brackenbury L., Buck G., Clements J., Cole J., Dicks E., Edwards K., Forbes S., Gorton M., Gray K., Halliday K., Harrison R., Hills K., Hinton J., Jones D., Kosmidou V., Laman R., Lugg R., Menzies A., Perry J., Petty R., Raine K., Shepherd R., Small A., Solomon H., Stephens Y., Tofts C., Varian J., Webb A., West S., Widaa S., Yates A., Brasseur F., Cooper C. S., Flanagan A. M., Green A., Knowles M., Leung S. Y., Looijenga L. H., Malkowicz B., Pierotti M. A, Teh B. T., Yuen S. T., Lakhani S. R., Easton D. F., Weber B. L., Goldstraw P., Nicholson A. G., Wooster R., Stratton M. R., Futreal P. A. (2005) Somatic mutations of the protein kinase gene family in human lung cancer. Cancer Res. 65, 7591–7595 [DOI] [PubMed] [Google Scholar]
- 32. Ngo V. N., Young R. M., Schmitz R., Jhavar S., Xiao W., Lim K. H., Kohlhammer H., Xu W., Yang Y., Zhao H., Shaffer A. L., Romesser P., Wright G., Powell J., Rosenwald A., Muller-Hermelink H. K, Ott G., Gascoyne R. D., Connors J. M., Rimsza L. M., Campo E., Jaffe E. S, Delabie J., Smeland E. B., Fisher R. I, Braziel R. M., Tubbs R. R., Cook J. R., Weisenburger D. D., Chan W. C., Staudt L. M. (2011) Oncogenically active MYD88 mutations in human lymphoma. Nature 470, 115–119 [DOI] [PMC free article] [PubMed] [Google Scholar]
- 33. Sturgill T. W., Hall M. N. (2009) Activating mutations in TOR are in similar structures as oncogenic mutations in PI3KCα. ACS Chem. Biol. 4, 999–1015 [DOI] [PMC free article] [PubMed] [Google Scholar]
- 34. Hardt M., Chantaravisoot N., Tamanoi F. (2011) Activating mutations of TOR (target of rapamycin). Genes Cells 16, 141–151 [DOI] [PMC free article] [PubMed] [Google Scholar]
- 35. Nawroth R., Stellwagen F., Schulz W. A., Stoehr R., Hartmann A., Krause B. J., Gschwend J. E., Retz M. (2011) S6K1 and 4EBP1 are independent regulated and control cellular growth in bladder cancer. PLoS ONE 6, e27509. [DOI] [PMC free article] [PubMed] [Google Scholar]
- 36. Magnuson B., Ekim B., Fingar D. C. (2012) Regulation and function of ribosomal protein S6 kinase (S6K) within mTOR signalling networks. Biochem. J. 441, 1–21 [DOI] [PubMed] [Google Scholar]
- 37. Vogelstein B., Kinzler K. W. (2004) Cancer genes and the pathways they control. Nat. Med. 10, 789–799 [DOI] [PubMed] [Google Scholar]
- 38. Gerlinger M., Rowan A. J., Horswell S., Larkin J., Endesfelder D., Gronroos E., Martinez P., Matthews N., Stewart A., Tarpey P., Varela I., Phillimore B., Begum S., McDonald N. Q., Butler A., Jones D., Raine K., Latimer C., Santos C. R., Nohadani M., Eklund A. C., Spencer-Dene B., Clark G., Pickering L., Stamp G., Gore M., Szallasi Z., Downward J., Futreal P. A., Swanton C. (2012) Intratumor heterogeneity and branched evolution revealed by multiregion sequencing. N. Engl. J. Med. 366, 883–892 [DOI] [PMC free article] [PubMed] [Google Scholar]
- 39. Volante M., Rapa I., Gandhi M., Bussolati G., Giachino D., Papotti M., Nikiforov Y. E. (2009) RAS mutations are the predominant molecular alteration in poorly differentiated thyroid carcinomas and bear prognostic impact. J. Clin. Endocrinol. Metab. 94, 4735–4741 [DOI] [PubMed] [Google Scholar]
- 40. Aleskandarany M. A., Rakha E. A., Ahmed M. A., Powe D. G., Paish E. C., Macmillan R. D., Ellis I. O., Green A. R. (2010) PIK3CA expression in invasive breast cancer: a biomarker of poor prognosis. Breast Cancer Res. Treat. 122, 45–53 [DOI] [PubMed] [Google Scholar]
- 41. Ogino S., Nosho K., Kirkner G. J., Shima K., Irahara N., Kure S., Chan A. T., Engelman J. A., Kraft P., Cantley L. C., Giovannucci E. L., Fuchs C. S. (2009) PIK3CA mutation is associated with poor prognosis among patients with curatively resected colon cancer. J. Clin. Oncol. 27, 1477–1484 [DOI] [PMC free article] [PubMed] [Google Scholar]
- 42. Liu D., Hou P., Liu Z., Wu G., Xing M. (2009) Genetic alterations in the phosphoinositide 3-kinase/Akt signaling pathway confer sensitivity of thyroid cancer cells to therapeutic targeting of Akt and mammalian target of rapamycin. Cancer Res. 69, 7311–7319 [DOI] [PMC free article] [PubMed] [Google Scholar]
- 43. Di Nicolantonio F., Arena S., Tabernero J., Grosso S., Molinari F., Macarulla T., Russo M., Cancelliere C., Zecchin D., Mazzucchelli L., Sasazuki T., Shirasawa S., Geuna M., Frattini M., Baselga J., Gallicchio M., Biffo S., Bardelli A. (2010) Deregulation of the PI3K and KRAS signaling pathways in human cancer cells determines their response to everolimus. J. Clin. Invest. 120, 2858–2866 [DOI] [PMC free article] [PubMed] [Google Scholar]
- 44. Liu R., Liu D., Trink E., Bojdani E., Ning G., Xing M. (2011) The Akt-specific inhibitor MK2206 selectively inhibits thyroid cancer cells harboring mutations that can activate the PI3K/Akt pathway. J. Clin. Endocrinol. Metab. 96, E577–E585 [DOI] [PMC free article] [PubMed] [Google Scholar]
- 45. Weigelt B., Warne P. H., Downward J. (2011) PIK3CA mutation, but not PTEN loss of function, determines the sensitivity of breast cancer cells to mTOR inhibitory drugs. Oncogene 30, 3222–3233 [DOI] [PubMed] [Google Scholar]
Associated Data
This section collects any data citations, data availability statements, or supplementary materials included in this article.