

Background: Cardiotonic steroids are specific inhibitors of Na,K-ATPase important for treatment of congestive heart failure.
Results: The sugar moiety and the steroid hydroxyls are pivotal for inhibition and pH dependence.
Conclusion: The sugar moiety is necessary for closing the access pathway for cardiotonic steroids.
Significance: Knowledge of structural and functional features of cardiotonic steroid binding could be important for drug design.
Keywords: Docking; Enzyme Inhibitors; Enzyme Structure; Na,K-ATPase; Protein Structure; Cardiac Glycoside Inhibition; Cardiotonic Steroids; Ouabain Binding Site; Structure-Activity Relationship
Abstract
The Na,K-ATPase is specifically inhibited by cardiotonic steroids (CTSs) like digoxin and is of significant therapeutic value in the treatment of congestive heart failure and arrhythmia. Recently, new interest has arisen in developing Na,K-ATPase inhibitors as anticancer agents. In the present study, we compare the potency and rate of inhibition as well as the reactivation of enzyme activity following inhibition by various cardiac glycosides and their aglycones at different pH values using shark Na,K-ATPase stabilized in the E2MgPi or in the E2BeFx conformations. The effects of the number and nature of various sugar residues as well as changes in the positions of hydroxyl groups on the β-side of the steroid core of cardiotonic steroids were investigated by comparing various cardiac glycoside compounds like ouabain, digoxin, digitoxin, and gitoxin with their aglycones. The results confirm our previous hypothesis that CTS binds primarily to the E2-P ground state through an extracellular access channel and that binding of extracellular Na+ ions to K+ binding sites relieved the CTS inhibition. This reactivation depended on the presence or absence of the sugar moiety on the CTS, and a single sugar is enough to impede reactivation. Finally, increasing the number of hydroxyl groups of the steroid was sterically unfavorable and was found to decrease the inhibitory potency and to confer high pH sensitivity, depending on their position on the steroid β-face. The results are discussed with reference to the recent crystal structures of Na,K-ATPase in the unbound and ouabain-bound states.
Introduction
Ouabain was the first cardiotonic steroid (CTS)2 shown to be a specific inhibitor of the Na,K-ATPase (1). This is believed to be the basis for the long-known therapeutic effect of CTSs, like digoxin and digitoxin, in treatment of congestive heart failure and arrhythmia. Inhibition of myocardial cell Na,K-ATPase raises intracellular Na+ concentration, which suppresses NCX, the 3Na+-Ca2+ exchanger, thus increasing intracellular Ca2+ stores, producing an increase in heart contractility and output (the inotropic effect). Recently, CTS as a mediator of anti-cancer effects has drawn much attention, emphasizing their potential use in oncology (2–4). Indeed, many cancer cells overexpress α1 (e.g. kidney cancers), or α3 (e.g. colon cancers) (for a review, see Ref. 2).
The Na,K-ATPase is indispensable in maintaining cellular ion homeostasis in animals. This integral membrane protein is an ion pump fueled by ATP and is responsible for actively maintaining the electrochemical gradients for Na+ and K+ across the animal cell membrane, which are essential for many physiological processes, like secondary active co- and countertransport and volume regulation, and forms the basis for maintaining the resting membrane potential. Cardiotonic steroids are composed of three major structural components (Fig. 1): 1) a steroid core, in which rings AB and CD are cis-fused, whereas rings BC are trans-fused; 2) a 5- or 6-membered lactone ring at position 17 (cardenolides or bufadienolides, respectively); and 3) a variable number of sugar residues at position 3. Thus, ouabain and evomonoside each contains one α-l-rhamnose residue, whereas digoxin, digitoxin, and gitoxin all contain three β-d-digitoxose molecules. In contrast to the cardiac glycosides, cardiac aglycones lack the sugar moiety. The sugar residues have been demonstrated to stabilize the enzyme·CTS complex through interactions of the 3′-α-hydroxyls with both proton-donating and proton-accepting groups on the enzyme (5).
FIGURE 1.

Two-dimensional structure of digoxigenin associated with d-digitoxose sugars used in this study (n = 1–4). Schemes show the positions of steroid –OH groups and sugars of the CTSs employed.
The CTS binding site of Na,K-ATPase is evolutionarily conserved (6), and it is known that ouabain binds from the extracellular side and mainly to the phosphorylated E2P conformation (7) or more specifically to the E2-P ground state of Na,K-ATPase, as demonstrated by measurement of the binding of the fluorescent anthroyl ouabain to various enzyme phosphoforms stabilized by fluoride analogues of phosphate (8). Indeed, recent investigations strongly indicate that CTSs reach their binding site through an extracellular access channel structure between M1-M2 and M4-M6 in the E2-P ground state (8, 9). To reach the binding site, ouabain causes rearrangements of the M1–M4 transmembrane helices to create a cavity much like the one observed in crystal structure of SERCA1a in the E2-P ground state stabilized by BeF3− (10, 11). Thus, association and especially dissociation of ouabain are relatively slow processes (12, 13). High concentrations of NaCl reactivate enzyme activity after inhibition by ouabagenin, but not by ouabain, demonstrating the pivotal role of the sugar moiety for closing the extracellular cation pathway (8). In the present study, this mechanism is further investigated by comparing different CTS compounds.
The crystal structure of ouabain-bound Na,K-ATPase in low affinity state (9) demonstrates that ouabain is bound deeply into the transmembrane domain with the lactone ring placed near the K+-binding sites and the sugar exposed to the solvent. A low resolution (4.6 Å) crystal structure of the high affinity E2P·ouabain state confirms this position of bound ouabain (14). The hydrophobic α-face of ouabain interacts with three Phe residues (Phe-323 on M4, Phe-790 and Phe-793 on M5; shark enzyme numbering), whereas the hydrophilic β-face shows little interaction with protein residues (9), which is the reason for the low affinity to ouabain. However, in the homology model of ouabain-bound Na+,K+-ATPase in the high affinity state (9, 15) and in the high affinity E2P·ouabain crystal structure (14), M1/M2 has approached the ouabain β-face, allowing, for example, Gln-118 and Asn-129 to interact with hydroxyl groups on the CTS steroid core. In a previous paper (16), it was found that ouabain and ouabagenin were the most pH-sensitive inhibitors, with a dramatic decrease in apparent affinity at high pH, indicating that the steroid hydroxyl groups are essential for this pH effect. In the present investigation, we describe the importance of hydroxyl groups at various positions on the β-side of the steroid core as well as the effects of the nature and number of sugar residues for the decrease in inhibitory potency of various CTSs at high pH, and we attempt to relate this to the structural changes following ouabain binding to Na,K-ATPase as observed in the known crystal structures.
EXPERIMENTAL PROCEDURES
Materials
The cardiotonic steroids ouabain, ouabagenin, digitoxin, digitoxigenin, digoxin, digoxigenin, strophanthidin, strophanthidol, and bufalin were obtained from Sigma-Aldrich. Evomonoside was from ABCR GmbH & Co. (Karlsruhe, Germany). Gamabufotalin was from Faces Biomedical (China). Digoxigenin didigitoxide was from Santa Cruz Biotechnology, Inc. (Santa Cruz, CA), and other digitoxose sugar derivatives of digoxigenin (digoxigenin mono- and tetradigitoxide) were a gift from Drs. Adriana Katz and Steven J. D. Karlish (Weizmann Institute of Science).
Preparation of Shark Na,K-ATPase
Crude membrane fractions (microsomes) from the rectal gland of the shark Squalus acanthias were prepared by homogenization followed by washing and isolation by centrifugation in 30 mm histidine, 1 mm EDTA, 0.25 m sucrose, pH 6.8. The purified microsomes were activated by a mild deoxycholate treatment (∼0.15% deoxycholate) to extract extrinsic proteins and to open sealed vesicles. After washing and resuspension, the purified membrane preparation is obtained by differential centrifugation essentially as described previously (17). The preparation is suspended in histidine/EDTA buffer with 25% glycerol and kept at −20 °C. The preparation has a specific hydrolytic activity of ∼30 units/mg at 37 °C and contains the α1 and β1 subunits together with the FXYD10 regulatory subunit (18). Protein concentrations, ranging from 3 to 5 mg/ml, were determined using Peterson's modification (19) of the Lowry method (20), using bovine serum albumin as a standard.
Inhibition Assay of Na,K-ATPase Activity
Enzyme was incubated in 4 mm Mg, 1 mm Pi, and 30 mm imidazole to induce an E2P conformation. Then various concentrations of cardiotonic steroid were added at the desired pH and incubated for 1 h at 23 °C. After this preincubation, the enzyme was diluted 10 times in test solution containing 130 mm NaCl, 20 mm KCl, 3 mm ATP, 4 mm MgCl2, 30 mm imidazole (pH 7.5), and 0.066% albumin, and the residual hydrolytic activity was measured at 23 °C by the method of Baginski et al. (21).
Reactivation of Enzyme Activity after CTS Binding
To induce high affinity binding state for cardiotonic steroids to Na,K-ATPase, the enzyme was initially stabilized in the E2P conformation by incubation in MgPi for 10 min as described above. In order to stabilize the enzyme in the E2BeFx ground state, the enzyme was reacted with fluorides essentially as described by Cornelius et al. (8) as follows. The enzyme was incubated for 10 min in 25 mm Na+, 5 μm BeSO4, 5 mm NaF, and 30 mm imidazole at the desired pH. For both E2P and the E2BeFx, CTS was then added, and incubation continued for another 50 min. Reactivation of enzyme activity following the addition of 150 mm NaCl to CTS-inhibited enzyme was followed by activity measurements using the Fiske and SubbaRow method (22) with amidol as the reducing reagent because the fluorides apparently interfered with the Baginski method.
Isothermal Titration Calorimetry
An iTC200 microcalorimeter from MicroCal (Northampton, MA) was used for the measurement of heat generation associated with CTS binding to Na,K-ATPase phosphorylated by MgPi. Analysis of the experimental data was performed using the program Origin7 and a one-site binding model. 2.4 μl of digoxin (150 μm) or 2.4 μl of digoxigenin (300 μm) was injected at 250- or 350-s time intervals, respectively, into the cuvette containing 20 μm enzyme in 10 mm imidazole-HCl, pH 7.0, 3 mm MgCl2, 3 mm Pi-Tris, and 25% glycerol (23). All experiments were performed at 25 °C.
Statistics and Curve Fitting
Results are expressed as mean ± S.E. Inhibition by cardiotonic steroid was evaluated by fitting to a sigmoid dose-response equation,
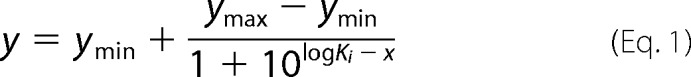 |
where ymin and ymax are base-line and maximum activity. Ki is the inhibitor concentration that gives 50% inhibition. Comparison between best fit values was performed using an F test, and p < 0.05 was considered significant.
Remodeling of the Na,K-ATPase·Ouabain Complex
Because the ouabain-bound model in a high affinity form (PDB entry 3N23) shows steric clashes between ouabain and Thr-797, some remodeling was necessary. For this purpose, 10 atomic models of ouabain with different conformations were generated by molecular dynamics simulation using Sybyl version 7.0 with a Tripos force field (Tripos, Inc., St. Louis, MO). Then 10 models of the Na,K-ATPase·ouabain complex were made by replacing the ouabain in 3N23 with new models generated here.
The position of ouabain was first refined by rigid body refinement using CNS (24) and the structure factor derived from 3N23. CNS parameter files for ouabain were generated with the HIC-Up server (the Hetero-compound Information Centre, Uppsala, Sweden; see Ref. 25) so that the conformation of ouabain was strongly restrained to the initial model. Then simulated annealing and energy minimization using CNS were applied to the models with the x-ray term off and examining the “energy” of the model. In these calculations, ouabain and the side chains of the residues within 5.0 Å from the ouabain were set free to move. The model that showed the lowest energy was adopted as the high affinity model and used for further calculations. The root mean square deviation of the remodeled ouabain from that in 3N23 was 0.31 Å.
Modeling of the Complex of Na,K-ATPase and Digoxin or Gitoxin
Coordinates of digoxin and gitoxin were obtained from the Protein Data Bank (PDB entry 3B0W) and the Cambridge Structural Database (IUCr A19351), respectively, and used for generating 10 atomic models of digoxin or gitoxin using Sybyl version 7.0. The model of digoxin or gitoxin was introduced into the atomic model of the Na,K-ATPase·ouabain complex so that the steroid core matched that of ouabain as closely as possible. Dihedral angles of glycosyl bonds between digitoxose residues were adjusted so that digitoxose residues could form hydrogen bonds with the charged residues on the L1/2, L3/4, and L7/8 loops of Na,K-ATPase. The atomic models were optimized by simulated annealing and energy minimization using CNS. The model that showed the lowest energy was adopted for further analyses. Protein pKa values were calculated using PROPKA version 3.1. Structural figures were prepared with PyMOL (Schrödinger, LLC, New York).
RESULTS
The Effects of Sugars on the Inhibitory Potency of Cardiotonic Steroids
To investigate the effects of the sugar moiety of CTS, the inhibitory potency of various cardiac glycosides and their aglycones was compared. The affinity for inhibition of shark Na,K-ATPase by cardiotonic steroids was determined after binding to the high affinity E2P conformation induced by incubation with Mg2+ and Pi, followed by measurement of residual activity. Na,K-ATPase was preincubated for 1 h with different concentrations of inhibitor (10−9 to 10−4 m) in the presence of MgPi and imidazole (pH 6.5, 7.5, or 8.5). The 1-h incubation time was necessary to achieve nearly equilibrium conditions with a constant level of inhibition. Following this, the residual Na,K-ATPase activity was determined at optimal turnover conditions (i.e. at 130 mm Na+, 20 mm K+, 4 mm Mg2+, 3 mm ATP, and 30 mm imidazole (pH 7.5)). Preincubation and subsequent activity measurements were performed at 23 °C.
In order to test the effect of CTS glycosylation, the inhibition curves for glycosylated and unglycosylated CTS were compared for a range of compounds (Table 1 and Fig. 2). The effect of glycosylation on the apparent inhibitor constant, Ki, was variable. As seen, by far the largest effect was observed with the ouabain/ouabagenin pair, where the presence of the sugar l-rhamnose increased the apparent affinity by a factor of more than 25. Also, the presence of three d-digitoxose sugars in gitoxin increased the Ki by a factor of almost 3 compared with that of gitoxigenin. In contrast, digitoxin and digoxin only showed moderate increase in inhibitor affinity (6 and 25%, respectively) compared with their aglycones, although they contain the same sugar moiety as gitoxin.
TABLE 1.
Inhibitor constant (Ki) for various cardiotonic steroids at pH 6.5, 7.5, and 8.5 after a 1-h preincubation at 23 °C (mean ± S.D., n = 3)
| CTS |
Ki |
Steroid –OH substitutions | ||
|---|---|---|---|---|
| pH 6.5 | pH 7.5 | pH 8.5 | ||
| μm | ||||
| Ouabagenin | 0.406 ± 0.077 | 2.28 ± 0.20 | 32.10 ± 0.78 | C1β, C5β, C11α, C19β |
| Ouabain | 0.086 ± 0.011 | 0.091 ± 0.011 | 1.18 ± 0.27 | C1β, C5β, C11α, C19β |
| Digitoxigenin | 0.132 ± 0.014 | 0.163 ± 0.018 | 0.373 ± 0.038 | |
| Digitoxin | 0.183 ± 0.001 | 0.176 ± 0.012 | 0.404 ± 0.028 | |
| Digoxigenin | 0.136 ± 0.006 | 0.195 ± 0.001 | 1.56 ± 0.34 | C12β |
| Digoxigenin monodigitoxide | 0.107 ± 0.08 | 0.122 ± 0.012 | 0.582 ± 0.64 | C12β |
| Digoxigenin didigitoxide | 0.101 ± 0.004 | 0.120 ± 0.006 | 0.614 ± 0.017 | C12β |
| Digoxin | 0.102 ± 0.008 | 0.131 ± 0.020 | 1.03 ± 0.04 | C12β |
| Digoxigenin tetradigitoxide | 0.078 ± 0.019 | 0.204 ± 0.014 | 1.46 ± 0.19 | C12β |
| Gitoxigenin | 0.375 ± 0.055 | 0.428 ± 0.035 | 6.28 ± 0.69 | C16β |
| Gitoxin | 0.144 ± 0.007 | 0.156 ± 0.012 | 0.423 ± 0.057 | C16β |
| Evomonoside | 0.100 ± 0.014 | 0.106 ± 0.009 | 0.174 ± 0.002 | |
| Strophanthidin | 0.139 ± 0.014 | 0.173 ± 0.038 | 0.549 ± 0.003 | C5β |
| Strophanthidol | 0.170 ± 0.021 | 0.166 ± 0.025 | 1.34 ± 0.14 | C5β, C19β |
| Bufalin | 0.140 ± 0.017 | 0.134 ± 0.001 | 0.271 ± 0.018 | |
| Gamabufotalin | 0.154 ± 0.013 | 0.159 ± 0.022 | 0.371 ± 0.021 | C11α |
FIGURE 2.

Comparison of inhibition of Na,K-ATPase activity by glycosylated and unglycosylated CTSs at pH 7.5. A, inhibition by digitoxin (Ki = 167 nm), digitoxigenin (Ki = 176 nm), and evomonoside (Ki = 105 nm). B, inhibition by digoxin (Ki = 147 nm) and digoxigenin (Ki = 194 nm). C, inhibition by gitoxin (Ki = 147 nm) and gitoxigenin (Ki = 403 nm). D, inhibition by ouabain (Ki = 89 nm) and ouabagenin (Ki = 2282 nm). Mean Ki values calculated from fitting to the sigmoid dose-response equation are given in Table 1.
Comparing digitoxin with evomonoside, where the three digitoxose residues of digitoxin are replaced with a single rhamnose residue, the Ki value was decreased for evomonoside, indicating that the nature of the sugar had some effect on the CTS affinity (Fig. 2 and Table 1). This is in accord with previous results demonstrating that the stability of Na,K-ATPase·cardiac monoglycoside complexes is higher for l-rhamnoside than for d-digitoxides (5, 26). The difference in the effect on the Ki values between the various glycoside/aglycone pairs, however, cannot depend solely on the number and/or nature of the sugar residues but must depend also on the steroid core (see below). Indeed, the same sugar moiety has different effects, depending on the number and positions of –OH groups present on the steroid core. The calculated apparent inhibitor constants (Ki) for the CTS compound measured in the present investigation are shown in Table 1. These values are consistent with previous observations, although many measurements were done under conditions that cannot be compared, with enzyme preparations from other species, or using different techniques (2, 5, 16, 26–29).
In order to investigate whether the number of sugar residues on the steroid of CTS affected the inhibitory potency, we compared the inhibitory effects of the aglycone digoxigenin with digoxigenin derivatives containing an increasing number of d-digitoxose molecules from one to four (see structure in Fig. 1) at pH 7.5. As seen from Fig. 3A, the inhibition constants at pH 7.5 were rather similar for the various digoxigenin derivatives, ranging from 110 to 150 nm, and a little lower than for digoxigenin itself, which was about 200 nm.
FIGURE 3.

Inhibition of digoxigenin and n-digitoxide digoxigenin (n = 1–4). A, inhibition curves at pH 7.5. ▿, digoxigenin, Ki = 194 nm; ○, digoxigenin monodigitoxide, Ki = 131 nm; □, digoxigenin didigitoxide, Ki = 137 nm; ♢, digitoxigenin tridigitoxide (digoxin), 115 nm; ▵, digoxigenin tetradigitoxide, Ki = 203 nm. B, Ki values for the different CTS compounds at pH 6.5 (▵), 7.5 (○), and 8.5 (□). Mean Ki values calculated from fitting to the sigmoid dose-response equation are given in Table 1. Error bars, S.E.
To test whether the effect of the number of sugar molecules on the steroid core was pH-dependent, the inhibition by digoxigenin and its sugar derivatives was measured at pH 6.5 and 8.5. As seen from Fig. 3B, the apparent inhibitor constants of the various digoxigenin compounds were rather similar at the lower pH of 6.5, and a small increase in affinity compared with pH 7.5 was observed for all tested compounds. However, increasing pH to 8.5 increased the Ki values drastically in a sugar-dependent way. Thus, Ki for digoxigenin increased more than 10 times, going from pH 6.5 to 8.5, whereas in the presence of a single sugar residue on digoxigenin, the increase in Ki was significantly decreased. As the number of digitoxose sugars increased, the effect on Ki increased proportionally, so that Ki for digoxigenin tetradigitoxide was almost identical to that for digoxigenin itself.
The effect of the three d-digitoxose sugar substitutions of digoxigenin on the binding to the phosphorylated enzyme was also examined by isothermal titration calorimetry (ITC). To measure the apparent enthalpy change, ΔH298, for the binding of digoxigenin or digoxin to shark Na,K-ATPase phosphorylated by MgPi, multiple single injections of digoxigenin (300 μm, 2.4-μl injections) or digoxin (150 μm, 2.4-μl injections) into Na,K-ATPase (20 μm) in the presence of 3 mm MgPi were performed. As seen from Fig. 4, A and B (top panels), each injection was followed by a negative power signal (μcal/s) representing the power that needs to be applied to the sample cell to maintain isothermal conditions with respect to the reference cell. The negative sign indicates an exothermic binding reaction (i.e. a reduction in power is necessary). After each pulse, the system returned to the base line, indicating that no further CTS binding occurred. The integral under each power peak yields the enthalpy change of the reaction. As seen, the power peaks decreased and became broader with each titration as the concentration of free receptor sites decreased, until they became constant and narrow again. The latter constant peak intensities, which are considered to represent nonspecific CTS binding to the lipid phase and therefore are highest for the more hydrophobic digoxigenin, were subtracted from the former peak intensities, representing high affinity binding of CTS, to give the concentration ratio (CTS/Na,K-ATPase) dependence of the binding heat changes depicted in the bottom panels of Fig. 4, A and B. Fitting these data using a single-site model yielded apparent enthalpy changes of −45.8 ± 0.6 kJ·mol−1 (−10.96 kcal·mol−1) for binding of digoxin and −27.9 ± 0.8 kJ·mol−1 (−6.69 kcal·mol−1) for binding of digoxigenin. As noted from Fig. 4, A and B, saturation of the CTS binding sites occurred at a molar ratio of less than 1 for digoxin (n = 0.60 ± 0.01) and close to 1 for digoxigenin (n = 0.93 ± 0.03). The binding constants (K) and entropy changes (ΔS298) could not be determined very accurately under these conditions. The binding constants amounted to 5.3·106 ± 0.7·106 m−1 for digoxin and 15.4·106 ± 0.7·106 m−1 for digoxigenin, giving inhibitor constants (Ki) of about 189 nm for digoxin and 65 nm for digoxigenin, in reasonable agreement with the inhibition measurements (Table 1). The entropy changes were approximately −25.1 J·K−1·mol−1 (−6.0 cal·K−1·mol−1) for digoxin and 43.5 J·K−1·mol−1 (10.4 cal·K−1·mol−1) for digoxigenin. A positive ΔS is a strong indication that water molecules are expelled from the complex interface, whereas ordering of water at the complex interface contributes unfavorably to ΔS. The data were not sufficient yet, however, to conclude whether the difference in ΔS for digoxin and digoxigenin was significant. A previous investigation using ITC to determine the heat change of binding of ouabain to shark Na,K-ATPase under very similar conditions found an apparent enthalpy change of −85 ± 5 kJ·mol−1 and a stoichiometric coefficient of 0.62 ± 0.05 (30), in reasonable agreement with the data for digoxin binding in the present investigation.
FIGURE 4.

ITC of digoxin and digoxigenin binding to phosphorylated Na,K-ATPase. Shown is a series of 2.4-μl sequential single injections of digoxin (150 μm) (A) and digoxigenin (300 μm) (B) into shark Na,K-ATPase (20 μm). The experiments were conducted at 25 °C in a medium containing 10 mm imidazole-HCl (pH 7.0), 3 mm MgCl2, 3 mm Pi-Tris, and 25% glycerol. The top panels show the power (μcal·s−1) that needs to be applied to the sample cell to maintain isothermal conditions relative to the reference cell. Integrations of the individual peaks yield the apparent enthalpy change of the binding reaction, which is depicted in the bottom panels as a function of the CTS/Na,K-ATPase molar ratio. Fitting of the data (curves in the bottom panels) with a one-site binding model gave the following parameters. A, digoxin: ΔH298 = −45.8 ± 0.6 kJ·mol−1, K = 5.3·106 ± 0.7·106 m−1, ΔS298 ≅ −25 J·K−1·mol−1, and n = 0.60 ± 0.01. B, digoxigenin, ΔH298 = −28.0 ± 0.7 kJ·mol−1, K = 15.4·106 ± 0.7·106 m−1, ΔS298 ≅ 44 J·K−1·mol−1, and n = 0.93 ± 0.03.
Reactivation following Inhibition by CTS
We have previously demonstrated that CTS inhibition of Na,K-ATPase is partially relieved by the addition of Na+ from the extracellular side and that the effect of the sugar moiety on the reactivation is quite dramatic, as demonstrated by comparing reactivation of enzyme inhibited by either ouabain or ouabagenin (8). Thus, the reactivation of enzyme inhibited by ouabain or ouabagenin in the E2-P ground state stabilized by BeFx is significant only in the ouabagenin-inhibited enzyme (i.e. in the absence of a sugar moiety) (see Fig. 10C in Ref. 8). Here we demonstrate that this is a general finding by comparing reactivation of inhibited Na,K-ATPase by high Na+ for a range of glycosylated and non-glycosylated CTSs bound to either the E2P formed by phosphorylation of the enzyme with MgPi, which produces a mixture of E2P phosphoforms (here termed E2MgPi), or to the E2-P ground state analog stabilized by BeFx. The enzyme was first reacted with MgPi or BeFx for 10 min, and then the CTS was added, and incubation continued for a further 50 min at 23 °C. At time 0, 150 mm NaCl was added, and the activity was measured at optimal conditions (i.e. at 130 mm Na+, 20 mm K+, 4 mm Mg2+, 3 mm ATP, and 30 mm imidazole, pH 7.5) with time. Dilution of enzyme with bound aglycones may cause instability of the complex and dissociation of the aglycone (31); therefore, the final CTS concentration after dilution with NaCl was kept high enough (>10 times Ki at all pH values) to ensure maximum inhibition. Under these conditions, measurements in the presence or absence of aglycone in the test solution at a concentration identical to that in the preincubation solution were identical. Fig. 5A shows reactivation of enzyme activity after inhibition by glycosides or aglycones to the MgPi-reacted enzyme. In Fig. 5B, the same is shown for reactivation of enzyme activity after CTS binding to the BeFx-stabilized enzyme. The same general pattern was observed in the two cases; whereas the reactivation of enzyme activity after cardiac glycoside binding by 150 mm NaCl was almost absent, there was a considerable, but slow reactivation for all five of the different aglycones used. The degree of reactivation obtained after binding of the various cardiac aglycones to the E2-P ground state stabilized by BeFx at concentrations of ∼100 × Ki was between 30 and 100% of the fully active enzyme in the following ranking: digoxigenin (100%) > ouabagenin (66%) > digitoxigenin = gitoxigenin (52%) > bufalin (30%). In the case of E2MgPi, the reactivation rate of gitoxigenin-bound enzyme was considerably faster than those for the other CTSs in the order (Fig. 5A): gitoxigenin ≫ digitoxigenin ≥ ouabagenin > digoxigenin ≫ bufalin. In the case of E2-P ground state stabilized by BeFx (Fig. 5B), the rates were more alike, but again the fastest reactivation was obtained with the gitoxigenin-reacted enzyme. For both E2MgPi and E2BeFx, the reactivation was faster at lower pH, and, for both conformations, the reactivation rate constant was the lowest for bufalin and the highest for gitoxigenin (not shown). It was also noted that the rates of reactivation following cardiac aglycone inhibition were generally higher (about 30–40%) for CTS-bound enzyme in the E2MgPi conformation than for CTS-bound enzyme in the E2BeFx conformation. Fig. 6 further demonstrates the difference in the levels of reactivation obtained following inhibition by either digitoxigenin or digitoxin, which have similar Ki values (Table 1), and whether the inhibitor is bound to enzyme phosphorylated by MgPi or to the E2-P ground state stabilized by BeFx. As seen in Fig. 6, the reactivation level was significantly higher for the cardiac aglycone digitoxigenin than for the cardiac glycoside digitoxin. Thus, reactivation was absent above 10 μm digitoxin and was half-maximum at about 4 μm, whereas about 50% reactivation was present at 10 μm digitoxigenin. Reactivation of digitoxin-bound enzyme was similar for MgPi- or BeFx-reacted enzyme, whereas a notable difference in reactivation was observed in the case of digitoxigenin, where the reactivation of MgPi-reacted enzyme was significantly larger than that of BeFx-reacted enzyme. This indicates that the complex of cardiac aglycones bound to other E2P conformations present in the MgPi-reacted enzyme (i.e. E2·P product state and E2∼P transition state) are more unstable than that of digitoxigenin bound to the E2-P ground state stabilized by BeFx. This difference in stability of the inhibitor·enzyme complexes was absent in the presence of a sugar moiety.
FIGURE 10.

Comparison of pH dependence of inhibition between various ouabain derivatives. In A, the Ki values are shown for ouabain (○ and ●), dihydro-ouabain (♢ and ♦), and evomonoside (□) at standard conditions with 5 mm Mg2+ (open symbols) or with 10 mm Mg2+ (filled symbols) during preincubation with Na,K-ATPase at different pH values. B, Ki values for ouabain as a function of the [Mg2+] in the preincubation medium at pH 8.0 (□), 8.5 (▵), and 8.7 (○). C, Ki values for ouabagenin preincubated at different pH values at standard conditions with 5 mm Mg2+ (□), with 10 mm Mg2+ (■), with 5 mm Mg2+ plus 10 mm Na+ (⊡), or with 5 mm Mg2+ plus 0.5 mm K+ (⟐). Error bars, S.E.
FIGURE 5.

Reactivation of enzyme with 150 mm NaCl after inhibition by CTS at pH 7.5. A and B, reactivation after CTS binding to enzyme phosphorylated by MgPi (A) and in the E2-P ground state stabilized by BeFx (B), respectively. The reactivation is given relative to the maximum reactivation obtained for each CTS compound. ▿, gitoxigenin (40 μm); ○, ouabagenin (100 μm); □, digitoxigenin (10 μm); ▵, digoxigenin (15 μm); ♢, bufalin (10 μm). The closed symbols are the glycosylated compounds (all at 10 μm). The data for the aglycones are fitted with monoexponentials given by the curves, with the following observed rate constants in A: gitoxigenin, kobs = 6.18 ± 0.42·10−3 s−1; ouabagenin, kobs = 1.10 ± 0.02·10−3 s−1; digitoxigenin, kobs = 1.20 ± 0.03·10−3 s−1; digoxigenin, kobs = 0.90 ± 0.03·10−3 s−1; bufalin, kobs = 0.30 ± 0.02·10−3 s−1. In B, the observed rate constants are as follows: gitoxigenin, kobs = 0.95 ± 0.03·10−3 s−1; ouabagenin, kobs = 0.52 ± 0.02·10−3 s−1; digitoxigenin, kobs = 0.80 ± 0.02·10−3 s−1; digoxigenin, kobs = 0.67 ± 0.02·10−3 s−1; bufalin, kobs = 0.55 ± 0.02·10−3 s−1.
FIGURE 6.

Reactivation at pH 7.5 after digitoxin (○ and ●) and digitoxigenin inhibition (□ and ■) of enzyme phosphorylated by MgPi (filled symbols) or in the E2-P ground state stabilized by BeFx (open symbols). Shown are the activity levels after reactivation with 150 mm NaCl for 90 min at 23 °C following inhibition with increasing inhibitor concentrations. The curves are fit to the data using monoexponential decay. The fit parameters are as follows: digitoxin (BeFx), kobs = 0.19 ± 0.03 min−1, plateau = 0 μmol·mg−1·h−1 (fixed); digoxin (MgPi), kobs = 0.18 ± 0.02 min−1, plateau = 0 μmol·mg−1·h−1 (fixed); digitoxigenin (BeFx), kobs = 0.14 ± 0.04 min−1 and plateau = 155 ± 32 μmol·mg−1·h−1; digitoxigenin (MgPi), kobs = 0.021 ± 0.005 min−1 and plateau = 199 ± 27 μmol·mg−1·h−1.
In the following, it was tested whether the number of sugar residues on the steroid moiety of the aglycone was important for the reactivation of enzyme activity. Fig. 7 compares the reactivation of enzyme activity after binding of digoxigenin or its glycosides with one to four digitoxose residues to either E2MgPi or E2BeFx. As seen in Fig. 7, a single sugar residue was enough to seriously decrease reactivation of enzyme activity. Indeed, the reactivation of enzyme activity of digoxigenin monodigitoxide-bound enzyme was only 10% complete after 90 min, whereas digoxigenin-bound enzyme was fully reactivated after 60 min. Furthermore, the rate of the reactivation was found to be inversely proportional to the number of sugar residues on digoxigenin, as shown in Fig. 8, and saturated at about 5·10−6 s−1 for digoxin. The rate of reactivation for digoxigenin tetradigitoxide was too low to be measured accurately. Thus, increasing the number of digitoxose residues on digoxigenin increased the stability of the CTS complex with the enzyme, as also previously demonstrated by Yoda et al. (32).
FIGURE 7.

Reactivation of digoxigenin and digoxigenin n-digitoxide-inhibited enzyme with 150 mm NaCl at pH 7.5. Panels A and B are enzymes phosphorylated by MgPi, and in the E2-P ground state stabilized by BeFx, respectively. The symbols are: ♢, digoxigenin; ○, digoxigenin monodigitoxide; □, digoxigenin didigitoxide; ▿, digoxigenin tridigitoxide (digoxin); ▵, digoxigenin tetradigitoxide.
FIGURE 8.
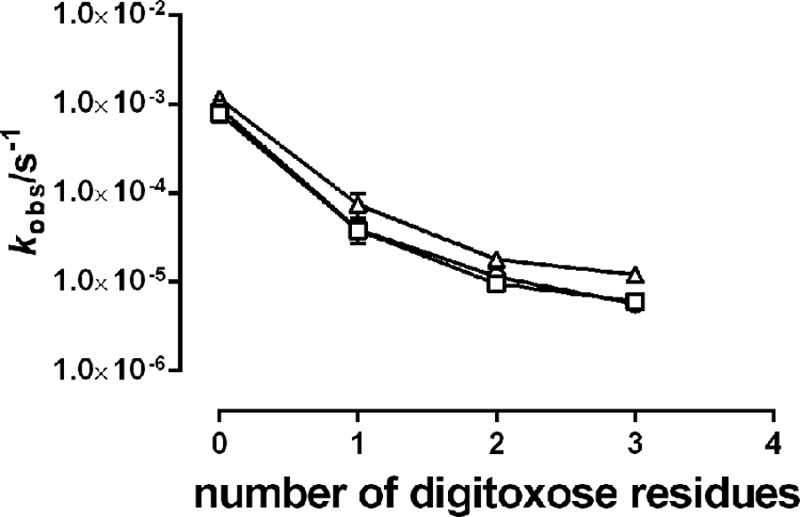
pH dependence of reactivation rates. Observed rate constants of reactivation of digoxigenin- and digoxigenin n-digitoxide-inhibited enzyme in the MgPi-phosphorylated state with 150 mm NaCl at pH 6.5 (▵), pH 7.5 (○), and pH 8.5 (□). Note that the y axis is logarithmic.
Steroid Core Hydroxyl Groups and pH Sensitivity
In the following, the effects of –OH groups at different positions on the steroid core of a range of CTS compounds, as detailed in Fig. 1 (table), were compared at different pH values. Digitoxigenin and bufalin contain only the universally present –OH groups at C3 and C14, whereas digoxigenin and gitoxigenin have an additional –OH group at C12 and C16, respectively. Ouabagenin has four additional –OH groups at positions C1, C5, C11, and C19. All of these hydroxyl groups, except that at C11, are exposed to the β-side of the steroid. When the inhibitory potency of the aglycones tested in this investigation was compared, the following ranking of Ki values was obtained: bufalin < digitoxigenin < strophanthidin < strophanthidol < digoxigenin < gitoxigenin ≪ ouabagenin. This order was identical at high pH (Fig. 9A). This indicates that steroid –OH groups are sterically unfavorable for the inhibitory potency of cardiac aglycones. The difference between bufalin and digitoxigenin indicates a slightly larger inhibitory effect when the lactone ring is six-membered (16).
FIGURE 9.

pH effects on CTS inhibitory potency. A compares the apparent inhibitor constants (Ki) for cardiac aglycones measured at pH 7.5 (light gray bars) and 8.5 (dark gray bars; note that the ouabagenin value at pH 8.5 (hatched bar) is given on the right ordinate). B compares the ratio of apparent inhibitor constants obtained at pH 8.5 and 7.5 for the inhibition by various cardiac aglycone/cardiac glycoside pairs and for bufalin and evomonoside. Error bars, S.E.
We have previously demonstrated that the very drastic effect of high pH (pH 8.5) on inhibitory potency of ouabain and ouabagenin could not be explained by the shift in the poise of the E1P/E2P equilibrium toward E1P and hypothesized that it was related to the presence of hydroxyl groups on the β-side of the steroid core (16). As can be seen from Fig. 5B, also digoxigenin and its glycosides with 1–4 sugar residues had this characteristic pH-induced shift in inhibitor potency, probably related in this case to the presence of an –OH group at C12. In Fig. 9B, we compared the shift of apparent inhibitory potency caused by increasing pH from 7.5 to 8.5 for cardiac glycosides and their aglycones with –OH groups at various positions on the steroid core. It is clear that the pH sensitivity, measured as the ratio of Ki values measured at pH 8.5 and 7.5, was independent of the presence of a sugar moiety, except for the gitoxin/gitoxigenin pair. However, as seen by comparing the Ki values for ouabain and ouabagenin in Fig. 10, A and B, and Table 1, the presence of a sugar moiety was critical for the absolute value of Ki. Comparison of evomonoside and ouabain, both with an α-l-rhamnose residue but different steroid hydroxyls, showed very different Ki sensitivity to high pH (Fig. 10A), confirming the role of steroid hydroxyls as modulators of pH sensitivity. Interestingly, if the Mg2+ concentration was increased from 5 to 10 mm during the 1-h incubation of Na,K-ATPase with CTS, the Ki value was significantly increased, especially at high pH values, both for the ouabain, ouabagenin, and dihydro-ouabain (Fig. 10, A and C, filled symbols). The pH sensitivity of dihydro-ouabagenin with a C20-C22-saturated lactone ring was higher than for ouabain, as also previously demonstrated (16), and still affected by increasing Mg2+ (Fig. 10A). The Mg2+ effect was low affinity and did not saturate within the concentration range investigated (Fig. 10B). Because a similar increase in the Ki for ouabagenin was obtained by including 10 mm Na+ or 0.5 mm K+ in the CTS preincubation (Fig. 10C), this effect is caused by binding to the cation binding sites, which affects the interaction with the lactone ring, similar to the effect of binding K+ ions that prevents closure of the CTS binding cavity, as described previously (9).
In Fig. 11, A and B, the time course of inhibition of digitoxigenin and ouabagenin (10−5 m) is shown at pH 6.5, 7.5, and 8.5, using either 5 mm Mg2+ (black symbols) or 10 mm Mg2+ (red symbols) in the CTS incubation medium. The binding rate decreased by increasing pH from 6.5 to pH 7.5 by a factor of ∼2 but decreased more significantly at pH 8.5 (by a factor of ∼10), and the inhibition tended to become biphasic, with a slow fraction comprising ∼75%. If the change in observed rate constants for inhibition measured at increasing pH from 6.5 to 8.5 for the various aglycones was compared (Fig. 11C), it was clear that ouabagenin (▵) was the compound with the lowest association rate. After ouabagenin followed digoxigenin (○), strophanthidol (⊙), gamabufotalin (⟐), and gitoxigenin (▿), with –OH substitutions at C12, C5/C19, C11, and C16, respectively. Digitoxigenin (□) and bufalin (♢) with no additional –OH groups, except for the one universally present at C14β, showed the fastest rate of inhibition. Even at pH 8.5, where the rate constants were more alike, this relation holds. The variations in the rates of inhibition versus pH were rather small for ouabagenin and digoxigenin in accordance with Yoda and Yoda (31), who previously found that the binding constant for digoxigenin (and ouabain) changes only slightly between pH 6.5 and 8.5. Increasing the Mg2+ concentration during CTS preincubation from 5 to 10 mm decreased the rate of inhibition (kobs) for all aglycones except ouabagenin, where Mg2+ had a slightly stimulating effect (Fig. 11C), which is also the case for ouabain (not shown). The fact that increasing Mg2+ affected most the CTSs with the fewest steroid –OH substitutions indicates that the Mg2+ effects are not related to the steroid hydroxyls but more likely to interactions with the lactone ring. Also, the effects of steroid hydroxyls on the CTS binding rates may be indirect through their effects on the lactone position.
FIGURE 11.

The pH-dependent rate of inhibition of enzyme activity induced by binding of various aglycones to enzyme phosphorylated by MgPi. A and B, the inhibition of Na,K-ATPase activity after preincubation at 10−5 m digitoxigenin (A) or ouabagenin (B) in the presence of 1 mm Pi and either 5 mm Mg2+ (black symbols) or 10 mm Mg2+ (red symbols) measured at pH 6.5 (○), 7.5 (□), and 8.5 (▵) and 23 °C as a function of time. The curves are double exponential fits to the data. C, observed rate constants measured at pH 6.5, 7.5, and 8.5 shown for the various aglycones incubated at 1 mm Pi and 5 mm Mg2+: ouabagenin (obg; ▵), digoxigenin (dgx; ○), gitoxigenin (gtx; ▿), digitoxigenin (dtx; □), strophanthidol (stro; ⊙), gamabufotalin (gbuf; ⟐), and bufalin (buf; ♢). In the case of digitoxigenin and ouabagenin, the data for incubation at 10 mm Mg2+ given in A and B are also shown in red (dtx′, obg′). For simplicity, observed rate constants using monoexponential fits are used.
Modeling of the Complex of Na,K-ATPase and Digoxin or Gitoxin
Because the high affinity model of the Na,K-ATPase·ouabain complex (PDB entry 3N23) shows steric clashes around ouabain and is derived from low (4.6 Å) resolution data, the model was first optimized by energy minimization. In this model, in which ouabain was shifted by ∼0.3 Å but still nicely fitted to the omit-annealed |Fo| − |Fc| electron density map (Fig. 13B), there was no steric clash around ouabain. In modeling of the complex of digoxin or gitoxin, CTSs were initially placed so that the steroid core matched that of ouabain. In the energetically optimized model, the steroid core of digoxin or gitoxin was shifted by 0.88 or 1.1 Å, respectively, toward M4 (Fig. 13C), and the hydroxyl at the C14β came at ∼2.5 Å distance from the Thr-797 hydroxyl, similarly to ouabain.
FIGURE 13.

Docking of CTS to Na,K-ATPase. A, superimposition of the α subunits of the low affinity (green) and high affinity (cyan) ouabain-bound crystal structures (PDB entries 3A3Y and 3N23). The most notable difference is the M1/M2 helices dispositions (arrow). Note that the Phe-790 (shark numbering) of the high affinity state is flipped and would clash with the ouabain steroid ring D if ouabain is not displaced toward M1/M2 in the high affinity state (red arrow). However, this lateral displacement is limited by the interaction between Thr-804 side chain and the steroid C14β–OH (red circle). In the 3N23, this distance is only 2.2 Å. B, shows remodeling of the ouabain in the atomic model of the ouabain-bound Na,K-ATPase complex in the high affinity state (PDB entry 3N23; see also Table 2). The annealed omit |Fo − Fc| electron density map is shown at 2.0 σ. The original is shown in magenta and the remodeled one in green. C, a stereo view of the optimized models of the gitoxin-bound (yellow), digoxin-bound (green), or ouabain-bound (white) Na,K-ATPase complexes.
In CTS binding to Na,K-ATPase, the position of the carbonyl group on the lactone ring plays an important role (33). In the optimized model, the lactone carbonyl of ouabain forms hydrogen bonds with the backbone amides of Val-322 and Ala-323. In the models of digoxin and gitoxin, the lactone carbonyl was shifted away from M4 by 1.5 or 2.3 Å, respectively. As a result, with digoxin, those hydrogen bonds appear to be somewhat reduced but more severely so with gitoxin, explaining the difference in affinity to Na,K-ATPase.
DISCUSSION
In the present study, the structural and functional features of CTS binding to Na,K-ATPase were investigated in relation to the crystal structure of Na,K-ATPase with bound ouabain (Fig 12). We investigated the functional effects of the sugar moiety as well as hydroxyl groups at various positions on the β-face of the steroid core of cardiotonic steroids (cf. Fig. 1) on the inhibitory potency and the inhibition rates of CTS using shark Na,K-ATPase. Furthermore, the rate of reactivation of shark Na,K-ATPase in E2P or E2-P ground conformation stabilized with MgPi or BeFx, respectively, following inhibition by the various cardiotonic steroids (comparing cardiac glycoside ouabain, digoxin, digitoxin, and gitoxin with their aglycones) was investigated.
FIGURE 12.

The Na,K-ATPase binding cavity for ouabain. Residues of the Na,K-ATPase α subunit important for coordination and ouabain are shown in sticks. In A, residues important for ouabain interaction in the low affinity ouabain-bound crystal structure are shown together with the two bound K+ ions represented by purple spheres (PDB 3A3Y); in B, the original high affinity ouabain-bound structure is shown (PDB entry 3N23). The arrows in A indicate how M1/M2 moves in the transition to the high affinity state. Residues (shark Na,K-ATPase numbering in A, pig kidney Na,K-ATPase numbering in B) within hydrogen bond distance are connected by yellow dotted lines. The steric clash between the hydroxyl at C14β and Thr-797 (distance 2.2 Å) is circled in red. In A and B, the α-face of the ouabain steroid is stacked with aromatic residues (Ile-322, Phe-323, Phe-790, Phe-793). In C, digoxin (PDB entry 3B0W) is shown docked onto the shark Na,K-ATPase with the steroid core A- and B-rings matching that for ouabain found in the 3A3Y crystal structure. The Na,K-ATPase residues Glu-122, Glu-319, and Arg-887 that are within hydrogen bond distance from hydroxyls of α-, β-, and γ-sugar residues are indicated by dotted lines. In the structures, the β and FXYD subunits are omitted for clarity. The structures were drawn with PyMOL.
Generally, the presence of a sugar moiety in CTS increases the inhibitory potency, but the effect varies considerably in relation to the number of –OH substitutions on the steroid core, being highest for the ouabagenin/ouabain pair, where the ratio of Ki values is ∼25 (Fig. 2). The effect of the sugar moiety in stabilizing the CTS binding is in accordance with the finding that variations in Ki depend primarily on variations in the dissociation rate constant (5, 13). This effect has been ascribed mainly to the 3′-α-hydroxyls of the sugars, which have been postulated to interact with both proton-accepting and proton-donating residues on the enzyme (5). As seen from the structures in Fig. 12, possible candidate residues for such interactions could be Glu-319 and Arg-887 (shark enzyme numbering). Thus, coordination of the sugar moiety by Na,K-ATPase residues compensates for the sterically unfavorable steroid hydroxyls. The very large difference in Ki ratio for ouabagenin/ouabain compared with the other cardiac aglycone/glycoside pairs could in principle also be caused by the presence of only a single sugar residue (l-rhamnose) in ouabain, whereas the other cardiac glycosides contain three sugar residues (d-digitoxose). However, such a hypothesis is clearly not in accord with the low Ki value found for evomonoside with a single l-rhamnose residue. In addition, the results shown in Fig. 3A, where the inhibitory potency is measured for digoxigenin derivatives with 0–4 digitoxose residues, contradict such an explanation because the ratio of Ki values for digoxigenin/digoxigenin monodigitoxide is only ∼1.5. Also, the nature of the sugar residues seems less important, indicating a large degree in conformational adaptability at the sugar-binding site of the protein (34).
Our previous results demonstrated that the reactivation of the CTS-bound enzyme in E2BeFx state by high NaCl concentration was almost abolished by the presence of a rhamnose residue on ouabain (8), and we suggested that, in contrast to the cardiac glycosides, the dissociation reaction of the cardiac aglycones is fast enough to allow Na+ ions to access the ion-binding sites open to the extracellular side. These observations have been substantiated and considerably extended in the present investigation. In general, it is found that glycosylation of CTS almost completely abolishes reactivation of CTS-bound enzyme either in the E2MgPi or in the E2BeFx state (Figs. 5 and 6). The sugar moiety is, therefore, important for closing and locking the ouabain binding cavity and the extracellular access channel through which Na+ enters to the binding sites and causes CTS release (8). Therefore, the CTS off-rate is the pivotal parameter here. This is in accordance with the demonstration that the dissociation rate constants of ouabagenin and digoxigenin are 75 and 38 times larger than for ouabain and digoxigenin monodigitoxide (35). A single sugar residue is enough to induce this closing and locking of the binding cavity in the transition to the high affinity CTS-bound state (Fig. 7), although additional sugar residues further decrease the rates of reactivation (Fig. 8). Among the tested cardiac aglycones, reactivation of gitoxigenin-bound enzyme was the fastest, and bufalin-bound enzyme was the slowest (Fig. 5). The unfavorable –OH group at C16 of gitoxigenin will probably accelerate its dissociation, which gives a faster reactivation, whereas the six-membered lactone of bufalin results in a low off-rate and a slower reactivation.
It is very likely that residues on the L1/2, L3/4, and L7/8 loops around the entrance to the CTS binding cavity make additional interactions with the β- and γ-sugars in digitoxin, gitoxin, and digoxin and thereby further slow down reactivation (Fig. 10). Moreover, the β- and γ-sugars in digitoxin and digoxin are important for isoform selectivity of Na,K-ATPase inhibition, which seems to rely on their coordination with isoform-specific amino acid residues at the entrance to the CTS binding cavity (27). Interestingly, two of these, Gln-126 and Glu-314 of human α1, corresponding to Ser and Gly in α2 and α3, are also different in the shark enzyme, where they correspond to Ala-126 and Gly-314. Comparative molecular similarity index analysis indicates interactions of the CTS binding site with all major components of digoxin (26). If a digoxin molecule with an approximate extended full length of 27 Å is docked onto shark Na,K-ATPase where ouabain (approximate full length of 16 Å) is located in the low affinity crystal structure (9) so that their steroid core matches, several charged amino acid residues of the L1/2, L3/4, and L7/8 loops that line the ouabain binding cavity, like Glu-122, Arg-887, Arg-889, Asp-892, and Arg-893, are within 28 Å from the lactone carbonyl (Fig. 12C), and many of these residues are known from mutagenesis studies to be important for CTS binding (36–39). Moreover, the sugar residues can rotate around the glycosyl bonds and generate several sites of interaction. Thus, it is easy to imagine that if the coordination between the sugar C4′–OH and Glu-319 is absent, as in the case of ouabagenin, the hydrogen bond network between these residues and the –OH groups on the steroid β-face could be disturbed (Fig. 12B), explaining the very low affinity of ouabagenin. Price et al. (40) have previously suggested that electrostatic interaction of the L1/2 loop of such charged border amino acids with other charged residues may prevent the conformational change associated with ouabain binding. The significant increase in the negative apparent enthalpy change from −28 kJ·mol−1 to −46 kJ·mol−1 in the ITC measurements given in Fig. 4 upon the addition of three d-digitoxose sugars to digoxigenin is consistent with an increase in interactions between the ligand and the receptor site, such as formation of hydrogen bonds between the sugar hydroxyls and Na,K-ATPase residues (Fig. 12C).
OH groups on the steroid core in excess of the one at C14 are sterically unfavorable for rapid CTS binding to Na,K-ATPase (Fig. 11B), as suggested previously (16). Also, Yoda et al. (41) have previously shown that the association rate constant depends primarily on the steroid moiety and not on the sugar moiety. This is understandable from the crystal structures where the β-face of ouabain shows little interaction with protein residues in the low affinity structure, except for the hydrogen bond between Thr-804 and the C14β–OH group between the steroid C and D rings (9). However, in the transition to the high affinity state, a structural rearrangement must takes place in which M1/M2 swings in and forms a complementary surface to the CTS β-side stabilized by several hydrogen bonds to steroid hydroxyls, as shown in Fig. 12B. Thus, the two essential residues Gln-118 and Asn-129, the mutations of which confer low ouabain affinity in rodent (40, 42), come within hydrogen bond distance to hydroxyl groups at C1, C14, and C19 (Table 2), emphasizing the importance of the ouabain-specific –OH groups at C1 and C19. Asp-128, which has previously been shown to be important for ouabain binding (43), is also within hydrogen bond distance of C14β–OH. The Phe-790, which has been demonstrated by mutagenesis to be very important for ouabain binding because substitution by a Leu reduces ouabain affinity by a factor of 60 (44), seems to be flipped and clashes with the steroid ring D of ouabain, pushing it toward M1/M2 (Fig. 13A). Actually, ouabain in the high affinity complex structure at 4.6 Å resolution, which is shifted by about 2 Å toward M1/M2 from that in the low affinity complex structure at 2.8 Å resolution, is in apparent steric clash. This is because Thr-797 (pig kidney numbering), a critical residue for ouabain binding sensitivity (36, 45), comes too close to the C14β–OH in the model (only 2.2 Å distance; Table 2, PDB code 3N23). Indeed, Phe-790/Thr-804 (Phe-783/Thr-797 in pig kidney) form a bottleneck restricting a deeper access of ouabain. Therefore, we first energy-minimized the high affinity model, positioning ouabain slightly differently (Fig. 13B), and then used it for docking of gitoxin (see below).
TABLE 2.
Distance between steroid hydroxyls and nearest residues in the high affinity ouabain-bound pig kidney Na,K-ATPase model (3N23) and in the docking models for digoxin and gitoxin. Numbering refers to pig kidney enzyme with shark numbers in parenthesis
| –OH position | Residues | Distance |
|
|---|---|---|---|
| 3N23 model | Digoxin and gitoxin modelsa | ||
| Å | |||
| C1β | Gln-111 (Gln-118) | 3.7 | |
| C5β | Gln-111 (Gln-118) | 5.3 | |
| C11α | Ile-315, Asn-122, Gln-111 (Ile-322, Asn-129, Gln-118) | 4.2, 4.5, 5.4 | |
| C12β | Ile-315 (Ile-322) | 4.3 | |
| C14β | Asp-121, Asn-122, Thr-797 (Asp-128, Asn-129, Thr-804) | 2.7, 4.1, 2.2(!) | 3.9, 4.5, 2.5 |
| C16β | Phe-783, Leu-795, Thr-797 (Phe-790, Leu-802, Thr-804) | 3.4, 4.5, 4.4 | |
| C19β | Gln-111, Asn-122 (Gln-118, Asn-129) | 3.3, 4.1 | |
a Estimated from docking of digoxin and gitoxin structures onto the repositioned high affinity ouabain-bound state. For details, see Fig. 13C. The steric clash is indicated (!).
Comparison of the Ki values for the various cardiac aglycone compounds investigated indicates that the hydroxyls at C5β (strophanthidin) and at C11α (gamabufotalin) are of minor importance for CTS binding to Na,K-ATPase. In fact, neither of the hydroxyls at C5β or at C11α forms hydrogen bonds in the high affinity state (Fig. 12B). Furthermore, gamabufotalin has the same affinity as bufalin (Table 1), and its growth-inhibitory activity is even higher than that of the unsubstituted bufalin (46). Substitutions at C12β (digoxigenin) and at C19β (strophanthidol) are more important in decreasing the inhibitory potency, especially at high pH (Table 1 and Fig. 9). The closest Na,K-ATPase residue in the shark to the C12β hydroxyl is Ile-322, which is 3.9 Å away (Fig. 12C) (4.3 Å in pig kidney; Fig. 13C).
The effects of increasing pH on CTS inhibition of Na,K-ATPase activity and rate of inhibition are very complex and include effects on the levels of the lactone ring, the steroid hydroxyls, and the sugar moiety, making it extremely difficult to pinpoint the primary site of action. The inhibitory potency of CTS generally decreases at increasing pH. Comparison of the Ki ratios for the aglycones and glycosides at pH 7.5 and 8.5 (Fig. 9B) shows that the increase of the Ki ratio caused by changing pH 7.5 to 8.5 is about 14 for ouabain and ouabagenin, about 8 for digoxin and digoxigenin, and only about 2 for digitoxin, digitoxigenin, bufalin, and evomonoside. Although the relative pH effect is identical for the aglycone and the glycoside (with a notable exception for gitoxigenin, which has a large pH-dependent increase in the Ki value of about 15, whereas the glycoside gitoxin has a much lower pH-dependent shift in Ki by a factor of only ∼3) the absolute value of Ki is heavily dependent on the presence of a sugar moiety, as discussed above. The large difference between the relative pH sensitivity of gitoxigenin and digoxigenin is surprising, given their close structural similarity (47), but may result from change in the orientation of the 17β-lactone ring caused by the C16β–OH substitution (33). In the gitoxin-docked model of Na,K-ATPase, the same two residues (Phe-783/Thr-797) that formed a bottleneck in ouabain binding also influence the gitoxin binding. For a CTS to bind to Na,K-ATPase with high affinity, it has to fit in the narrow space delimited by Phe-783 and Thr-797 and form hydrogen bonds with Val-322 and Ala-323 in M4. This in turn requires that the CTS changes the conformation of the steroid core and the orientation of the lactone. These structural changes are observed in the high affinity model of the ouabain·Na,K-ATPase complex and to a slightly lesser extent in the energy-minimized model of the digoxin·Na,K-ATPase complex (Fig. 13C). In contrast, these changes are not observed in the model of the gitoxin·Na,K-ATPase, suggesting that the hydroxyl at C16β prevents such conformational changes in gitoxin. This observation will explain the lower inhibitory potency of gitoxin compared with that of digoxin and also the much lower inhibitory potency of gitoxigenin. This idea is supported by previous findings that the C16β–OH substitution decreases the inhibitory potency of digitoxigenin and bufadienolides (27, 33, 45, 48), which is also found in the present investigation (Table 1). Previous studies using different C16 substitutions indicated that they have important structural implications, including the important change in the 17β-lactone carbonyl oxygen position (49–53).
Except for the gitoxigenin/gitoxin pair, the relative pH sensitivity of Ki is not very dependent on the presence of a sugar moiety but seems to rely on the presence of hydroxyls at various positions on the steroid core, as previously hypothesized (16). Thus, digitoxin, digitoxigenin, bufalin, and evomonoside, which have the lowest pH dependence, also have only the –OH group universally present at C14, whereas the other CTS compounds have one or more additional –OH groups present on the steroid core (cf. Fig. 1). If the relative sensitivity of cardiac aglycones to high pH is ranked according to the positions of the steroid hydroxyl groups (Fig. 9A and Table 1), the following order is observed: C1, C5, C11, C19 (ouabagenin) > C16 (gitoxigenin) > C12 (digoxigenin) ≥ C5, C19 (strophanthidol) > C5 (strophanthidin) > C11 (gamabufotalin) > none (bufalin, digitoxigenin). Thus, the most pH-sensitive –OH position seems to be at C1β, or the high pH sensitivity is a combined effect of several hydroxyls at the steroid core. Apparently, ouabain and ouabagenin are the only CTSs with a C1β–OH substitution.
The effect of high pH on the CTS inhibitory potency could be indirect through changes in the protonation state either of Na,K-ATPase residues important for hydrogen bonding of steroid hydroxyls, like the C1β-, C14β-, and C19β-hydroxyls of ouabain/ouabagenin (Fig. 12, A and B), or of carboxyls in the cation binding site. Several Asp and Glu residues near the cation binding sites of shark Na,K-ATPase (e.g. Glu-334, Glu-786, Asp-815, and Asp-933) have unusually high pKa values, indicating that they could be protonated (54). The observation that the decreasing inhibitory potency induced by increasing pH is further decreased by increasing the Mg2+ concentration during CTS incubation for ouabain, ouabagenin, and dihydro-ouabain (Fig. 10) and that this pH effect is also observed by including small concentrations of Na+ or K+ seems to indicate that the cation binding sites are involved. Mg2+ binding to or near the cation binding sites has previously been suggested (55) and could change the lactone-protein interactions, as earlier described for the binding of K+ ions in the low affinity ouabain-bound Na,K-ATPase structure (9). This would lead to repositioning of CTS in the binding cavity, which is most challenging for CTS with multiple steroid hydroxyls. It has previously been suggested that in CTS binding to Na,K-ATPase, the lactone ring, apart from being hydrogen-bonded, is also attached via electrostatic interactions (56). The effects of Mg2+ could therefore be due to an electrostatic screening effect. However, Mg2+ also increased Ki for dihydro-ouabain (Fig. 10A), although ionic interactions are not possible for dihydro-ouabain with a C20-C22-saturated lactone.
In conclusion, the rate of reactivation of CTS-bound Na,K-ATPase, which is proportional to the rate of CTS dissociation, is strongly dependent on the presence of sugar, whereas steroid core hydroxyls seem less important. The rate of inhibition, which is proportional to the rate of CTS binding, is strongly dependent on the presence of –OH groups on the steroid core. Ki is therefore a complex function of both the presence of sugars and steroid –OH groups. Increasing pH decreased inhibitory potency, depending both on the number of sugar residues and on the number of –OH groups on the β-side of the steroid core. This effect is enhanced by increasing the Mg2+ concentrations or by adding small concentrations of Na+ during CTS binding, indicating that they affect the steroid lactone-protein interactions near the cation binding sites.
Acknowledgments
We thank Anne Mette Beck Sørensen and Bianca Franchi for excellent technical assistance and Ayami Hirata for performing the ITC experiments.
This work was supported by The Danish Medical Research Foundation and by an FI/Danish-Japanese cooperation program from the Danish Agency for Science Technology and Innovation (to F. C.); by a Specially Promoted Project Grant from the Ministry of Education, Culture, Sports, Science, and Technology of Japan; and by a Strategic Japanese-Danish Cooperative Program Grant from Japan Science and Technology Agency (to C. T.).
- CTS
- cardiotonic steroid
- ITC
- isothermal titration calorimetry
- PDB
- Protein Data Bank.
REFERENCES
- 1. Schatzmann H. J. (1953) Hertzglycoside als hemmstoffe für den aktiven kalium- und natriumtransport durch die erythrocytenmembran. Helv. Physiol. Pharmacol. Acta 11, 346–354 [PubMed] [Google Scholar]
- 2. Mijatovic T., Dufrasne F., Kiss R. (2012) Cardiotonic steroids-mediated targeting of the Na+/K+-ATPase to combat chemoresistant cancers. Curr. Med. Chem. 19, 627–646 [DOI] [PubMed] [Google Scholar]
- 3. Prassas I., Diamandis E. P. (2008) Novel therapeutic applications of cardiac glycosides. Nat. Rev. Drug Discov. 7, 926–935 [DOI] [PubMed] [Google Scholar]
- 4. Wang H.-Y., O'Doherty G. A. (2012) Modulators of Na/K-ATPase. A patent review. Expert Opin. Ther. Pat. 22, 587–605 [DOI] [PubMed] [Google Scholar]
- 5. Yoda A. (1973) Structure-activity relationships of cardiotonic steroids for the inhibition of sodium- and potassium-dependent adenosine triphosphatase. I. Dissociation rate constants of various enzyme-cardiac glycoside complexes formed in the presence of magnesium and phosphate. Mol. Pharmacol. 9, 51–60 [PubMed] [Google Scholar]
- 6. Dostanic-Larson I., Van Huysse J. W., Lorenz J. N., Lingrel J. B. (2005) The highly conserved cardiac glycoside binding site of Na,K-ATPase plays a role in blood pressure regulation. Proc. Natl. Acad. Sci. U.S.A. 102, 15845–15850 [DOI] [PMC free article] [PubMed] [Google Scholar]
- 7. Yoda A., Yoda S. (1982) Interaction between ouabain and the phosphorylated intermediate of Na,K-ATPase. Mol. Pharmacol. 22, 700–705 [PubMed] [Google Scholar]
- 8. Cornelius F., Mahmmoud Y. A., Toyoshima C. (2011) Metal fluoride complexes of Na,K-ATPase. Characterization of fluoride-stabilized phosphoenzyme analogues and their interaction with cardiotonic steroids. J. Biol. Chem. 286, 29882–29892 [DOI] [PMC free article] [PubMed] [Google Scholar]
- 9. Ogawa H., Shinoda T., Cornelius F., Toyoshima C. (2009). Crystal structure of the sodium-potassium pump (Na+,K+-ATPase) with bound potassium and ouabain. Proc. Natl. Acad. Sci. U.S.A. 106, 13742–13747 [DOI] [PMC free article] [PubMed] [Google Scholar]
- 10. Toyoshima C., Norimatsu Y., Iwasawa S., Tsuda T., Ogawa H. (2007) How processing of aspartylphosphate is coupled to lumenal gating of the ion pathway in the calcium pump. Proc. Natl. Acad. Sci. U.S.A. 104, 19831–19836 [DOI] [PMC free article] [PubMed] [Google Scholar]
- 11. Olesen C., Picard M., Winther A.-M., Gyrup C., Morth J. P., Oxvig C., Møller J. V., Nissen P. (2007) The structural basis of calcium transport by the calcium pump. Nature 450, 1036–1042 [DOI] [PubMed] [Google Scholar]
- 12. Akera T., Brody T. M. (1971) Membrane adenosine triphosphatase. The effect of potassium on the formation and dissociation of the ouabain-enzyme complex. J. Pharmacol. Exp. Ther. 176, 545–557 [PubMed] [Google Scholar]
- 13. Tobin T., Brody T. M. (1972) Rates of dissociation of enzyme-ouabain complexes and K0.5 values in (Na+ + K+) adenosine triphosphatase from different species. Biochem. Pharmacol. 21, 1553–1560 [DOI] [PubMed] [Google Scholar]
- 14. Yatime L., Laursen M., Morth J. P., Esmann M., Nissen P., Fedosova N. (2011) Structural insight into the high affinity binding of cardiotonic steroids to the Na+,K+-ATPase. J. Struct. Biol. 174, 296–306 [DOI] [PubMed] [Google Scholar]
- 15. Toyoshima C., Kanai R., Cornelius F. (2011) First crystal structures of Na+,K+-ATPase. New light on the oldest ion pump. Structure 19, 1732–1738 [DOI] [PubMed] [Google Scholar]
- 16. Cornelius F., Mahmmoud Y. A. (2009) Interaction between cardiotonic steroids and Na,K-ATPase. Effects of pH and ouabain-induced changes in enzyme conformation. Biochemistry 48, 10056–10065 [DOI] [PubMed] [Google Scholar]
- 17. Skou J. C., Esmann M. (1988) Preparation of membrane Na+,K+-ATPase from rectal glands of Squalus acanthias. Methods Enzymol. 156, 43–46 [DOI] [PubMed] [Google Scholar]
- 18. Mahmmoud Y. A., Vorum H., Cornelius F. (2000) Identification of a phospholemman-like protein from shark rectal glands. Evidence for indirect regulation of Na,K-ATPase by protein kinase C via a novel member of the FXYDY family. J. Biol. Chem. 275, 35969–35977 [DOI] [PubMed] [Google Scholar]
- 19. Peterson G. L. (1983) Determination of total protein. Methods Enzymol. 91, 95–119 [DOI] [PubMed] [Google Scholar]
- 20. Lowry O. H., Rosebrough N. J., Farr A. L., Randall R. J. (1951) Protein measurement with the Folin phenol reagent. J. Biol. Chem. 193, 265–275 [PubMed] [Google Scholar]
- 21. Baginski E. S., Foa P. P., Zak B. (1967) Determination of phosphate. Study of labile organic phosphate interference. Clin. Chim. Acta 14, 155–158 [Google Scholar]
- 22. Fiske C. H., SubbaRow Y. (1925) The colorimetric determination of phosphorus. J. Biol. Chem. 66, 375–400 [Google Scholar]
- 23. Grell E., Lewitzki E., Schacht A., Stolz M. (2004) Nucleotide/protein interaction. Energetic and structural features of Na,K-ATPase. J. Therm. Anal. Calorim. 77, 471–481 [Google Scholar]
- 24. Brünger A. T., Adams P. D., Clore G. M., DeLano W. L., Gros P., Grosse-Kunstleve R. W., Jiang J. S., Kuszewski J., Nilges M., Pannu N. S., Read R. J., Rice L. M., Simonson T., Warren G. L. (1998) Crystallography and NMR system. A new software suite for macromolecular structure determination. Acta Crystallogr. D 54, 905–921 [DOI] [PubMed] [Google Scholar]
- 25. Kleywegt G. J. (2007) Crystallographic refinement of ligand complexes. Acta Crystallogr. D 63, 94–100 [DOI] [PMC free article] [PubMed] [Google Scholar]
- 26. Paula S., Tabet M. R., Ball W. J., Jr. (2005) Interactions between cardiac glycosides and sodium/potassium-ATPase. Three-dimensional structure-activity relationship models for ligand binding to the E2-Pi form of the enzyme versus activity inhibition. Biochemistry 44, 498–510 [DOI] [PubMed] [Google Scholar]
- 27. Katz A., Lifshitz Y., Bab-Dinitz E., Kapri-Pardes E., Goldshleger R., Tal D. M., Karlish S. J. (2010) Selectivity of digitalis glycosides for isoforms of human Na,K-ATPase. J. Biol. Chem. 285, 19582–19592 [DOI] [PMC free article] [PubMed] [Google Scholar]
- 28. Farr C. D., Burd C., Tabet M. R., Wang X., Welsh W. J., Ball W. J., Jr. (2002) Three-dimensional quantitative structure-activity relationship study of the inhibition of Na+,K+-ATPase by cardiotonic steroids using comparative molecular field analysis. Biochemistry 41, 1137–1148 [DOI] [PubMed] [Google Scholar]
- 29. Brown L., Erdmann E., Thomas R. (1983) Digitalis structure-activity relationship analyses. Conclusions from indirect binding studies with cardiac (Na+ + K+)-ATPase. Biochem. Pharmacol. 32, 2767–2774 [DOI] [PubMed] [Google Scholar]
- 30. Grell E., Schick E., Lewitzki E. (2001) Membrane receptor calorimetry. Cardiac glycoside interaction with Na,K-ATPase. Thermochim. Acta 380, 245–254 [Google Scholar]
- 31. Yoda A., Yoda S. (1978) Influence of pH on the interaction of cardiotonic steroids with sodium- and potassium-dependent adenosine triphosphatase. Mol. Pharmacol. 14, 624–632 [PubMed] [Google Scholar]
- 32. Yoda S., Sharrif A. M., Yoda A. (1975) Structure-activity relationships of cardiotonic steroids for the inhibition of sodium- and potassium-dependent adenosine triphosphatase. IV. Dissociation rate constants for complexes of the enzyme with cardiac oligodigitoxides. Mol. Pharmacol. 11, 647–652 [PubMed] [Google Scholar]
- 33. Griffin J. F., Rohrer D. C., Ahmed K., From A. H., Hashimoto T., Rathore H., Fullerton D. S. (1986) The effect of 16β-substitution on the structure and activity of digitoxigenin. Is there an additional binding interaction with Na+,K+-ATPase? Mol. Pharmacol. 29, 270–274 [PubMed] [Google Scholar]
- 34. Repke K. R. (1985) New developments in cardiac glycoside structure-activity relationships. Trends Pharmacol. Sci. 6, 275–278 [Google Scholar]
- 35. Yoda A., Yoda S. (1977) Association and dissociation rate constants of the complexes between various cardiac aglycones and sodium- and potassium-dependent adenosine triphosphatase formed in the presence of magnesium and phosphate. Mol. Pharmacol. 13, 352–361 [PubMed] [Google Scholar]
- 36. Feng J., Lingrel J. B. (1994) Analysis of amino acid residues in the H5-H6 transmembrane and extracellular domains of Na,K-ATPase α subunit identifies threonine 797 as a determinant of ouabain sensitivity. Biochemistry 33, 4218–4224 [DOI] [PubMed] [Google Scholar]
- 37. Qiu L. Y., Koenderink J. B., Swarts H. G., Willems P. H., De Pont J. J. (2003) Phe783, Thr797, and Asp804 in transmembrane hairpin M5-M6 of Na+,K+-ATPase play a key role in ouabain binding. J. Biol. Chem. 278, 47240–47244 [DOI] [PubMed] [Google Scholar]
- 38. Qiu L. Y., Swarts H. G., Tonk E. C., Willems P. H., Koenderink J. B., De Pont J. J. (2006) Conversion of the low-affinity ouabain-binding site of non-gastric H,K-ATPase into a high-affinity binding site by substitution of only five amino acids. J. Biol. Chem. 281, 13533–13539 [DOI] [PubMed] [Google Scholar]
- 39. Radkov R., Kharoubi-Hess S., Schaer D., Modyanov N. N., Geering K., Horisberger J. D. (2007) Role of homologous ASP334 and GLU319 in human non-gastric H,K- and Na,K-ATPases in cardiac glycoside binding. Biochem. Biophys. Res. Commun. 356, 142–146 [DOI] [PMC free article] [PubMed] [Google Scholar]
- 40. Price E. M., Rice D. A., Lingrel J. B. (1990) Structure-function studies of Na,K-ATPase. Site-directed mutagenesis of the border residues from the H1-H2 extracellular domain of the α subunit. J. Biol. Chem. 265, 6638–6641 [PubMed] [Google Scholar]
- 41. Yoda A., Yoda S., Sarrif A. M. (1973) Structure-activity relationships of cardiotonic steroids for the inhibition of sodium- and potassium-dependent adenosine triphosphate. II. Association rate constants of various enzyme-cardiac glycoside complexes. Mol. Pharmacol. 9, 766–773 [PubMed] [Google Scholar]
- 42. Lingrel J. B., Argüello J. M., Van Huysse J., Kuntzweiler T. A. (1997) Cation and cardiac glycoside binding sites of the Na,K-ATPase. Ann. N.Y. Acad. Sci. 834, 194–206 [DOI] [PubMed] [Google Scholar]
- 43. Lingrel J. B, Orlowski J., Rice D. A., Pathak B. G. (1991) Regulation of the α-subunit genes of the Na,K-ATPase and determinants of cardiac glycoside sensitivity. Soc. Gen. Physiol. Ser. 46, 1–16 [PubMed] [Google Scholar]
- 44. Rodacher V, Toustrup-Jensen M., Vilsen B. (2006) Mutations Phe785Leu and Thr618Met in Na+,K+-ATPase, associated with familial rapid-onset dystonia parkinsonism, interfere with Na+ interaction by distinct mechanisms. J. Biol. Chem. 281, 18539–18548 [DOI] [PubMed] [Google Scholar]
- 45. Qiu L. Y., Krieger E., Schaftenaar G., Swarts H. G., Willems P. H., De Pont J. J., Koenderink J. B. (2005) Reconstruction of the complete ouabain-binding pocket of Na,K-ATPase in gastric H,K-ATPase by substitution of only seven amino acids. J. Biol. Chem. 280, 32349–32355 [DOI] [PubMed] [Google Scholar]
- 46. Kamano Y., Kotake A., Hashima H., Inoue M., Morita H., Takeya K., Itokawa H., Nandachi N., Segawa T., Yukita A., Saitou K., Katsuyama M., Pettit G. R. (1998) Structure-cytotoxic activity relationship for the toad poison bufadienolides. Bioorg. Med. Chem. 6, 1103–1115 [DOI] [PubMed] [Google Scholar]
- 47. Go K., Kartha G. (1980) Structure of gitoxin. Acta Crystallogr. B 36, 3034–3040 [Google Scholar]
- 48. De Pover A., Godfraind T. (1982) Influence of 16β-formylation on Na,K-ATPase inhibition by cardiac glycosides. Naunyn-Schmiedebergs Arch. Pharmacol. 321, 135–139 [DOI] [PubMed] [Google Scholar]
- 49. Woodcock B. G., Rietbrock N. (1985) The forgotten cardiac glycoside of Digitalis purpurea. Trends Pharmacol. Sci. 6, 273–275 [Google Scholar]
- 50. Hashimoto T., Rathore H., Satoh D., Hong G., Griffin J. F., From A. H., Ahmed K., Fullerton D. S. (1986) Cardiac glycosides. 6. Gitoxigenin C16 Acetates, Formates, Methoxycarbonates, and Digitoxosides. Synthesis and Na+,K+-ATPase inhibitory activity. J. Med. Chem. 29, 997–1003 [DOI] [PubMed] [Google Scholar]
- 51. Fullerton D. S., Yoshioka K., Rohrer D. C., From A. H., Ahmed K. (1979) Digitalis genin activity. Side-group carbonyl oxygen position is a major determinant. Science 205, 917–919 [DOI] [PubMed] [Google Scholar]
- 52. Ahmed K., Rohrer D. C., Fullerton D. S., Deffo T., Kitatsuji E., From A. H. (1983) Interaction of (Na+,K+)-ATPase and digitalis genins. A general model for inhibitory activity. J. Biol. Chem. 258, 8092–8097 [PubMed] [Google Scholar]
- 53. Fullerton D. S., Kitatsuji E., Deffo T., Roher D. C., Ahmed K., From A. H. L. (1983) Use of prophet and MMS-X computer graphics in the study of the cardiac steroid receptor site of Na,K-ATPase. Curr. Top. Membr. Transp. 19, 257–264 [Google Scholar]
- 54. Poulsen H., Khandelia H., Morth J. P., Bublitz M., Mouritsen O. G., Egebjerg J., Nissen P. (2010) Neurological disease mutations comprise a C-terminal ion pathway in the Na+/K+-ATPase. Nature 467, 99–102 [DOI] [PubMed] [Google Scholar]
- 55. Schneeberger A., Apell H.-J. (2001) Ion selectivity of the cytoplasmic binding sites of the Na,K-ATPase. II. Competition of various cations. J. Membr. Biol. 179, 263–273 [DOI] [PubMed] [Google Scholar]
- 56. Thomas R., Boutagy J., Gelbart A. (1974) Cardenolide analogs. V. Cardiotonic activity of semisynthetic analogs of digitoxigenin. J. Pharmacol. Exp. Ther. 191, 219–231 [PubMed] [Google Scholar]