

Abstract
Under a variety of stress conditions, Photosystem II produces reactive oxygen species on both the reducing and oxidizing sides of the photosystem. A number of different sites including the Mn4O5Ca cluster, P680, PheoD1, QA, QB and cytochrome b559 have been hypothesized to produce reactive oxygen species in the photosystem. In this communication using Fourier-transform ion cyclotron resonance mass spectrometry we have identified several residues on the D1 and D2 proteins from spinach which are oxidatively modified and in close proximity to QA (D1 residues 239F, 241Q, 242E and the D2 residues 238P, 239T, 242E and 247M) and PheoD1 (D1 residues 130E, 133L and 135F). These residues may be associated with reactive oxygen species exit pathways located on the reducing side of the photosystem, and their modification may indicate that both QA and PheoD1 are sources of reactive oxygen species on the reducing side of Photosystem II.
Introduction
In higher plants and cyanobacteria the Photosystem II (PS II) complex contains more than twenty polypeptide subunits. At the core of the photosystem, six intrinsic membrane proteins are unequivicolly required for oxygen evolution: the D1 and D2 proteins, the CP43 and CP47 proteins and the α- and β- subunits of cytochrome b559. The genetic deletion of these components results in loss of the assembly of the photosystem in vivo, while their biochemical removal from isolated PS II complexes results in the loss of PS II function in vitro [1], [2]. Over the past twelve years, crystal structures of cyanobacterial PS II have enhanced our understanding of the molecular organization of the polypeptides of the photosystem and the active sites for oxygen evolution (the Mn4O5Ca cluster) and for quinone reduction [3], [4], [5], [6], [7]. Recently, a high resolution 1.9 Å crystal structure of cyanobacterial PS II has been presented [8]. Crystal structures for higher plant PS II, however, are not available. There are significant differences between the extrinsic protein complement of the higher plant and the cyanobacterial photosystems [9]. While both contain the PsbO protein [10], the PsbU and PsbV proteins are present in cyanobacteria while the PsbP and PsbQ proteins are present in higher plants. Cyanobacterial versions of these latter two proteins (CyanoP and CyanoQ) are present, but their functional roles in cyanobacterial PS II is unclear [9]. PsbP and PsbQ in higher plants and PsbU and PsbV in the cyanobacteria appear to facilitate the accumulation of essential inorganic cofactors for oxygen evolution (Ca+2 and Cl−) [9], [11] and may also perform other functions within the photosystem [12], [13]. With respect to the major intrinsic components, however, the cyanobacterial and higher plant systems are quite similar. The amino acid sequences of the intrinsic components (D1, D2, CP43 and CP47) are nearly identical in both groups (>85% similarity, [14]). Consequently, one would expect that these core structural elements of PS II would be highly homologous between higher plants and cyanobacteria.
PS II is the major site of photoinhibition in all oxygenic organisms and appears particularly susceptible to damage by reactive oxygen species (ROS). The production of molecular oxygen by PS II is accompanied by the unavoidable possibility of oxidative modification of amino acid residues within the PS II complex in the vicinity of the Mn4O5Ca cluster, the oxygen-evolving site of the photosystem [15], [16]. Singlet oxygen (1O2) produced at P680, the primary electron donor of the photosystem, has also been proposed as a source of ROS produced by the photosystem [17], [18], [19]. Recently, we identified a number of oxidized CP43 residues (354E, 355T, 356M and 357R) which are located in close proximity to the manganese cluster and which may be associated with an oxygen/ROS egress channel on the oxidizing side of the photosystem [20]. Barry and coworkers have also identified oxidatively modified tryptophan residues on both the CP43 (365W) and D1 (317W) proteins which appear to be targets for oxidizing side ROS [21], [22], [23]. Additionally, reductants produced by PS II, such as QB −2 [24], PheoD1 − [25], QA − [26], and, possibly, reduced low potential cytochrome b559 [27], [28], appear to have redox potentials and lifetimes sufficient to reduce molecular oxygen and have been hypothesized to be sources of ROS. Sharma et al. [29] had previously identified a D1 peptide (130E–136R) which lies in the vicinity of PheoD1 and which contained a single oxidative modification on an unidentified residue.
One would predict that amino acid residues in the vicinity of the sites of ROS production should be particularly susceptible to ROS modification. The identification of such oxidatively modified residues in the photosystem should serve to identify both the putative site(s) of ROS generation and possibly the putative path(s) for ROS exit from PS II. In this communication we report the presence of natively oxidized amino acids in the vicinity of both QA and PheoD1 in PS II membranes isolated from field-grown spinach. These modifications are apparently normally present in the PS II isolated from field-grown material and our findings suggest that QA and PheoD1 may be sources of ROS under native growth conditions.
Results
Fig. 1 illustrates the quality of the mass spectrometry data used for the identification of oxidized amino acid residues in the D1 and D2 proteins. In this figure the MS/MS data collected for the D2 peptide 235A–252R are illustrated. In Fig. 1A, the data from the unmodified peptide are illustrated, while in Fig. 1B, data from the peptide bearing oxidized 247M are shown. In this example and others (Figs. S1–S2), both modified and unmodified versions of the target peptide were identified; in another example only the modified peptide was detected (Fig. S3). Using a p value ≤0.00001 assured extremely high quality peptide identifications with nearly complete y- and b-ion series being observed.
Figure 1. Example Mass Spectrometry Data from the Unmodified Peptide.

235AFNPTQAEETYSMVTAN252R and the Oxidatively Modified Peptide 235AFNPTQAEETYS247M+16 VTAN252R of the D2 Protein A. Top, spectrum of the collision-induced dissociation (CID) of the unmodified peptide 235AFNPTQAEETYSMVTAN252R. Various identified ions are labeled. Bottom, table of all predicted masses for the y- and b- ions generated from this peptide sequence. Ions identified in the CID spectrum (above) are shown in red. The b'++, b'+ y'++ and y'+ ions are generated by the neutral loss of water while the b*++, b*+ y*++ and y*+ ions are generated from the loss of ammonia. B. Top, spectrum of the CID dissociation of the modified 235AFNPTQAEETYS247M+16 VTAN252R. Various identified ions are labeled. Bottom, table of all predicted masses for the y- and b- ions generated from this peptide sequence. Ions identified in the CID spectrum are shown in red. The b'++, b'+ y'++ and y'+ ions are generated by the neutral loss of water while the b*++, b*+ y*++ and y*+ ions are generated from the loss of ammonia. For comparison the b13+–b17+ ions of the unmodified peptide are highlighted in blue and those of the modified peptide are highlighted in cyan. All b ions longer than b12+ in the modified peptide are 16 Da larger than the corresponding ions observed from the unmodified peptide. This indicates that 247M contains an oxidative modification. Additionally, the y6+–y15+ions of the unmodified peptide are highlighted in green, while those of the modified peptide are highlighted in yellow. All y ions longer than y5+ in the modified peptide are 16 Da larger than the corresponding ions observed from the unmodified peptide. This verifies that 247M contains an oxidative modification. The p values for the unmodified and modified peptide were 10−13 and 10−11, respectively.
In this communication, we have focused on the domains of the D1 and D2 proteins located at or near redox active cofactors located on the stromal face of the thylakoid membrane. A total of 10 oxidatively modified amino acid residues on the D1 and D2 proteins were observed in the vicinity of these cofactors. These are summarized in Table 1 along with the type of oxidative modifications and the residue location (surface or buried and not in contact with cavity or channel) within the T. vulcanus crystal structure. Please note that these residues were originally reported to be modified in Frankel et al. [20], however, their close association with the reducing-side cofactors was not discussed in that communication.
Table 1. Oxidatively Modified Residues in the Vicinity of PheoD1 and QA.
| Protein | Modified Spinach Residues | Corresponding Thermosynechococcus Residues |
| D1 | 130Ea + go | 130Q |
| 133La + go | 133L | |
| 135Fa + go | 135Y | |
| 239Fb + go | 239F | |
| 241Qb + ca | 241Q | |
| 242Eb + gam | 242E | |
| D2 | 238Pb + ca | 237P |
| 239Tb + go | 238T | |
| 242Eb + gam | 241E | |
| 247Mb + go | 246M |
Individual residues are listed along with the modifications observed. For a complete list of oxidative modification types, the amino acids targeted, and mass modifications searched for in this study, as well as structures arising from these oxidative modifications, see [50], [51]. Key: ca, carbonyl addition (+14 Da); gam, Glu/Asp modification (decarboxylation and oxidation, −30 Da); go, general oxidation (+16 Da). Oxidative modification of these residues was originally reported in Frankel et al. [20].
Buried residues not adjacent to apparent cavities/channels.
Surface-exposed residues.
In general, mass spectrometry coverage of intrinsic membrane proteins is quite challenging. The overall sequence coverage observed in this study for the proteins examined was 24% for D1 and 27% for D2, values which are quite comparable to that observed for these proteins by other investigators (see, for instance Nakamura et al. [30]). However, the coverage of the residues located in the stromally exposed domains of these proteins was significantly higher, 67% for D1 and 48% for D2. These are the domains of principal interest in this study, as ROS produced on the reducing side of the photosystem must transit these regions to exit the photosystem. Within this context it should be noted that most oxidative modifications to amino acid residues lying in the transmembrane helixes of these proteins would be difficult to identify and many would escape detection due to their high hydophobicity and consequent expected poor resolution during reversed-phase chromatography.
The D1 and D2 proteins are highly homologous between higher plants and cyanobacteria (>95% similarity). Consequently, we can directly map the modified residues observed to be modified in spinach onto the homologous residues in the T. vulcanus crystal structure. These results are shown in Fig. 2. The close proximity of oxidatively modified residues to QA and PheoD1 is evident in this illustration. Additionally, it is apparent that these residues appear to form two rather distinct groups. The first group appears associated with QA, consists of both D1 and D2 residues, and leads in a nearly continuous manner from the cofactor to the surface of the complex. The second group is associated with PheoD1, consists solely of D1 residues, also forming a near continuous grouping of modified residues. This group of residues, however, does not reach the surface of the PS II complex.
Figure 2. Oxidized Residues Identified on the Stromally Exposed Regions of the D1 and D2 Proteins in the Vicinity of QA and PheoD1.
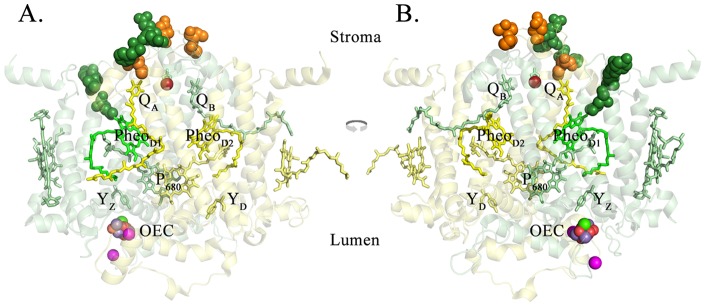
The T. vulcanus residues corresponding to the oxidatively modified spinach residues (Table 1) are highlighted. These oxidized residues are shown as spheres superimposed on monomer I of the T. vulcanus structure. For clarity, only the D1 and D2 proteins and their associated cofactors are shown. A. the view from outside Monomer I, looking towards the dimeric complex from within the plane of the membrane. B. the view from Monomer II looking towards its interface with Monomer I within the plane of the membrane. The D1 protein is shown in pale green and the D2 protein is shown in pale yellow. The oxidatively modified residues of D1 are shown in dark green while those of D2 are shown in orange. Various cofactors of both D1 and D2 are labeled and colored pale green or yellow, respectively. PheoD1 is shown in bright green. The non-heme iron is shown in bright red. The Mn4O5Ca cluster and its associated chloride ions are labeled as the OEC. Figs. 2–4 were produced using PYMOL [53].
Discussion
It must be stressed that this is an observational study of the oxidative modifications naturally occurring in PS II isolated from field grown-spinach. We cannot comment on the field conditions which lead to these oxidative modifications (high light intensity, high temperatures, nutrient limitations, presence of heavy metals, etc.) nor on the chemical identification of the ROS responsible. Studies addressing some of these questions will be the topic of additional communications.
The oxidative modification of these D1 and D2 residues indicates that they have been modified by ROS. The proximity of these residues to QA (D1 residues: 239F, 241Q, 242E and the D2 residues: 238P, 239T, 242E, and 247M) and PheoD1 (D1 residues:130E, 133L and 135F) supports the hypothesis that these two cofactors are sites of ROS production on the reducing side of PS II.
With respect to the residues in the vicinity of QA in Thermosynechococcus, it should be noted that there is a one amino acid deletion at residue 10 in the D2 sequence with respect to the spinach sequence (Table 1). Consequently, in Thermosynechococcus: QA – 2.9Å – D2:246M – D1:239F – D1:241Q – D1:242E – D2:241E. These residues appear to form a near contiguous chain of oxidized residues leading from QA (Fig. 3). Two additional oxidized residues D2:237P and 238T may also be part of this oxidized residue complex but these are more distantly located. The mass spectra identifying these modified residues are shown in Figs. 1, S1 and S2. All of these residues are at least partially surface-exposed. D2:246M, however, exhibits very limited contact with the bulk solvent. It should be noted that the oxidized D2 residues 237P and 238T are also in relatively close proximity to QB (9 Å and 13 Å, respectively, Fig. 3). While no additional oxidized residues in the immediate vicinity of QB were observed leading to the surface-located residues D2:237P and 238T, it is formally possible that oxidized residues are present in the region near QB, but that they escaped detection in our experiments.
Figure 3. Detail of the Oxidized Residues in the Vicinity of QA.
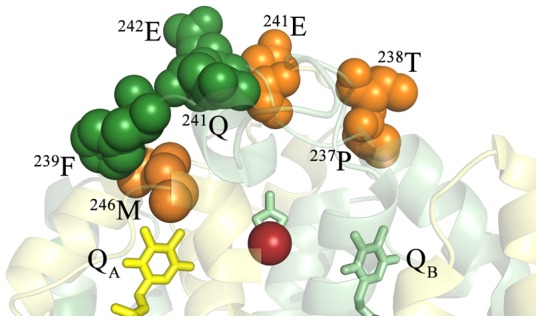
A close-up of the QA – Non-Heme Iron – QB region is shown. The T. vulcanus residues corresponding to the oxidatively modified spinach residues (Table 1) are highlighted and labeled. The D1 protein is shown in pale green and the D2 protein is shown in pale yellow. The oxidatively modified residues of D1 are shown in dark green while those of D2 are shown in orange, with the individual modified residues being labeled. QA is shown in yellow, QB in green and the non-heme iron is shown in bright red.
With respect to the residues in close proximity to PheoD1, D1:130E in spinach and Chlamydomnas is replaced by D1:130Q in the T. vucanus structure. It should be noted that in T. vulcanus, D1:130Q is present in the constitutively expressed D1–1 isoform while the D1–2 and D1–3 isoforms, which are expressed only under certain environmental conditions, contain D1:130E [31], [32]. These residues have been reported to be hydrogen- bonded to PheoD1 [33], [34]. Additionally, in Thermosynechococcus, D1:135Y is replaced by D1:135F (Table 1). Consequently, in the Thermosynechococcus structure: PheoD1 – 2.9Å – D1:130Q – D1:133L –D1:135F (Fig. 4). The mass spectrum identifying this group of modified residues is shown in Fig. S3. These oxidized residues may be adjacent to a putative ROS exit pathway leading from PheoD1 to residues near or at the surface of the complex. It should be noted that in the static crystal structure, none of these residues are surface-exposed nor are they in contact with any apparent cavities or channels. Other residues which were not detected in our studies may be associated with the putative pathway, completing a pathway to the surface of the complex.
Figure 4. Detail of the Oxidized Residues in the Vicinity of PheoD1.
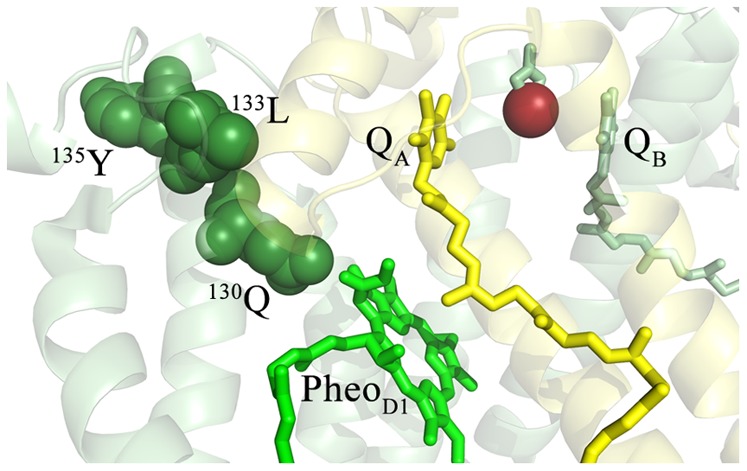
The T. vulcanus residues corresponding to the oxidatively modified spinach residues (Table 1) are highlighted and labeled. The D1 protein is shown in pale green and the D2 protein is shown in pale yellow. The oxidatively modified residues of D1 are shown in dark green, with the individual modified residues being labeled. PheoD1 is shown in bright green, QA is shown in yellow, QB in green and the non-heme iron is shown in bright red. For clarity, modified residues in the vicinity of QA (and detailed in Fig. 3) are not shown.
It is unclear at this time how molecular oxygen penetrates into the protein structure to reach the vicinity of PheoD1. While no channels or cavities are present in the static protein structure in the vicinity of PheoD1, it is possible that these form transiently either due to thermal motion of the PS II complex on a nsec timescale or as a result of conformational changes occurring during the S-state transitions. It is also possible that oxygen can diffuse directly into the protein matrix as has been demonstrated in other systems [35]. In any event, our observation that the D1 residues 130E, 133L and 135F are oxidatively modified strongly suggests that molecular oxygen can penetrate the PS II structure and become partially reduced to an ROS by PheoD1.
Earlier studies identified domains containing oxidatively modified D1 and D2 residues. Sharma et al. [36] determined that the D1 peptide 130E–136R contained an oxidative modification, however the actual residue(s) modified and its spatial relationship with PheoD1 were not determined. Our observation that oxidative modification occurs on the D1 residues 130E, 133L and 135F fully confirms this observation of Sharma et al. [36]. These authors also identified a number of other peptides containing putative oxidative modifications on both the D1 and D2 proteins. However, none of the other residues that we observe to be oxidatively modified on the stromal domain lie in these additional peptides.
PS II, particularly when under stress, apparently can produce a variety of ROS at a variety of sites [16]. Several studies have identified the production of ROS, particularly the short-lived OH•, by the donor side of PS II [37], [38]. 1O2 produced by the reaction of molecular oxygen with 3P680 has also been observed [17], [18], [19]. Interestingly, no oxidative modifications in the vicinity of P680 have been observed [20]. Since the production of 1O2 by PS II is well established [39], the lack of observed modifications in the vicinity of P680 could be a detection issue, as the peptides in the vicinity of P680 are highly hydrophobic and difficult to resolve by reversed-phase HPLC. It is also possible that 1O2 may be vectored away from P680 rapidly, giving rise to a low yield of oxidative modifications. Finally, oxidative modification of residues in the vicinity of P680 may trigger D1 turnover more effectively than oxidative modifications at other sites in vivo. We cannot distinguish between these and other possibilities at this time.
ROS may also be produced on the reducing side of the photosystem by the partial reduction of molecular oxygen, yielding long-lived O2 •− and H2O2 and the very short-lived OH•. It should be stressed, however, that at this time we cannot discriminate between these or other mechanisms that produce the ROS responsible for the oxidative modifications that we observe. Using mass spectrometry, it is also very difficult, and in most cases impossible, to differentiate oxidative modifications of amino acid side chains produced by OH•, 1O2, O2 •− or other oxidative species [40], [41].
The site of ROS production by PS II has been the subject of much discussion [16]. Earlier, we reported that CP43: 354E, 355T, 356M and 357R, which are in close proximity to the Mn4O5Ca cluster, were oxidatively modified [20]. These results indicate that the manganese cluster itself appears to be a source of oxidizing-side ROS. On the reducing side of the photosystem, PheoD1, QA, QB −2 and low potential cytochrome b559 have all been suggested as sites of ROS production. In this communication we have reported the oxidative modification of residues in close proximity to PheoD1 and QA. These results support the hypothesis that both of these sites can produce ROS that lead to amino acid residue oxidative modification. Since these modifications were observed on PS II membranes isolated from market spinach, it appears that they can accumulate to detectable levels within the D1 protein lifetime (t1/2≈2 hr [42]). Interestingly, no oxidative modifications in the vicinity of the Mn4O5Ca cluster were observed on the D1 protein on this same plant material. Again, it is possible that D1 modifications in the vicinity of the metal cluster (or, perhaps, P680) may trigger D1 turnover and, consequently, limit the detection and/or accumulation of such putative oxidative modifications.
While no modified residues were observed in the immediate vicinity of QB, we cannot rule out, at this time, the possibility that this site could also contribute to reducing-side ROS production. Additionally, since we did not collect mass spectrometry data on the cytochrome b559 α and β subunits or on the other low molecular mass subunits in the vicinity of this cytochrome, we cannot comment on their ability to produce ROS. We also cannot speculate on the relative rate of ROS production by PheoD1 or QA (or other putative ROS-producing sites). We have no quantitative data as to the proportion of modified amino acid residues present at any of the observed positions. Indeed, such quantification would be difficult to obtain given the different hydophobicity of the unmodified vs. modified peptides and their consequent differential resolution by reversed-phase chromatography. Elucidation of the time-course for modification of these oxidized residues using 18O2, however, may provide valuable evidence bearing on the relative importance of ROS production by PheoD1 and QA. These experiments are currently underway.
Materials and Methods
PS II membranes were isolated from market spinach [43], [44]. The PS II membranes were suspended at 2 mg chlorophyll/ml in 50 mM Mes-NaOH, pH 6.0, 300 mM sucrose, 15 mM NaCl buffer and frozen at −80°C until use. The proteins in the samples were separated on a 12.5–20% polyacrylamide gradient by lithium dodecyl sulfate-polyacrylamide gel electrophoresis [45] with the modifications outlined by Rabilloud et al. [46] and Sun et al. [47]. Electrophoresis was performed for 16 hrs at 1 W at 4°C. Upon completion of electrophoresis, the gels were stained with Coomassie Blue, destained, and protein bands containing D1 and D2 proteins were excised. These proteins (along with a number of other protein components of PS II) were then processed en masse for trypsin digestion using standard methods. In some cases, the tryptic peptides were processed using a C18 ZipTip® prior to mass analysis.
Chromatography was performed as previously described [20]. Briefly, the tryptic peptides were resolved on a Waters reversed phase, X-Bridge C18 column. The mobile phases consisted of a 95:5 water:acetonitrile with 0.1% formic acid aqueous phase and a 95:5 acetonitrile:water with 0.1% formic acid organic phase, and the peptides were eluted with the gradient described previously [20]. Mass spectrometry was performed on a Thermo Scientific LTQ-FT™, a hybrid instrument consisting of a linear ion trap and a Fourier transform ion cyclotron resonance mass spectrometer. Instrumental conditions and data collection were described in Frankel et. al. [20].
We performed two biological replicates. The MassMatrix Program ver. 1.3.1 [48], [49] was used in the identification and analysis of the resultant peptides. The program was modified to search for the oxidative modifications which have been reported in the literature [50], [51]. A FASTA library containing the spinach PS II protein sequences was searched, as was a decoy library. The decoy library contained these same PS II components but with their amino acid sequences reversed. No hits to the decoy library were observed. Such decoy libraries are used to evaluate the frequency of false positives expected when searching the real FASTA database [52]. For the determination of the quality of the peptide calls within MassMatrix, max(pp1, pp2) was ≥8.5 and ppTag ≥5.0 [48], [49]. These parameters yield a p value of ≤0.00001; only oxidized peptides which exhibited this extremely low p value were considered. Since the data was of very high quality, the union of the replicate data sets was examined [20]. Since the D1 and D2 proteins present in spinach and T. vulcanus are highly homologous, the PYMOL software suite [53] was used to map the oxidatively modified residues observed in spinach onto the T. vulcanus PS II structure [8] of the D1 and D2 proteins.
It should be noted that protein electrophoresis is the principal source of protein oxidation artifacts in many biochemical studies. The ammonium persulfate catalyst (and the TEMED activator) typically used in this method for the polymerization of the acrylamide-bis acrylamide monomers generates sulfate radicals. This radical can react with water to produce both O2 •− and OH• [54], both of which can oxidatively modify proteins. To alleviate this problem the polyacrylamide gels used in this study were thoroughly degassed and photopolymerized with flavin mononucleotide, diphenyliodonium chloride and sodium toluenesulfinic acid [46]. Additionally, the cathode buffer contained thioglycolate [47]. This electrophoretic system had been shown to completly eliminate artifactual electrophoresis-associated oxidative modifications of cytochrome c [47] and greatly minimize apparent electrophoresis-induced oxidative modifications in PS II (see [20] Fig. S1). Subsequent to electrophoresis, the protein and peptide samples were maintained under reducing conditions (presence of dithiothreitol and/or low pH) to minimize artifactual oxidative modifications. Staining was performed in the presence of acetic acid, the excised protein bands were reduced with dithiothreitol (and then blocked with iodoacetic acid), and after tryptic digestion the peptides were brought to 0.1% formic acid and frozen at −80°C. Reversed phase HPLC was performed in the presence of 0.1% formic acid. The sheath and auxiliary gas for electrospray ionization was N2 [20].
Supporting Information
Mass Spectrometry Data from the Unmodified Peptide. 235AFNPTQAEETYSMVTAN252R and the Oxidatively Modified Peptide 235AFN238P+16 239T+16 QA242E-30 ETYSM+16 VTAN252R of the D2 Protein A. Top, spectrum of the CID dissociation of the unmodified peptide 235AFNPTQAEETYSMVTAN252R. Various identified ions are labeled. Bottom, table of all predicted masses for the y- and b- ions generated from this peptide sequence. Ions identified in the CID spectrum (above) are shown in red. The b'++, b'+ y'++ and y'+ ions are generated by the neutral loss of water while the b*++, b*+ y*++ and y*+ ions are generated from the loss of ammonia. B. Top, spectrum of the CID dissociation of the modified 235AFN238P+16 239T+16 QA242E-30 ETYSM+16 VTAN252R. Various identified ions are labeled. Bottom, table of all predicted masses for the y- and b- ions generated from this peptide sequence. Ions identified in the CID spectrum are shown in red. The b'++, b'+ y'++ and y'+ ions are generated by the neutral loss of water while the b*++, b*+ y*++ and y*+ ions are generated from the loss of ammonia. The p values for the unmodified and modified peptide were 10−13 and 10−14, respectively.
(DOCX)
Mass Spectrometry Data from the Unmodified Peptide. 239FGQEEETYNIHAAHGYFG257R and the Oxidatively Modified Peptide 239F+16 G241Q+14 242E-30 EETYNIHAAHGYFG257R of the D1 Protein A. Top, spectrum of the CID dissociation of the unmodified peptide 239FGQEEETYNIHAAHGYFG257R. Various identified ions are labeled. Bottom, table of all predicted masses for the y- and b- ions generated from this peptide sequence. Ions identified in the CID spectrum (above) are shown in red. The b'++, b'+ y'++ and y'+ ions are generated by the neutral loss of water while the b*++, b*+ y*++ and y*+ ions are generated from the loss of ammonia. B. Top, spectrum of the CID dissociation of the modified G241Q+14 242E-30 EETYNIHAAHGYFG257R. Various identified ions are labeled. Bottom, table of all predicted masses for the y- and b- ions generated from this peptide sequence. Ions identified in the CID spectrum are shown in red. The b'++, b'+ y'++ and y'+ ions are generated by the neutral loss of water while the b*++, b*+ y*++ and y*+ ions are generated from the loss of ammonia. The p values for the unmodified and modified peptide were 10−8 and 10−9, respectively.
(DOCX)
Mass Spectrometry Data from the Oxidatively Modified Peptide 130E+16 WE133L+16 S135F+16 136R of the D1 Protein A. Top, spectrum of the CID dissociation of the modified peptide. Various identified ions are labeled. Bottom, table of all predicted masses for the y- and b- ions generated from this peptide sequence. Ions identified in the CID spectrum (above) are shown in red. The b'++, b'+ y'++ and y'+ ions are generated by the neutral loss of water while the b*++, b*+ y*++ and y*+ ions are generated from the loss of ammonia. The p value for this peptide is 10−6.
(DOCX)
Funding Statement
Funding was provided by the Division of Chemical Sciences, Geosciences, and Biosciences, Office of Basic Energy Sciences of the U.S. Department of Energy through Grant DE-FG02-98ER20310 to T.M.B and L.K.F., which supported the protein chemistry aspects and data analysis for this manuscript, and the National Institutes of Health Grants RR019900 and GM58843 to P.A.L., which supported the mass spectrometry experiments of this manuscript. The funders had no role in study design, data collection and analysis, decision to publish, or preparation of the manuscript.
References
- 1.Bricker TM, Burnap RL (2005) The extrinsic proteins of Photosystem II. In: Wydrzynski T, Satoh K, editors. Photosystem II: The Water/Plastoquinone Oxido-Reductase of Photosynthesis. Dordrecht: Springer. 95–120. [Google Scholar]
- 2. Nelson N, Yocum CF (2006) Structure and function of Photosystems I and II. Ann Rev Plant Biol 57: 521–565. [DOI] [PubMed] [Google Scholar]
- 3. Zouni A, Witt H-T, Kern J, Fromme P, Krauss N, et al. (2001) Crystal structure of Photosystem II from Synechococcus elongatus at 3.8 Å resolution. Nature 409: 739–743. [DOI] [PubMed] [Google Scholar]
- 4. Kamiya N, Shen J-R (2003) Crystal structure of oxygen-evolving Photosystem II from Thermosynechococcus vulcanus at 3.7 Å resolution. Proc Natl Sci Acad (USA) 100: 98–103. [DOI] [PMC free article] [PubMed] [Google Scholar]
- 5. Ferreira KN, Iverson TM, Maghlaoui K, Barber J, Iwata S (2004) Architecture of the photosynthetic oxygen-evolving center. Science 303: 1831–1838. [DOI] [PubMed] [Google Scholar]
- 6. Loll B, Kern N, Saenger W, Zouni A, Biesiadka J (2006) Towards complete cofactor arrangement in the 3.0 Å resolution structure of Photosystem II. Nature 438: 1040–1044. [DOI] [PubMed] [Google Scholar]
- 7. Guskov A, Kern J, Gabdulkhakov A, Broser M, Zouni A, et al. (2009) Cyanobacterial photosystem II at 2.9 Å resolution and the roles of quinones, lipids, channels and chloride. Nat Struct Mol Biol 16: 334–342. [DOI] [PubMed] [Google Scholar]
- 8. Umena Y, Kawakami K, Shen J-R, Kamiya N (2011) Crystal structure of oxygen-evolving Photosystem II at a resolution of 1.9 Å. Nature. 473: 55–60. [DOI] [PubMed] [Google Scholar]
- 9. Bricker TM, Roose JL, Fagerlund RD, Frankel LK, Eaton –Rye JJ (2012) The extrinsic proteins of Photosystem II. Biochim Biophys Acta 1817: 121–142. [DOI] [PubMed] [Google Scholar]
- 10. Bricker TM, Frankel LK (1998) The structure and function of the 33 kDa extrinsic protein of Photosystem II. A critical review. Photosyn Res 56: 157–173. [Google Scholar]
- 11. Roose J, Wegener K, Pakrasi H (2007) The extrinsic proteins of Photosystem II. Photosyn Res 92: 369–387. [DOI] [PubMed] [Google Scholar]
- 12. Roose JL, Frankel LK, Bricker TM (2010) Documentation of significant electron transport defects on the reducing side of Photosystem II upon removal of the PsbP and PsbQ extrinsic proteins. Biochemistry 49: 36–41. [DOI] [PubMed] [Google Scholar]
- 13. Bricker TM, Frankel LK (2011) Auxiliary functions of the PsbO, PsbP and PsbQ proteins of higher plant Photosystem II: A critical analysis. J Photochem Photobiol B: Biol 104: 165–178. [DOI] [PubMed] [Google Scholar]
- 14.Bricker TM, Ghanotakis DF (1996) Introduction to oxygen evolution and the oxygen-evolving complex. In: Ort DR, Yocum CF, editors. Oxygenic Photosynthesis: The Light Reactions. Dordrecht: Kluwer Academic Publishers. 113–136. [Google Scholar]
- 15. Pospíšil P, Arató A, Krieger-Liszkay A, Rutherford AW (2004) Hydroxyl radical generation by Photosystem II. Biochemistry 43: 6783–6792. [DOI] [PubMed] [Google Scholar]
- 16. Pospíšil P (2009) Production of reactive oxygen species by Photosystem II. Biochim Biophys Acta 1787: 1151–1160. [DOI] [PubMed] [Google Scholar]
- 17. Durrant JR, Giorgi LB, Barber J, Klug DR, Porter G (1990) Characterization of triplet-states in isolated Photosystem II reaction centres – oxygen quenching as a mechanism for photodamage. Biochim Biophys Acta 1017: 166–175. [Google Scholar]
- 18. Macpherson AN, Telfer A, Truscott TG, Barber J (1993) Direct detection of singlet oxygen from isolated Photosystem II reaction centres. Biochim Biophys Acta 1143: 301–309. [Google Scholar]
- 19. Hideg E, Spetea C, Vass I (1994) Singlet oxygen production in thylakoid membranes during photoinhibition as detected by EPR spectroscopy. Photosyn Res 39: 191–199. [DOI] [PubMed] [Google Scholar]
- 20. Frankel LK, Sallans L, Limbach PA, Bricker TM (2012) Identification of oxidized amino acid residues in the vicinity of the Mn4CaO5 cluster of Photosystem II: Implications for the identification of oxygen channels within the photosystem. Biochemistry 51: 6371–6377. [DOI] [PMC free article] [PubMed] [Google Scholar]
- 21. Anderson LB, Maderia M, Ouellette AJA, Putnam-Evans C, Higgins L, et al. (2002) Posttranslational modifications in the CP43 subunit of Photosystem I. Proc Natl Acad Sci (USA). 99: 14676–14681. [DOI] [PMC free article] [PubMed] [Google Scholar]
- 22. Dreaden Kasson TM, Rexroth S, Barry BA (2012) Light-induced oxidative stress, N-formylkynurenine, and oxygenic photosynthesis. Plos One 7: e42220. [DOI] [PMC free article] [PubMed] [Google Scholar]
- 23. Dreaden TM, Chen J, Rexroth S, Barry BA (2011) N-Formylkynurenine as a marker of high light stress in photosynthesis. J Biol Chem 286: 22632–22641. [DOI] [PMC free article] [PubMed] [Google Scholar]
- 24. Kyle DJ, Ohad I, Arntzen CJ (1984) Membrane protein damage and repair: selective loss of a quinone-protein function in chloroplast membranes. Proc Natl Acad Sci (USA) 81: 4070–4074. [DOI] [PMC free article] [PubMed] [Google Scholar]
- 25.Ananyev GM, Renger G, Wacker U, Klimov V (1994) The photoproduction of superoxide radicals and the superoxide dismutase activity of Photosystem II. The possible involvement of cytochrome b559. Photosyn Res: 327–338. [DOI] [PubMed] [Google Scholar]
- 26. Liu K, Sun J, Song YG, Liu B, Xu YK, et al. (2004) Superoxide, hydrogen peroxide and hydroxyl radical in D1/D2/cytochrome b559 Photosystem II reaction center complex. Photosyn Res 81: 41–47. [DOI] [PubMed] [Google Scholar]
- 27.Whitmarsh J, Pakrasi HB (1996) Form and function of cytochrome b559. In: Ort DR, Yocum CF, editors. Oxygenic Photosynthesis: The Light Reactions. Dordrech: Kluwer Academic Publishers. 249–264. [Google Scholar]
- 28. Kruk J, Strzałka K (1999) Dark reoxidation of the plastoquinone-pool is mediated by the low-potential form of cytochrome b559 in spinach thylakoids. Photosyn Res 62: 273–279. [Google Scholar]
- 29. Sharma J, Panico M, Barber J, Morris HR (1997) Purification and determination of intact molecular mass by electrospray ionization mass spectrometry of the photosystem II reaction center subunits. J Biol Chem 272: 33153–33157. [DOI] [PubMed] [Google Scholar]
- 30. Nakamura T, Dohmae N, Takio K (2004) Characterization of a digested protein complex with quantitative aspects: An approach based on accurate mass chromatographic analysis with Fourier transform-ion cyclotron resonance mass spectrometry. Proteomics 4: 2558–2566. [DOI] [PubMed] [Google Scholar]
- 31. Summerfield TC, Toepel J, Sherman LA (2008) Low-oxygen induction of normally cryptic psbA genes in cyanobacteria. Biochemistry 47: 12939–12941. [DOI] [PubMed] [Google Scholar]
- 32. Sander J, Nowaczyk M, Buchta J, Dau H, Vass I, et al. (2010) Functional characterization and quantification of the alternative PsbA copies in Thermosynechococcus elongatus and their role in photoprotection. J Biol Chem 285: 29851–29856. [DOI] [PMC free article] [PubMed] [Google Scholar]
- 33. Merry SAP, Nixon PJ, Barter LMC, Schilstra M, Porter G, et al. (1998) Modulation of quantum yield of primary radical pair formation in photosystem II by site-directed mutagenesis affecting radical cations and anions. Biochemistry 37: 17439–17447. [DOI] [PubMed] [Google Scholar]
- 34. Dorlet P, Xiong L, Sayre RT, Un S (2001) High field EPR study of the pheophytin anion radical in wild type and D1–E130 mutants of Photosystem II in Chlamydomonas reinhardtii . J Biol Chem 276: 22313–22316. [DOI] [PubMed] [Google Scholar]
- 35. Calhoun DB, Vanderkooi JM, Woodrow III GV, Englander S (1983) W (1983) Penetration of dioxygen into proteins studied by quenching of phosphorescence and fluorescence. Biochemistry 22: 1526–1532. [DOI] [PubMed] [Google Scholar]
- 36. Sharma J, Panico M, Shipton CA, Nilsson F, Morris HR, et al. (1997) Primary structure characterization of the Photosystem II D1 and D2 subunits. J Biol Chem 272: 33158–33166. [DOI] [PubMed] [Google Scholar]
- 37. Pospíšil P, Šnyrychova? S, Nauš J (2007) Dark production of reactive oxygen species in photosystem II membrane particles at elevated temperature: EPR spin-trapping study. Biochim Biophys Acta 1767: 854–859. [DOI] [PubMed] [Google Scholar]
- 38. Yamashita A, Nijo N, Pospíšil P, Morita N, Takenaka D, et al. (2008) Quality control of Photosystem II: reactive oxygen species are responsible for the damage to Photosystem II under moderate heat stress. J Biol Chem 283: 28380–28391. [DOI] [PMC free article] [PubMed] [Google Scholar]
- 39. Krieger-Liszkay A (2005) Singlet oxygen production in photosynthesis. J Exp Bot 56: 337–346. [DOI] [PubMed] [Google Scholar]
- 40. Schey KL, Finley EL (2000) Identification of peptide oxidation by tandem mass spectrometry. Acc Chem Res 33: 299–306. [DOI] [PubMed] [Google Scholar]
- 41. Schöneich C, Sharov VS (2006) Mass spectrometry of protein modifications by reactive oxygen and nitrogen species. Free Rad Biol Med 41: 1507–1520. [DOI] [PubMed] [Google Scholar]
- 42. Sundby C, McCaffery S, Anderson JM (1993) Turnover of the Photosystem II D1 protein in higher plants under photoinhibitory and nonphotoinhibitory irradiance. J Biol Chem 268: 25476–25482. [PubMed] [Google Scholar]
- 43. Berthold DA, Babcock GT, Yocum CF (1981) A highly resolved oxygen-evolving Photosystem II preparation from spinach thylakoid membranes. FEBS Lett 134: 231–234. [Google Scholar]
- 44. Ghanotakis DF, Babcock GT (1983) Hydroxylamine as an inhibitor between Z and P680 in Photosystem II. FEBS Lett 153: 231–234. [Google Scholar]
- 45. Delepelaire P, Chua N (1979) Lithium dodecyl sulfate/polyacrylamide gel electrophoresis of thylakoid membranes at 4°C: Characterizations of two additional chlorophyll a-protein complexes. Proc Natl Acad Sci (USA) 76: 111–115. [DOI] [PMC free article] [PubMed] [Google Scholar]
- 46. Rabilloud T, Vincon M, Garin J (1995) Micropreparative one- and two-dimensional electrophoresis: Improvement with new photopolymerization systems. Electrophoresis 16: 1414–1422. [DOI] [PubMed] [Google Scholar]
- 47. Sun G, Anderson VE (2004) Prevention of artifactual protein oxidation generated during sodium dodecyl sulfate-gel electrophoresis. Electrophoresis 25: 959–965. [DOI] [PubMed] [Google Scholar]
- 48. Xu H, Freitas MA (2007) A mass accuracy sensitive probability based scoring algorithm for database searching of tandem mass spectrometry data. BMC Bioinform 8: 133–137. [DOI] [PMC free article] [PubMed] [Google Scholar]
- 49. Xu H, Freitas MA (2009) MassMatrix: A database search program for rapid characterization of proteins and peptides from tandem mass spectrometry data. Proteomics 9: 1548–1555. [DOI] [PMC free article] [PubMed] [Google Scholar]
- 50. Takamoto K, Chance MR (2006) Radiolytic protein footprinting with mass spectrometry to probe the structure of macromolecular complexes. Ann Rev Biophys Biomol Struct 35: 251–276. [DOI] [PubMed] [Google Scholar]
- 51. Renzone G, Salzano AM, Arena S, D'Ambrosio C, Scaloni A (2007) Mass spectrometry-based approaches for structural studies on protein complexes at low-resolution. Curr Proteom 4: 1–16. [Google Scholar]
- 52. Elias JE, Haas W, Faherty BK, Gygi SP (2005) Comparative evaluation of mass spectrometry platforms used in large-scale proteomics investigations. Nat Meth 2: 667–675. [DOI] [PubMed] [Google Scholar]
- 53.Software The PyMOL Molecular Graphics System, Version 1.4 Schrödinger, LLC. [Google Scholar]
- 54. Furman OS, Teel AL, Watts RJ (2010) Mechanism of base activation of persulfate. Environ Sci Technol 44: 6423–6428. [DOI] [PubMed] [Google Scholar]
Associated Data
This section collects any data citations, data availability statements, or supplementary materials included in this article.
Supplementary Materials
Mass Spectrometry Data from the Unmodified Peptide. 235AFNPTQAEETYSMVTAN252R and the Oxidatively Modified Peptide 235AFN238P+16 239T+16 QA242E-30 ETYSM+16 VTAN252R of the D2 Protein A. Top, spectrum of the CID dissociation of the unmodified peptide 235AFNPTQAEETYSMVTAN252R. Various identified ions are labeled. Bottom, table of all predicted masses for the y- and b- ions generated from this peptide sequence. Ions identified in the CID spectrum (above) are shown in red. The b'++, b'+ y'++ and y'+ ions are generated by the neutral loss of water while the b*++, b*+ y*++ and y*+ ions are generated from the loss of ammonia. B. Top, spectrum of the CID dissociation of the modified 235AFN238P+16 239T+16 QA242E-30 ETYSM+16 VTAN252R. Various identified ions are labeled. Bottom, table of all predicted masses for the y- and b- ions generated from this peptide sequence. Ions identified in the CID spectrum are shown in red. The b'++, b'+ y'++ and y'+ ions are generated by the neutral loss of water while the b*++, b*+ y*++ and y*+ ions are generated from the loss of ammonia. The p values for the unmodified and modified peptide were 10−13 and 10−14, respectively.
(DOCX)
Mass Spectrometry Data from the Unmodified Peptide. 239FGQEEETYNIHAAHGYFG257R and the Oxidatively Modified Peptide 239F+16 G241Q+14 242E-30 EETYNIHAAHGYFG257R of the D1 Protein A. Top, spectrum of the CID dissociation of the unmodified peptide 239FGQEEETYNIHAAHGYFG257R. Various identified ions are labeled. Bottom, table of all predicted masses for the y- and b- ions generated from this peptide sequence. Ions identified in the CID spectrum (above) are shown in red. The b'++, b'+ y'++ and y'+ ions are generated by the neutral loss of water while the b*++, b*+ y*++ and y*+ ions are generated from the loss of ammonia. B. Top, spectrum of the CID dissociation of the modified G241Q+14 242E-30 EETYNIHAAHGYFG257R. Various identified ions are labeled. Bottom, table of all predicted masses for the y- and b- ions generated from this peptide sequence. Ions identified in the CID spectrum are shown in red. The b'++, b'+ y'++ and y'+ ions are generated by the neutral loss of water while the b*++, b*+ y*++ and y*+ ions are generated from the loss of ammonia. The p values for the unmodified and modified peptide were 10−8 and 10−9, respectively.
(DOCX)
Mass Spectrometry Data from the Oxidatively Modified Peptide 130E+16 WE133L+16 S135F+16 136R of the D1 Protein A. Top, spectrum of the CID dissociation of the modified peptide. Various identified ions are labeled. Bottom, table of all predicted masses for the y- and b- ions generated from this peptide sequence. Ions identified in the CID spectrum (above) are shown in red. The b'++, b'+ y'++ and y'+ ions are generated by the neutral loss of water while the b*++, b*+ y*++ and y*+ ions are generated from the loss of ammonia. The p value for this peptide is 10−6.
(DOCX)