

Two 4-coumaric acid:CoA ligases regulate CoA flux with novel specificity.
Abstract
4-Coumaric acid:coenzyme A ligase (4CL) is involved in monolignol biosynthesis for lignification in plant cell walls. It ligates coenzyme A (CoA) with hydroxycinnamic acids, such as 4-coumaric and caffeic acids, into hydroxycinnamoyl-CoA thioesters. The ligation ensures the activated state of the acid for reduction into monolignols. In Populus spp., it has long been thought that one monolignol-specific 4CL is involved. Here, we present evidence of two monolignol 4CLs, Ptr4CL3 and Ptr4CL5, in Populus trichocarpa. Ptr4CL3 is the ortholog of the monolignol 4CL reported for many other species. Ptr4CL5 is novel. The two Ptr4CLs exhibited distinct Michaelis-Menten kinetic properties. Inhibition kinetics demonstrated that hydroxycinnamic acid substrates are also inhibitors of 4CL and suggested that Ptr4CL5 is an allosteric enzyme. Experimentally validated flux simulation, incorporating reaction/inhibition kinetics, suggested two CoA ligation paths in vivo: one through 4-coumaric acid and the other through caffeic acid. We previously showed that a membrane protein complex mediated the 3-hydroxylation of 4-coumaric acid to caffeic acid. The demonstration here of two ligation paths requiring these acids supports this 3-hydroxylation function. Ptr4CL3 regulates both CoA ligation paths with similar efficiencies, whereas Ptr4CL5 regulates primarily the caffeic acid path. Both paths can be inhibited by caffeic acid. The Ptr4CL5-catalyzed caffeic acid metabolism, therefore, may also act to mitigate the inhibition by caffeic acid to maintain a proper ligation flux. A high level of caffeic acid was detected in stem-differentiating xylem of P. trichocarpa. Our results suggest that Ptr4CL5 and caffeic acid coordinately modulate the CoA ligation flux for monolignol biosynthesis.
Lignin is an irreversible, terminal output of a major metabolic pathway in plant secondary metabolism. It is a polyphenolic structural component of the secondary cell walls of vascular plants and plays a unique role in the adaptation of plants to their environment and in resistance to biotic and abiotic stresses (Harada and Cote, 1985). In the formation of secondary cell walls, lignin is deposited between cells (middle lamella) and in cell walls. In the secondary wall, lignin surrounds the hemicelluloses and cellulose, forming a composite of the three major wall components (Timell, 1969; Terashima et al., 2009). Lignin is a major barrier to the utilization of biomass for energy, for papermaking, and for forage digestibility due to its interaction with cellulosics (Sarkanen, 1976; Chiang, 2002; Chen and Dixon, 2007). Studying lignin biosynthesis at the systems or holistic level should lead to better understanding of how the entire biosynthetic pathway is organized and regulated, providing more precise strategies to improve the production of energy, biomaterials, and food.
Lignin is typically polymerized from three phenylpropanoid monomers, 4-coumaryl alcohol (metabolite 20 in Fig. 1), coniferyl alcohol (22), and sinapyl alcohol (24), also called the H, G, and S monolignols, respectively. In woody dicotyledons, such as Populus spp., lignin is polymerized from S and G monolignols and low levels of H monolignols and other intermediate metabolites (Sarkanen and Ludwig, 1971; Higuchi, 1997; Ralph et al., 2008). Knowledge of the enzymes and metabolites of the monolignol pathway stems from tracer studies in the 1950s (Brown and Neish, 1955, 1956, 1959; Brown, 1961; Higuchi and Brown, 1963a, 1963b). Ten enzyme families convert Phe (1 in Fig. 1) to monolignols through a metabolic grid (Higuchi, 1997, 2003), with a principal pathway through coniferaldehyde (Chen et al., 2011; Wang et al., 2012). Although the current knowledge is substantial, many aspects of the monolignol pathway are not yet quantified or sufficient for a comprehensive systems understanding. A systems understanding begins with an essentially complete set of relevant genes from the genome sequence (Kitano, 2002; Albert, 2007). Populus trichocarpa (Nisqually-1 genotype) is an ideal model species for studying lignin biosynthesis at the systems level because its genome has been sequenced and for its relevance as a feedstock for the production of biofuels and biomaterials.
Figure 1.

The proposed monolignol biosynthetic pathway. The principal pathways for the biosynthesis of monolignols 4-coumaryl, coniferyl, and sinapyl alcohols are highlighted in gray. The first step in the pathway involves the deamination of Phe to cinnamic acid by phenylalanine ammonia-lyase (PAL). A multiple protein complex (C4H-C3H) consists of cinnamic acid 4-hydroxylase (C4H) and 4-coumarate 3-hydroxylase (C3H) hydroxylate cinnamic acid at the ring 4 position to 4-coumaric acid and subsequently at the ring-3 position of 4-coumaric acid to caffeic acid (Chen et al., 2011). 4CL then activates the hydroxycinnamic acids to their corresponding CoA thioesters. The C4H-C3H protein complex, in conjunction with 4-hydroxycinnamoyl-CoA:quinate shikimate 4-hydroxycinnamoyltransferase (HCT), hydroxylate 4-coumaroyl-CoA, at the 3 position to caffeoyl-CoA. Caffeoyl-CoA O-methyltransferase (CCoAOMT), coniferyl aldehyde 5-hydroxylase (CAld5H), and 5-hydroxyconiferaldehyde O-methyltransferase (AldOMT) modify the phenolic ring at the 3 and 5 positions through a series of hydroxylation and methoxylation reactions. Cinnamoyl-CoA reductase (CCR) and cinnamyl alcohol dehydrogenase (CAD) reduce the phenolic intermediates to monolignols.
Based on transcript abundance and tissue specificity, we previously identified in the P. trichocarpa genome 23 genes that potentially represent a complete set of relevant genes encoding monolignol biosynthesis enzymes during wood formation (Shi et al., 2010). This result suggested substantial functional redundancy in monolignol biosynthesis not previously recognized (Wang et al., 2012). Members in six of the 10 monolignol enzyme families may have redundant functions: five members for phenylalanine ammonia-lyase, two for cinnamic acid 4-hydroxylase, three for 4-coumaric acid:coenzyme A ligase (Ptr4CL), two for 4-hydroxycinnamoyl-CoA:shikimic acid 4-hydroxycinnamoyltransferase, three for caffeoyl-CoA O-methyltransferase, and two for coniferyl aldehyde 5-hydroxylase enzyme families (Shi et al., 2010). Evidence from in vitro experiments also indicates a significant level of pathway metabolite-mediated feedback and feed-forward regulation of enzyme functions in monolignol biosynthesis (Sato et al., 1982; Bolwell et al., 1986; Osakabe et al., 1999; Blount et al., 2000; Li et al., 2000; Li et al., 2001). Redundancy and feedback/feed-forward or coordinated regulation of enzyme functions may represent constraints necessary for maintaining optimal metabolic flux distributions in the biosynthesis of monolignols for lignification. Quantitative analysis and integration of these regulations, manifested by specific enzyme kinetic properties, for all enzymes involved in a single species is essential for a comprehensive understanding of how the entire network of metabolic fluxes functions. In this paper, we begin a systems analysis of the P. trichocarpa 4CL gene family members.
Genomic studies have shown that the 4CL gene family typically has multiple members, often with additional 4CL-like genes (Raes et al., 2003; Shi et al., 2010). Arabidopsis (Arabidopsis thaliana) has three (Ehlting et al., 1999; Raes et al., 2003; Schneider et al., 2003; Vanholme et al., 2012), the moss Physcomitrella patens has four (Silber et al., 2008), rice (Oryza sativa) has five (Gui et al., 2011), and P. trichocarpa has 17 members (Souza et al., 2008; Shi et al., 2010). The 4CL gene product catalyzes CoA ligation of many hydroxycinnamic acids (Fig. 1) into the corresponding CoA thioesters for the biosynthesis of phenylpropanoids, such as monolignols (Walton and Butt, 1970; Knobloch and Hahlbrock, 1975; Higuchi, 1997; Lee et al., 1997; Hu et al., 1998, 1999; Ehlting et al., 1999; Harding et al., 2002). Biochemical and genetic studies further demonstrated that a key function of monolignol 4CLs is the regulation of CoA ligation fluxes to affect the total lignin content in secondary cell walls in tobacco (Nicotiana tabacum; Kajita et al., 1996), Populus spp. (Hu et al., 1999; Voelker et al., 2010), Eucalyptus grandis (Harakava, 2005), Arabidopsis (Vanholme et al., 2012), rice (Gui et al., 2011), and sorghum (Sorghum bicolor; Saballos et al., 2012). How multiple 4CL members contribute to this regulation is not clear, even though the presence of multiple members has long been known. Of the 17 putative 4CL members in P. trichocarpa, only three (Ptr4CL3, Ptr4CL5, and Ptr4CL17) are implicated in monolignol biosynthesis in wood-forming tissue (Shi et al., 2010). Ptr4CL3 is an ortholog of aspen (Populus tremuloides) 4CL1 (Pt4CL1; Hu et al., 1998, 1999); Ptr4CL5 and Ptr4CL17 have not been identified prior to the availability of the genome sequence, and their biochemical functions remain unknown. Investigation of the coordinated functions of Ptr4CL3, Ptr4CL5, and Ptr4CL17 may lead to novel insights into the complex regulation of CoA ligation fluxes controlling lignification.
The impact of the regulation of a single complex step in a biosynthetic pathway, such as monolignol biosynthesis, can be quantitatively revealed by modeling. In particular, models based on enzyme kinetics are able to simulate plant metabolic pathways and effectively describe metabolic behavior and provide predictive in vivo information (Schallau and Junker, 2010). Few enzymatic steps in the monolignol biosynthetic pathway are characterized in sufficient detail for modeling, usually because all of the members of the gene family have not been identified or the kinetic properties of the purified enzymes have not been adequately characterized. A model of monolignol biosynthesis in alfalfa (Medicago sativa) incorporating some transgenic perturbations has recently been proposed (Lee et al., 2011) that suggested two novel regulatory mechanisms.
Here, we focus on specific enzyme kinetics properties of the Ptr4CL members that would quantitatively describe the biochemical functions and pathway metabolite-mediated regulation of the CoA ligation flux in monolignol biosynthesis. The mode and quantitative impact of enzyme-substrate interactions, including inhibitions, have been analyzed in detail for these Ptr4CL members to include these effects in a mathematical model of reaction flux. This method provides new opportunities to utilize genomic information to develop predictive models for entire biosynthetic pathways of interest.
RESULTS
Two 4CL Paralogs, Ptr4CL5 and Ptr4CL3, Are Implicated in Monolignol Biosynthesis in P. trichocarpa
Of the 17 putative 4CL genes in the P. trichocarpa genome, only Ptr4CL3 (locus identifier Potri.001G036900), Ptr4CL5 (Potri.003G188500), and Ptr4CL17 (Potri.012G095000) are expressed more specifically in stem-differentiating xylem (SDX) and were suggested for biochemical roles in monolignol biosynthesis (Shi et al., 2010). Ptr4CL3 and Ptr4CL5 share 89.4% protein sequence identity and are located on linkage groups 1 and 3, respectively, in the P. trichocarpa genome. Therefore, they are paralogs and not alleles. Ptr4CL17 is on linkage group 12 and has low protein (36.8%) sequence identity with Ptr4CL3. Ptr4CL3, Ptr4CL5, and Ptr4CL17 are three distinct genes encoding putative 4CLs.
We first tested whether Ptr4CL3, Ptr4CL5, and Ptr4CL17 have the CoA ligation function. We used 4-coumaric acid as the substrate and purified C-terminal 6×His-tagged recombinant proteins produced from Escherichia coli for the verification, using previously established reaction conditions (Hu et al., 1998). Ptr4CL3 and Ptr4CL5 exhibited strong and distinct CoA ligation activities with 4-coumaric acid. Ptr4CL17 had no such activity, indicating that Ptr4CL17 is not a CoA ligase for monolignol biosynthesis. We then focused on Ptr4CL3 and Ptr4CL5 in this study.
Phosphoproteomics and Immunodetection Analysis Suggest That Native Ptr4CL3 and Ptr4CL5 Are Not Phosphorylated
Prior to enzyme functional characterizations using recombinant proteins, we tested whether posttranslational modification, such as protein phosphorylation, is involved in planta in the targeted 4CLs. We used an immobilized metal ion affinity chromatography-based phosphopeptide-enrichment approach coupled with liquid chromatography (LC)-tandem mass spectrometry (MS/MS; Chien et al., 2011) to analyze the phosphoproteome of P. trichocarpa SDX to identify any evidence of phosphorylation in monolignol proteins. The phosphopeptide enrichment is necessary because (1) phosphorylation is typically a low-occupancy posttranslational modification and (2) data-dependent acquisition selects peptides in real time for sequencing based on ion abundance. These two factors significantly discriminate against phosphopeptide sequencing if an up-front enrichment strategy is not included. We analyzed the phosphopeptide-enriched SDX protein fractions and identified a total of 147 phosphoprotein groups. None of them were proteins known in the monolignol biosynthetic pathway (Shi et al., 2010; Liu et al., 2012). Given that monolignol proteins are highly abundant in SDX (Shi et al., 2010; Chen et al., 2011; Liu et al., 2012; Shuford et al., 2012a, 2012b), if they were phosphorylated, they most likely would have been detected. A similar phosphopeptide-enrichment/mass spectrometry (MS) strategy for the analysis of the phosphoproteome of dormant terminal buds in Populus simonii × Populus nigra identified 151 phosphoproteins (Liu et al., 2011). Likewise, none of them were monolignol proteins.
In addition to the phosphoproteomic approach, we also used phospho-specific antibodies to test whether the native Ptr4CL3 and Ptr4CL5 as well as E. coli-produced Ptr4CL3 and Ptr4CL5 recombinant proteins are phosphorylated. This immunodetection approach has been widely used to identify phosphorylated proteins (Miller, 2005; Prabakaran et al., 2011). We used anti-aspen 4CL1 antibodies (Li et al., 2003), which can recognize P. trichocarpa Ptr4CL3 and Ptr4CL5, to immunoprecipitate the native Ptr4CL3 and Ptr4CL5 from P. trichocarpa SDX protein extracts (Fig. 2, C and D). Western-blot analysis demonstrated that the phospho-specific antibodies do not bind to P. trichocarpa SDX Ptr4CL3 and Ptr4CL5, nor do they bind to the C-terminal 6×His tag recombinant Ptr4CL3 and Ptr4CL5 (Fig. 2, C, G, and H). These results are strong evidence that Ptr4CL3 and Ptr4CL5 are not phosphorylated in planta and that the enzymatic functions of E. coli-produced recombinant Ptr4CL3 and Ptr4CL5 are representative of those for the native proteins.
Figure 2.
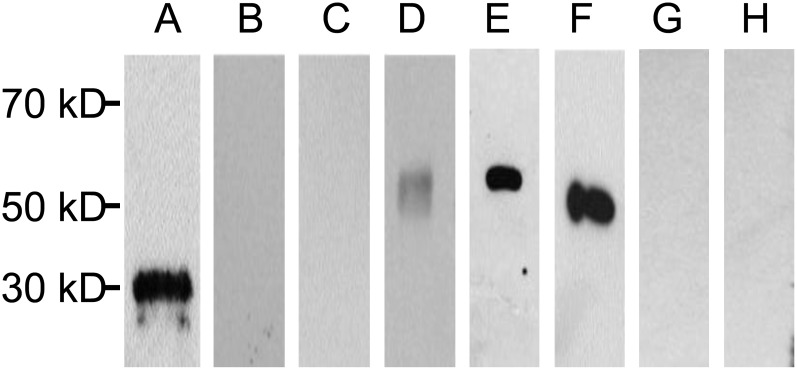
Western blotting of native and recombinant Ptr4CL3 and Ptr4CL5 using phospho-specific antibodies and 4CL antibodies. A, Positive control: phosvitin. B, Negative control: soybean (Glycine max) trypsin inhibitor. C and D, Ptr4CL3 and Ptr4CL5 pulled down from P. trichocarpa SDX crude proteins using anti-aspen 4CL1 antibodies and probed with phospho-specific antibodies (C) and anti-aspen 4CL1 antibodies (D). E and G, Recombinant Ptr4CL3 proteins probed with anti-aspen 4CL1 antibodies (E) and phospho-specific antibodies (G). F and H, Recombinant Ptr4CL5 proteins probed with anti-aspen 4CL1 antibodies (F) and phospho-specific antibodies (H).
Ptr4CL3 and Ptr4CL5 Are Functionally Distinct and Ptr4CL5 Is a Novel CoA Ligase for Monolignol Biosynthesis
Using 6×His-tagged recombinant proteins and 4-coumaric acid as the substrate, we estimated the optimal pH and temperature and tested six different divalent cations for Ptr4CL3 and Ptr4CL5 reactions (Supplemental Fig. S1, A–C). All CoA ligation reactions were monitored by HPLC and were quantified based on the quantity of the 4-coumaryol-CoA thioester product, corroborated by the authentic compound. No background CoA ligation activity could be detected from proteins produced by E. coli with an empty expression construct. The ligation by Ptr4CL3 is most effective at pH 8.0, whereas Ptr4CL5 has a pH optimum of 7.0. Both enzymes have an optimal reaction temperature of 40°C and can be most effectively activated by Mg2+ or Mn2+ compared with Zn2+, Cu2+, and Ca2+. For Ptr4CL5 reactions, Co2+ is also an effective activator. We chose Mg2+ for the entire study.
Under the identified optimal reaction conditions, we compared Ptr4CL3 and Ptr4CL5 for their CoA ligation specificities with the five potential monolignol 4CL substrates (4-coumaric, caffeic, ferulic, 5-hydroxyferulic, and sinapic acids) using the purified C-terminal 6×His-tagged recombinant proteins (Table I). Ptr4CL3 efficiently converts all but sinapic acid into their corresponding CoA thioesters. The peptide sequence and particularly the biochemical functions of Ptr4CL3 demonstrate that Ptr4CL3 is a structural and functional ortholog of aspen 4CL1 previously identified and characterized (Hu et al., 1998, 1999; Harding et al., 2002). Ptr4CL5 mediates the CoA ligation of all five acids, and the functions of this 4CL have not been previously identified. Ptr4CL3 and Ptr4CL5 are distinct 4CLs, and they both have the highest conversion rate with 4-coumaric acid. We reexamined the CoA ligation reaction for Ptr4CL17 and confirmed that this protein has no ligation activity with any of the five substrates (Tables I and II).
Table I. Ptr4CL single substrate specificity.
Ptr4CL3, Ptr4CL5, and Ptr4CL17 activity assays were performed with individual hydroxycinnamic acids. Substrate concentrations were fixed at 50 µm. All recombinant 4CLs show the highest reaction rate with 4-coumaric acid. Values represent means ± se of three technical replicates. ND, Nondetectable.
| 4CL | Substrate Specificity |
||||
|---|---|---|---|---|---|
| 4-Coumaric Acid to 4-Coumaroyl-CoA | Caffeic Acid to Caffeoyl-CoA | Ferulic Acid to Feruloyl-CoA | 5-Hydroxyferulic Acid to 5-Hydroxyferuloyl-CoA | Sinapic Acid to Sinapoyl-CoA | |
| nmol min-1 mg-1 protein | |||||
| Ptr4CL3 | 923.14 ± 98.01 | 445.94 ± 36.27 | 729.62 ± 39.4 | 202.14 ± 19.54 | ND |
| Ptr4CL5 | 582.24 ± 82.35 | 301.61 ± 28.97 | 354.65 ± 51.56 | 174.74 ± 37.28 | 4.65 ± 6.58 |
| Ptr4CL17 | ND | ND | ND | ND | ND |
Table II. Ptr4CL multiple substrate specificity.
Ptr4CL3, Ptr4CL5, and Ptr4CL17 activity assays were performed with a mixture of all five hydroxycinnamic acids with each substrate at a final concentration of 50 µm. All recombinant 4CLs show the highest reaction rate with caffeic acid. Values represent means ± se of three technical replicates. ND, Nondetectable.
| 4CL | Substrate Specificity |
||||
|---|---|---|---|---|---|
| 4-Coumaroyl-CoA | Caffeoyl-CoA | Feruloyl-CoA | 5-Hydroxyferuloyl-CoA | Sinapoyl-CoA | |
| nmol min−1 mg−1 protein | |||||
| Ptr4CL3 | 141.30 ± 31.5 | 317.28 ± 11.29 | 29.17 ± 8.74 | ND | ND |
| Ptr4CL5 | 116.28 ± 35.96 | 252.00 ± 16.69 | 0.47 ± 0.67 | 0.47 ± 0.82 | ND |
| Ptr4CL17 | ND | ND | ND | ND | ND |
When a mixture of all five hydroxycinnamic acids (at equal concentrations) reacted with either Ptr4CL3 or Ptr4CL5, the CoA ligation of caffeic acid became the most effective reaction (Table II), in contrast to 4-coumaric acid being the most effective substrate when there were no other competing substrates (Table I). In the mixed substrate case, the conversion rate for 4-coumaric acid was reduced by approximately 7-fold for Ptr4CL3 and approximately 5-fold for Ptr4CL5 compared with that for the 4-coumaric acid as the only substrate. In addition, conversion of ferulic acid or 5-hydroxyferulic acid was nearly abolished in the mixed substrate reaction. These results clearly indicate strong inhibitory effects of specific hydroxycinnamic acids on 4CL activity, altering the substrate specificity of both Ptr4CL3 and Ptr4CL5.
C-Terminal 6×His Fusion Does Not Affect the Substrate Specificity and Relative Reaction Rates of Ptr4CL3 and Ptr4CL5
To test whether the substrate specificities observed above are associated with the C-terminal His tag, we compared the C-terminal 6×His-tagged and nontagged recombinant proteins for substrate specificity and relative reaction rates with the five hydroxycinnamic acids using the identified optimal reaction conditions (Supplemental Fig. S2). The nontagged recombinant proteins were produced by removing the His tag using an endoprotease. In reactions with a single substrate, the His-tagged and tag-free recombinant proteins exhibited nearly identical substrate specificities and relative reaction rates with these hydroxycinnamic acids (Supplemental Fig. S2, A–D). Likewise, with a mixture of the five substrates, the tagged and nontagged proteins also showed highly similar substrate specificities and relative rates (Supplemental Fig. S2, E–H). The results confirmed the observed substrate specificities (Tables I and II) and the inference of inhibition of Ptr4CL3 and Ptr4CL5 by specific hydroxycinnamic acids. We then produced a large amount of the purified His-tagged recombinant protein to conduct enzyme kinetic analysis, including inhibition kinetics of these two 4CLs, to reveal the mechanisms of their enzyme actions. These kinetic data are the basis for developing mathematical models to quantitatively describe the net CoA ligation fluxes regulated by these two 4CLs.
Ptr4CL3 and Ptr4CL5 Exhibited Distinct Michaelis-Menten Kinetic Properties
We first determined the Michaelis-Menten kinetic properties (Km and kcat [the turnover number]) of recombinant Ptr4CL3 and Ptr4CL5 using 4-coumaric, caffeic, ferulic, 5-hydroxyferulic, and sinapic acids as substrates under the identified optimal reaction conditions. Reaction rates were determined using six concentrations of the substrate and a fixed concentration of the recombinant protein (see “Materials and Methods”). 4-Coumaric, caffeic, and 5-hydroxyferulic acids are equally good substrates for Ptr4CL3 and are much preferred over ferulic acid, based on the Km values (Table III). However, the enzyme specificity constants (kcat/Km) revealed that Ptr4CL3 can most effectively CoA ligate 4-coumaric acid. For Ptr4CL5, caffeic acid is by far the best (the lowest Km) substrate compared with the other acids. Ptr4CL5 also has the highest catalytic efficiency with caffeic acid (Table III). These kinetic properties further suggest that Ptr4CL3 and Ptr4CL5 have functionally independent roles.
Table III. Michaelis-Menten kinetics.
The Michaelis-Menten kinetic parameters are shown for Ptr4CL3 and Ptr4CL5 reactions with 4-coumaric, caffeic, ferulic, 5-hydroxyferulic, or sinapic acid. Values represent means ± se of three technical replicates. ND, Nondetectable.
| Acid |
Km |
kcat |
kcat/Km |
|||
|---|---|---|---|---|---|---|
| Ptr4CL3 | Ptr4CL5 | Ptr4CL3 | Ptr4CL5 | Ptr4CL3 | Ptr4CL5 | |
| μm | min−1 | min−1 μm−1 | ||||
| 4-Coumaric acid | 10.51 ± 2.84 | 148.06 ± 14.04 | 44.48 ± 8.86 | 106.83 ± 22.75 | 4.23 | 0.72 |
| Caffeic acid | 10.56 ± 2.44 | 43.51 ± 5.43 | 17.07 ± 3.42 | 43.69 ± 4.64 | 1.43 | 1.004 |
| Ferulic acid | 70.17 ± 4.37 | 133.51 ± 7.02 | 50.33 ± 2.17 | 68.41 ± 17.87 | 0.72 | 0.51 |
| 5-Hydroxyferulic acid | 10.97 ± 1.25 | 193.40 ± 21.54 | 3.08 ± 0.12 | 37.34 ± 8.53 | 0.28 | 0.19 |
| Sinapic acid | ND | 508.20 ± 37.26 | ND | 20.79 ± 5.23 | ND | 0.04 |
Enzyme Inhibition Kinetics Suggested That Ptr4CL3 Has a Single Binding Site That Is Mutually Exclusive for the Substrate and the Inhibitor
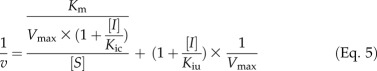
The substrate specificity tests (Tables I and II) revealed that hydroxycinnamic acid substrates may also inhibit 4CL activity. We focused on the inhibition of Ptr4CL3-catalyzed CoA ligation of 4-coumaric, caffeic, and ferulic acids because these are the three most significant Ptr4CL3 reactions (based on kcat/Km values; Table III). Inhibition kinetics information is essential for describing or modeling the net reaction rate for each of these enzymes. All five hydroxycinnamic acids were tested as individual inhibitors for 4CL reactions. First, we conducted inhibition kinetics for Ptr4CL3. As diagnosed by a Lineweaver-Burk plot, caffeic acid is a competitive inhibitor of 4-coumaric acid CoA ligation to 4-coumaroyl CoA (Fig. 3A). The competitive inhibition is indicated by an increased Km but an unchanged Vmax. The plot of K′m/V′max against inhibitor concentration [I] (Eq. 5) validates a linear inhibition mode, with a competitive inhibition constant (Kic) of 9.22 ± 2.68 μm (Fig. 3B). Because Vmax remained unchanged (Fig. 3A), the inhibition model is pure competitive (i.e. the uncompetitive inhibition constant [Kiu] based on the 1/V′max against [I] plot would be infinite).
Figure 3.

Inhibition of Ptr4CL3-catalyzed 4-coumaric acid CoA ligation by caffeic acid. A, The double reciprocal plot shows that the mode of inhibition is pure competitive. Error bars represent the se of three technical replicates. B, K′m/V′max against [caffeic acid] is used to derive Kic (Eq. 5).
We then showed that caffeic acid inhibits Ptr4CL3 reactions with ferulic acid in a pure-competitive mode (Supplemental Fig. S3J), with a Kic value of 3.15 ± 0.26 μm (Table IV). This Kic value is consistent with those obtained for recombinant protein 4CL1 (Harding et al., 2002), the aspen ortholog of PtrCL3. As verified by linear inhibition plots, all inhibitors tested here caused pure-competitive inhibition of Ptr4CL3 reactions, with distinct Kic values (Table IV; Supplemental Fig. S3). Compared with the other inhibitors, caffeic acid has the lowest Kic values (the highest affinity of enzyme-inhibitor complex) as a competitive inhibitor of Ptr4CL3 reactions with 4-coumaric, ferulic, and 5-hydroxyferulic acids (Table IV). A pure-competitive inhibition mode for Ptr4CL3 indicates that this enzyme has a single binding site that is mutually exclusive for the hydroxycinnamic acid substrate and inhibitor, consistent with the crystal structure of the Ptr4CL3 ortholog from Populus tomentosa (Hu et al., 2010).
Table IV. Ptr4CL3 inhibition kinetics.
Inhibition kinetics constants are shown for Ptr4CL3. Values represent means ± se of three technical replicates. ND, Nondetectable.
| Inhibitor | Substrate |
|||||
|---|---|---|---|---|---|---|
| 4-Coumaric Acid |
Caffeic Acid |
Ferulic Acid |
||||
| Kic | Kiu | Kic | Kiu | Kic | Kiu | |
| μm | ||||||
| 4-Coumaric acid | – | – | 43.73 ± 1.09 | ND | 13.12 ± 2.82 | ND |
| Caffeic acid | 9.22 ± 2.68 | ND | – | – | 3.15 ± 0.26 | ND |
| Ferulic acid | 55.05 ± 13.2 | ND | 59.36 ± 12.50 | ND | – | – |
| 5-Hydroxyferulic acid | 39.31 ± 3.95 | ND | 198.18 ± 10.03 | ND | 7.63 ± 1.75 | ND |
| Sinapic acid | 78.11 ± 15.2 | ND | ND | ND | 163.72 ± 14.4 | ND |
Enzyme Inhibition Kinetics Suggested That Ptr4CL5 Operates Like an Allosteric or Regulatory Enzyme
We next estimated the inhibition kinetics of Ptr4CL5. Like the Ptr4CL3 study above, we focused on 4-coumaric, caffeic, and ferulic acids. All five hydroxycinnamic acids were tested as inhibitors for each of the three CoA ligation reactions (Table V).
Table V. Ptr4CL5 inhibition kinetics.
Inhibition kinetics constants are shown for Ptr4CL5. Values represent means ± se of three technical replicates. ND, Nondetectable.
| Inhibitor | Substrate |
|||||
|---|---|---|---|---|---|---|
| 4-Coumaric Acid |
Caffeic Acid |
Ferulic Acid |
||||
| Kic | Kiu | Kic | Kiu | Kic | Kiu | |
| μm | ||||||
| 4-Coumaric acid | – | ND | 122.70 ± 6.7 | 78.07 ± 10.83 | 27.92 ± 3.7 | ND |
| Caffeic acid | 7.06 ± 3.1 | 49.75 ± 7.8 | – | 55.97 ± 6.05a | 18.47 ± 0.5 | 14.98 ± 0.67 |
| Ferulic acid | 335.54 ± 76.1 | 178.21 ± 60.7 | 518.93 ± 28.80 | 372.06 ± 73.26 | – | ND |
| 5-Hydroxyferulic acid | 48.8 ± 14.5 | 37.48 ± 5.94 | 45.36 ± 1.75 | 306.81 ± 40.59 | 185.78 ± 56.6 | 18.71 ± 4.62 |
| Sinapic acid | 631.72 ± 189.0 | 238.41 ± 44.7 | 2,841.64 ± 101.25 | 157.21 ± 9.35 | 384.85 ± 30.7 | 450.83 ± 4.1 |
Here, Kiu = Kis for substrate self-inhibition.
Inhibition of Ptr4CL5 CoA Ligation of 4-Coumaric Acid
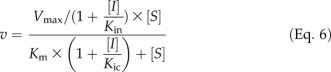
Of the five hydroxycinnamic acids tested, caffeic acid is the strongest inhibitor of Ptr4CL5 conversion of 4-coumaric acid. It is a mixed mode of inhibition, diagnosed by an increased Km and decreased Vmax (Fig. 4A). An increased Km can only be attributed to competitive inhibition. A decreased Vmax suggests that either uncompetitive or noncompetitive inhibition is also involved. To identify the specific type of mixed-mode inhibition, the data were fitted to both Equations 4 and 6 (see “Materials and Methods”). A linear (Eq. 4), rather than a second degree polynomial (Eq. 6), correlation for K′m/V′max against [I] was obtained, verifying a mixed mode of competitive and uncompetitive inhibition. This mixed inhibition is a predominantly competitive type because Kic is significantly smaller than Kiu (Fig. 4, B and C; Table V). Similarly, we showed that 5-hydroxyferulic acid also causes competitive and uncompetitive inhibition effects on Ptr4CL5 conversion of 4-coumaric acid (Supplemental Fig. S4C). It is an effective inhibitor because of the significantly low inhibition constants (high inhibitor-enzyme affinity; Kic = 48.80 ± 14.50 μm, Kiu = 37.48 ± 5.94 μm; Table V) as compared with the Km value (148.06 ± 14.04 μm; Table III) for Ptr4CL5 conversion of 4-coumaric acid.
Figure 4.

Inhibition of Ptr4CL5-catalyzed 4-coumaric acid CoA ligation by caffeic acid. A, The double reciprocal plot shows that the mode of inhibition is mixed competitive and uncompetitive. Error bars represent the se of three technical replicates. B, 1/V′max against inhibitor concentration is used to derive the Kiu (Eq. 5). C, K′m/V′max against [caffeic acid] is used to derive Kic (Eq. 5).
4-Coumaric acid conversion was also inhibited by ferulic and sinapic acids, both following mixed competitive and uncompetitive inhibition (Table V; Supplemental Fig. S4, B and D). However, both ferulic and sinapic acids are not important inhibitors of Ptr4CL5-catalyzed 4-coumaric acid conversion, because the inhibition constants are much higher than the Km value (Table V).
Inhibition of Ptr4CL5 CoA Ligation of Caffeic Acid
4-Coumaric, ferulic, 5-hydroxyferulic, and sinapic acids can inhibit Ptr4CL5 CoA ligation of caffeic acid, following a mixed mode of competitive and uncompetitive inhibition (Table V; Supplemental Fig. S4, E–H). Kic and Kiu values for each inhibitor-mediated inhibition are greater than the Km (43.51 ± 5.43 μm; Table III) for Ptr4CL5 CoA ligation of caffeic acid, indicating that 4-coumaric, ferulic, 5-hydroxyferulic, and sinapic acids have insignificant inhibitory effects.
Inhibition of Ptr4CL5 CoA Ligation of Ferulic Acid
CoA ligation of ferulic acid by Ptr4CL5 can be inhibited by 4-coumaric acid, following predominantly competitive inhibition (Supplemental Fig. S4I). The inhibition can be highly effective because the Kic value (27.9 ± 3.7 μm; Table V) is considerably lower than the Km value (133.51 ± 7.02 μm; Table III). The ligation can also be effectively inhibited by caffeic acid through mixed competitive and uncompetitive inhibition (Kic = 18.47 ± 0.59 μm, Kiu = 14.98 ± 0.67 μm; Table V; Supplemental Fig. S4J). 5-Hydroxyferulic acid is also a mixed-type inhibitor of ferulic acid CoA ligation (Table V; Supplemental Fig. S4K), whereas sinapic acid is an inconsequential inhibitor of such ligation (Table V; Supplemental Fig. S4L).
Ptr4CL5-catalyzed CoA ligation can be inhibited by a mixed mode of competitive and uncompetitive inhibition (Table V), resulting in increased Km and decreased Vmax (Fig. 4; Supplemental Fig. S4). This mixed-mode inhibition strongly suggests that Ptr4CL5 is an allosteric or regulatory enzyme. Allosteric or regulatory proteins have a regulatory site separate from the active site for substrate conversion. An inhibitor can bind to the regulatory site, causing a structural alteration in the enzyme that decreases the affinity (increased apparent Km) of the substrate for the active site and thus reduces the rate of reaction (decreased Vmax).
Caffeic Acid Also Imparts Substrate Self-Inhibition of Ptr4CL5 at High Concentrations
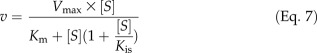
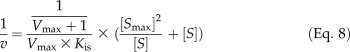
Ptr4CL3 reactions with all the tested substrates of a wide range of concentrations (from approximately 0.2-fold to approximately 5-fold Km) followed Michaelis-Menten kinetics, for which the reaction rate approached substrate independence at high substrate concentrations (Fig. 5A). However, the rates of Ptr4CL5 reactions with caffeic acid reached an apparent maximum and then declined as substrate concentration increased, suggesting substrate self-inhibition (Fig. 5B). Such inhibition is analogous to pure uncompetitive inhibition (Eq. 7; see “Materials and Methods”), where additional caffeic acid molecules bind to the Ptr4CL5-caffeic acid complex, forming a new and inactive complex. Based on Equation 7, a plot of v against log[S] for Ptr4CL5-catalyzed conversion of caffeic acid conformed to a parabolic curve (Fig. 5C) typical of substrate self-inhibition, reaching a maximum rate at the substrate concentration (Smax) of 57.0 ± 11.0 μm. This substrate self-inhibition was further verified by the linear relationship in a plot of 1/v against (([Smax]2/[S])+[S]; Eq. 8; Fig. 5D), giving a substrate self-inhibition constant (Kis) of 55.97 ± 6.05 μm (Table V). Of the five hydroxycinnamic acids tested, only caffeic acid is able to cause significant substrate self-inhibition of Ptr4CL5. The presence of a separate regulatory site and substrate self-inhibition indicates that interactions between Ptr4CL5 and caffeic acid play key roles in regulating CoA ligation flux for monolignol biosynthesis. To understand more about this potential metabolite feedback control in vivo, we quantified the abundance of hydroxycinnamic acids in P. trichocarpa SDX.
Figure 5.

Caffeic acid causes substrate self-inhibition of Ptr4CL5. A, Self-inhibition was not observed for Ptr4CL3 with increasing concentration of caffeic acid. B, Caffeic acid substrate self-inhibition of Ptr4CL5 when substrate concentration exceeds 55 µm. C, Secondary polynomial curve derived from the self-inhibition of Ptr4CL5 with caffeic as the substrate. D, The plot used to derive the Kis (Eq. 8). Error bars represent the se of three technical replicates.
Caffeic Acid Is the Predominant Monolignol Hydroxycinnamic Acid in P. trichocarpa SDX Extracts
We used stable isotope dilution-based LC-MS/MS coupled with selected reaction monitoring (SRM) to determine the absolute quantities of 4-coumaric, caffeic, ferulic, 5-hydroxyferulic, and sinapic acids in SDX extracts of P. trichocarpa. The authentic compounds (natural and stable isotope labeled) were used to identify and quantify these acids in SDX extracts based on their mass fragmentation patterns and HPLC retention times. Caffeic acid is the predominant hydroxycinnamic acid in SDX, with a concentration over 20 times that of 4-coumaric and ferulic acids (Fig. 6). 5-Hydroxyferulic and sinapic acids were not detected, consistent with the kinetic analysis implying that these two acids are insignificant substrates of Ptr4CL3 and Ptr4CL5 reactions (Tables III–V).
Figure 6.

Absolute quantitation of the hydroxycinnamic acids in P. trichocarpa SDX extracts using stable isotope dilution-based LC-MS/MS. Error bars represent the se of 12 replicates (four biological replicates each with three technical replicates).
Based on this metabolite information and comprehensive kinetic data, we simulated the reaction rates of Ptr4CL3 and Ptr4CL5 to predict the CoA ligation flux for monolignol biosynthesis in vivo.
Simulation of Enzyme Reactions Incorporating Specificity/Inhibition Kinetics Provides Predictive Information of CoA Ligation Flux in Vivo
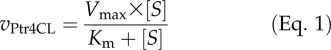
For all simulations and associated experimental validation, we focused on three substrates, 4-coumaric, caffeic, and ferulic acids, the three potential monolignol hydroxycinnamic acids detected in P. trichocarpa SDX. We first simulated the reaction rates of each enzyme with individual substrates (S) using the basic Michaelis-Menten kinetic model (Eq. 1) and enzyme-specific Vmax and Km (Table III).
 |
The model predicted that while 4-coumaric acid is the most preferred Ptr4CL3 substrate over a wide range of substrate concentrations, the substrate specificity of Ptr4CL3 with caffeic and ferulic acids changes at different substrate concentrations (Fig. 7A). CoA ligation fluxes for caffeic and ferulic acids are similar at low substrate concentrations, but ferulic acid conversion is much preferred at high substrate concentrations (Fig. 7A). These results are consistent with a low Km and a low kcat for Ptr4CL3 conversion of caffeic acid, and a high Km and a high kcat are involved in ferulic acid conversion (Table III). For Ptr4CL5 reactions, the model predicted that Ptr4CL5 would convert 4-coumaric, caffeic, and ferulic acids with a similar efficiency over a wide range of substrate concentrations (Fig. 7B). These flux changes are apparent from metabolic simulation but would not be obvious from simple kinetic constants.
Figure 7.

Mathematical simulations for the reaction fluxes of Ptr4CL3 (A) and Ptr4CL5 (B) with individual substrates (4-coumaric, caffeic, or ferulic acid).
These simulations describe the reaction of a specific enzyme with a single substrate that is independent of competing substrates or regulatory effects. The single substrate may exist under unique physiological conditions. Most likely, the coexistence of multiple substrates and inhibitors is a more common case in vivo, consistent with our routine detection of 4-coumaric, caffeic, and ferulic acids in P. trichocarpa SDX extracts (Fig. 6). In in vitro experiments, we further demonstrated that these metabolites can be CoA ligated simultaneously by Ptr4CL3 or Ptr4CL5, and the ligation can also be inhibited by these metabolites (Tables IV and V). We then simulated the net reaction rate of CoA ligation by individual 4CLs with multiple substrates (4-coumaric, caffeic, and ferulic acids), taking into account the inhibitory effects of these metabolites.
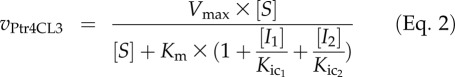
The flux rate equation can be represented by Equation 2 (Chou and Talaly, 1977) for Ptr4CL3 based on basic enzyme reaction principles used in developing Michaelis-Menten kinetics (for derivation, see Supplemental Data Set S1). Because the Ptr4CL3-catalyzed CoA ligation of any one of the three acids is always inhibited by the other two through pure-competitive inhibition (Table IV; Supplemental Fig. S3), we incorporated competitive inhibition constants (Kic) in Equation 2 (for details, see Table VI).
Table VI. Details for Equation 2.
| S | I1 | Kic1 | I2 | Kic2 |
|---|---|---|---|---|
| μm | μm | |||
| 4-Coumaric acid | Caffeic acid | 9.22 | Ferulic acid | 55.05 |
| Caffeic acid | 4-Coumaric acid | 43.73 | Ferulic acid | 59.36 |
| Ferulic acid | 4-Coumaric acid | 13.12 | Caffeic acid | 3.15 |
 |
The equation can predict the net rate of Ptr4CL3 conversion of, for example, 4-coumaric acid (S) under the effects of competitive inhibitors, caffeic (I1) and ferulic (I2) acids, with inhibition constants of Kic1 and Kic2, respectively. The set of S, I, and Kic listed in Table VI for 4-coumaric acid was used for the simulation. Likewise, the net rate of Ptr4CL3 conversion of caffeic acid and ferulic acid can be simulated, based on Equation 2, using the corresponding set of S, I, and Kic values listed in Table VI. The results demonstrated that CoA ligation of 4-coumaric acid (Fig. 8A, solid line) and caffeic acid (Fig. 8A, dotted line) are both preferred Ptr4CL3 paths over ferulic acid (Fig. 8A, dashed line). We then conducted experiments to test the predictive power of the simulation. We used Ptr4CL3 recombinant protein to carry out CoA ligation of mixed substrates (at equal concentrations) of 4-coumaric, caffeic, and ferulic acids and estimated the ligation rate of each acid in these mixed substrate reactions. The experimental data (Fig. 8A, black symbols) matched very well with the simulated results (Fig. 8A, lines), suggesting that the multiple substrates in vivo would exhibit combinatorial inhibition characteristics.
Figure 8.

Mathematical simulations and experimental validation of CoA ligation fluxes for Ptr4CL3 (A) and Ptr4CL5 (B) reactions in the presence of a mixture of 4-coumaric, caffeic, and ferulic acids. Error bars represent the se of three technical replicates.
Similarly, we derived the flux rate equation (Eq. 3; for derivation, see Supplemental Data Set S1) to simulate Ptr4CL5 reactions with a mixture of the three acids. In mixed substrate reactions with Ptr4CL5, CoA ligation of one (S) of the acids is always inhibited by the other two acids (inhibitors I1 and I2). Such inhibition is always a mix of competitive and uncompetitive modes (Table V), with distinct inhibition constants (Kiu1 and Kic1 for I1 and Kiu2 and Kic2 for I2). In addition, Ptr4CL5 ligation of caffeic acid can be inhibited by caffeic acid (i.e. substrate self-inhibition [Kis = 55.97 mm]) at high concentrations (Fig. 5; Table V). Therefore, for Ptr4CL5 conversion of caffeic acid, [S]/Kis is integrated in the simulation to include the effect of caffeic acid self-inhibition. No substrate self-inhibition (Kis = ∞) was observed for Ptr4CL5 conversion of the other two acids (for details, see Table VII).
Table VII. Details for Equation 3.
| S | Kis | I1 | Kiu1 | Kic1 | I2 | Kiu2 | Kic2 |
|---|---|---|---|---|---|---|---|
| μm | μm | μm | |||||
| 4-Coumaric acid | –a | Caffeic acid | 49.75 | 7.06 | Ferulic acid | 178.8 | 335.54 |
| Caffeic acid | 55.97 | 4-Coumaric acid | 78.07 | 122.7 | Ferulic acid | 372.06 | 518.93 |
| Ferulic acid | –a | 4-Coumaric acid | –b | 27.92 | Caffeic acid | 14.98 | 18.47 |
No self-inhibition effect. bNo uncompetitive inhibition effect.
 |
The simulation revealed that Pt4CL5 CoA ligation of caffeic acid is the dominant metabolic flux when all substrates are present (Fig. 8B, dotted line). Even though the rate of this ligation decreases at high substrate concentrations (e.g. greater than Kis), the reaction remains much more significant than CoA ligation of 4-coumaric and ferulic acids (Fig. 8B). These conclusions and the associated metabolic flux simulation were validated by experimental measurements (Fig. 8B). The goodness of fit of Equations 2 and 3 with experiments confirms that the resulting metabolic models quantitatively predict the modulation of the flux in the presence of multiple substrates. Ptr4CL3 utilizes both caffeic acid and 4-coumaric acid more efficiently than ferulic acid, whereas Ptr4CL5 efficiently utilizes only caffeic acid for monolignol biosynthesis.
DISCUSSION
We have characterized two 4-coumaric acid:CoA ligases, Ptr4CL3 and Ptr4CL5, which are associated with monolignol biosynthesis during wood formation in P. trichocarpa. The kinetic properties (Table III) and genetic functions of Ptr4CL3 (Schmidt et al., 2009) demonstrate that Ptr4CL3 is an ortholog of Pt4CL1 characterized previously (Hu et al., 1998, 1999; Harding et al., 2002). Orthologs of Ptr4CL3 have been identified and characterized for other Populus spp. (Voelker et al., 2010) and Arabidopsis (Raes et al., 2003; Vanholme et al., 2012) and are the most extensively studied 4CL type associated with monolignol biosynthesis (Shi et al., 2010). Aspen Pt4CL1 has been thought the only monolignol-specific 4CL in Populus spp. (Hu et al., 1998, 1999; Harding et al., 2002). Mutation of individual 4CL member genes in Arabidopsis also verified that one 4CL, At4CL1, is monolignol pathway specific (Vanholme et al., 2012). Ptr4CL5 is a novel monolignol pathway CoA ligase that has not been previously characterized. Partial complementary DNA sequences of putative orthologs of Ptr4CL5 have also been cloned from other Populus spp., such as P. nigra × Populus maximowiczii (GenBank accession no. JX986736) and Populus tremula × Populus alba (Voelker et al., 2010). The results suggest that 4CL3 and 4CL5, which are distinct in biochemical functions, are both needed in tree species for monolignol biosynthesis.
Overall, both Ptr4CL3 and Ptr4CL5 have broad in vitro substrate specificity (Tables I and II) and prefer 4-coumaric, caffeic, and ferulic acids. These hydroxycinnamic acids have been consistently identified in the SDX extracts of P. trichocarpa (Fig. 6). This Ptr4CL3/Ptr4CL5 substrate preference and the presence of these acids in lignifying tissues are evidence that these compounds are important monolignol pathway metabolites.
In Ptr4CL3 reactions with single substrates, 4-coumaric acid is the most effective one (Fig. 7). When these acids are present together, which is likely to be the case in vivo, the Ptr4CL3 CoA ligation of one acid is competitively inhibited by the other two, a mechanism that would involve competition between substrate and inhibitor for the same catalytic site. While all of these three acids are competitive inhibitors of Ptr4CL3, caffeic acid and Ptr4CL3 form the strongest enzyme-inhibitor complex (lowest Kic; Table IV). This strong enzyme-inhibitor affinity would decrease the available active site for CoA ligation of any substrate. As a result, in a mixed substrate environment, the rate of Ptr4CL3 conversion of any one of the three acids (Fig. 8A) is considerably lower than that of the same acid in the single substrate reaction (Fig. 7A). The rate for ferulic acid conversion is drastically inhibited because in this conversion both caffeic and 4-coumaric acids are highly efficient competitive inhibitors (both have very low Kic; Table IV). Therefore, in mixed substrate reactions, 4-coumaric and caffeic acids are both the preferred Ptr4CL3 substrates and the strongest inhibitors impeding Ptr4CL3 from converting other hydroxycinnamic acids. We suggest that CoA ligation of 4-coumaric and caffeic acids are the most effective metabolic fluxes regulated by Ptr4CL3 in vivo.
Ptr4CL5 and Ptr4CL3 are functionally distinct. Ptr4CL5 appears to have broader substrate specificity than Ptr4CL3 (Tables I and II). In single substrate reactions, Ptr4CL5 CoA ligates the three potential monolignol pathway hydroxycinnamic acids with good efficiency (Table III; Fig. 7B), whereas Ptr4CL3 has a preference for 4-coumaric acid (Table III; Fig. 7A). Detailed inhibition kinetic studies suggested that Ptr4CL5 behaves as a regulatory enzyme with a unique regulatory site for effector/inhibitor binding, adversely affecting Ptr4CL5 reactions (causing an increase in Km and a decrease in Vmax). These unique protein properties are important in reactions involving multiple substrates. In mixed substrate reactions, the conversion of 4-coumaric and ferulic acids becomes minor because of the strong mixed-type inhibition effects from the effector or inhibitor, caffeic acid (having low Kic and Kiu values; Table V). When compared with the single substrate reaction, the rate of Ptr4CL5 conversion of caffeic acid in the presence of the other two acid substrates is also drastically decreased. In this case, however, the other two acids are only weak mixed-type inhibitors (having high Kic and Kiu values; Table V), whereas caffeic acid causing a substrate self-inhibition is the main factor for the decreased reaction rate (Figs. 5 and 8B). Substrate self-inhibition is also a type of pure uncompetitive inhibition, where, in this case, an additional molecule of caffeic acid (S) may either bind to the Ptr4CL5-caffeic acid (ES) complex generating an inactive SES complex or to specific sites or pockets as an allosteric inhibitor. For Ptr4CL5, this substrate self-inhibition occurs only at high caffeic acid concentrations. We conclude that CoA ligation of caffeic acid is the most effective metabolic path regulated by Ptr4CL5 in vivo, and regulation can also occur at the metabolite level by caffeic acid.
The presence of two 4CLs, Ptr4CL3 and Ptr4CL5, and their specific biochemical activities point to two major CoA ligation fluxes, one from 4-coumaric acid (metabolite 3; Fig. 1) to 4-coumaroyl CoA ester (8) and the other from caffeic acid (4) to caffeoyl CoA ester (11). These two acid-to-CoA ester fluxes are consistent with our recent discovery of two membrane-protein complex (C4H/C3H)-mediated 3-hydroxylation paths linking 4-coumaric acid (3) to caffeic acid (4) and 4-coumaroyl CoA ester (8) to caffeoyl CoA ester (11; Chen et al., 2011). While these two acid-to-CoA ester fluxes can be established by Ptr4CL3 alone (Table III; Fig. 8A), the Ptr4CL5-mediated flux from caffeic acid (4) to caffeoyl CoA ester (11) may act as a regulatory system to prevent the accumulation of caffeic acid, which is a strong inhibitor that can effectively diminish the two major CoA ligation fluxes (Tables IV and V). Conversely, accumulation of caffeic acid at appropriate levels may also be necessary as a mechanism to moderate or adjust CoA ligation fluxes, an integral part of overall regulation of monolignol biosynthesis. This accumulation of caffeic acid is consistent with the detection of a higher level of caffeic acid than the other hydroxycinnamic acids in lignifying tissue (Fig. 6). Exact mechanisms or systems controlling the abundance of caffeic acid are not clear but merit further studies.
CONCLUSION
Mathematical modeling provides insight into the mechanisms of complex biochemical reactions that modulate pathway flux in vivo. We have developed quantitative models for both Ptr4CL3 and Ptr4CL5, incorporating reaction specificity and inhibition to simulate the flux through the pathway in the presence of mixed substrates that may occur in vivo. The models were then tested by in vitro experiments that incorporated mixed substrate conditions to understand the kinetic behavior of the pathway flux. The models fit the experiment data well, suggesting that our models based on mixed substrate reaction kinetics are adequate for simulating CoA ligation paths and effectively describe and predict the metabolic behavior of these two 4CL enzymes. Basic enzyme kinetic and enzyme inhibition data provide the fundamental basis for constructing mathematical models to quantitatively simulate the metabolic fluxes. But such quantitative metabolic fluxes would not be obvious from simple kinetic constants.
A goal of our project is to obtain in-depth metabolic flux information for each step of monolignol biosynthesis and to combine that information with regulatory control into a comprehensive predictive model. Here, we have provided the first such description for the two 4CL enzymes that carry out CoA ligation for lignin precursor biosynthesis during wood formation in P. trichocarpa.
MATERIALS AND METHODS
Chemical Synthesis of Hydroxycinnamic Acids, Stable Isotope-Labeled Hydroxycinnamic Acids, and CoA Thioesters
Unless otherwise stated, all chemicals were purchased from Sigma-Aldrich, including 4-coumaric, caffeic, ferulic, and sinapic acids. 5-Hydroxyferulic acid was synthesized by condensing malonic acid with the corresponding aldehyde (Osakabe et al., 1999). Briefly, 75 mg of malonic acid was mixed with 50 mg of 3,4-dihydroxy-5-methoxybenzaldehyde in 1 mL of pyridine containing 5 μL of piperidine and was allowed to react for 1 week at room temperature. Likewise, 4-[U-ring-13C6,β,γ-13C2]coumaric acid (4-[13C8]coumaric acid) and [U-ring-13C6,β,γ-13C2]ferulic acid were synthesized by mixing 50 mg of [13C3]malonic acid each with 75 mg of 4-[U-ring-13C6]hydroxybenzaldehyde and 75 mg of 4-[U-ring-13C6]hydroxy-3-methoxybenzaldehyde (Cambridge Isotope Laboratories), respectively. [β,γ-13C2]Caffeic acid ([13C2]caffeic acid), [β,γ-13C2]5-hydroxyferulic acid ([13C2]5-hydroxyferulic acid), and [β,γ-13C2]sinapic acid ([13C2]sinapic acid) were synthesized by mixing 50 mg of [13C3]malonic acid each with 100 mg of the corresponding unlabeled hydroxybenzaldehydes, respectively. Following each reaction, the mixture was acidified with 5 n HCl, extracted with ethyl acetate, and purified over a silica column. This process resulted in 51.0 mg of 5-hydroxyferulic acid (54% yield), 57.3 mg of 4-[13C8]coumaric acid (85% yield), 53.5 mg of [13C2]caffeic acid (63% yield), 53.8 mg of [13C2]ferulic acid (84.0% yield), 66.6 mg of [13C2]5-hydroxyferulic acid (67.0% yield), and 74.2 mg of [13C2]sinapic acid (70.0% yield).
4-Coumaroyl-CoA, caffeoyl-CoA, and feruloyl-CoA were synthesized enzymatically from the corresponding hydroxycinnamic acids using purified recombinant Ptr4CL3 produced from Escherichia coli. Briefly, 6 mg of the appropriate hydroxycinnamic acid, 4 mg of CoA, and 14 mg of ATP were dissolved in a total volume of 40 mL of 50 mm Tris-HCl (pH 7.5) buffer containing 2.5 mm MgCl2. The purified protein (0.3 mg) was added to the mixture to start the reaction, and after 30 min at 37°C, 1.6 g of ammonium acetate was added to stop the reaction. The resulting mixture was purified using an SPE cartridge (Chromabond C18 ec; Macherey-Nagel). The synthesis afforded 1.7 mg of 4-coumaroyl-CoA (36% yield), 2.3 mg of caffeoyl-CoA (48% yield), and 1.5 mg of feruloyl-CoA (30% yield).
The purity and identity of all synthesized products were confirmed by MS. Product ion spectra were acquired directly for the [M+H+]+ molecular ion of each compound on a TSQ Quantum Triple Quadrupole mass spectrometer (Thermo Scientific). A collision energy of 10 eV and 1.5 mTorr of argon were used in acquiring all spectra, except for the acyl-CoA derivatives, which utilized a collision energy of 30 eV. 5-Hydroxyferulic acid: MS mass-to-charge ratio (m/z; %) 211 ([M+H+]+, 15), 193 (100), 169 (1), 160 (18), 133 (8). 4-[13C8]coumaric acid: MS m/z (%) 173([M+H+]+, 85), 155 (100), 129 (2), 126 (12), 97 (4). [13C2]Caffeic acid: MS m/z (%) 183 ([M+H+]+, 16), 165 (100), 147 (6), 136 (2), 119 (1), 118 (1), 90 (1). [13C8]Ferulic acid: MS m/z (%) 203 ([M+H+]+, 41), 185 (100), 159 (1), 156 (1), 153 (17), 124 (3), 95 (1). [13C2]5-Hydroxyferulic acid: MS m/z (%) 213 ([M+H+]+, 11), 195 (100), 169 (1), 163 (16), 135 (7). [13C2]Sinapic acid: MS m/z (%) 227([M+H+]+, 13), 209 (100), 194 (2), 177 (13), 149 (2), 120 (2). 4-Coumaroyl-CoA: MS m/z (%) 914 ([M+H+]+, 6), 428 (37), 410 (4), 407 (100), 341 (4), 330 (3), 305 (21), 261 (19), 147 (8). Caffeoyl-CoA: MS m/z (%) 930 ([M+H+]+, 5), 768 (5), 428 (37), 423 (100), 410 (3), 359 (3), 341 (8), 321 (17), 261 (19), 163 (4). Feruloyl-CoA: MS m/z (%) 944 ([M+H+]+, 5), 768 (4), 535 (3), 437 (100), 428 (39), 410 (4), 341 (5), 335 (20), 330 (3), 261 (20), 177 (14).
Extraction of Metabolites from SDX Tissue
Populus trichocarpa SDX was ground in liquid nitrogen using a mortar and pestle. The powdered xylem (50 mg) was immediately transferred into a prechilled, 2-mL centrifuge tube, and 1 mL of water (preheated to 60°C) was added to the tube along with the 13C-labeled internal standards: 4-[13C8]coumaric acid (0.8 nmol), [13C2]caffeic acid (4 nmol), [U-ring-13C6,β,γ-13C2]ferulic acid (0.8 nmol), [13C2]5-hydroxyferulic acid (10 nmol), and [13C2]sinapic acid (4 nmol). The mixture was vortexed for 3 min, heated at 60°C for 10 min, and then centrifuged at 10,000g for 3 min at room temperature. The aqueous supernatant (1 mL) was separated and freeze dried. The resulting residue was resuspended in 0.5 mL of methanol (preheated to 60°C) and again vortexed for 3 min, incubated at 60°C for 10 min, and centrifuged for 3 min at 10,000g and room temperature. The organic layer was transferred to a new tube and evaporated under vacuum. The dry aqueous and dry organic fractions were stored at −80°C until use.
LC-SRM MS Analysis of SDX Metabolite Extracts
The dry aqueous fraction of each extract was resuspended in 150 mL of 50 mm ammonium acetate (pH 4.6), while the dry organic fraction was resuspended in 50 mL of methanol. After allowing both to redissolve for 10 min at room temperature with periodic vortexing, the aqueous and organic fractions from each extract were combined 3:1 (v/v). To remove debris and high-Mr contaminants, the combined solution was passed through a prerinsed Amicon Ultra-0.5 mL Mr cutoff filter (10 kD; Millipore) by centrifugation for 15 min at 14,000g and room temperature. Using a nano-liquid chromatography system equipped with an AS1 autosampler (Eksigent), 10 mL of the filtered sample was loaded onto a 0.5- × 150-mm Zorbax Eclipse XDB-C18 column (Agilent) at 12 mL min−1 in 10% mobile phase B for 3 min, where mobile phases A and B were water with 0.1% formic acid (v/v) and acetonitrile, respectively. Subsequently, the extracted compounds were eluted at 12 mL min−1 by ramping the gradient to 22% mobile phase B over 16 min and, subsequently, to 36% over 6 min. Eluted compounds were ionized using an electrospray ionization spray potential of 3.5 kV, sheath gas pressure of 15 units, and skimmer offset of 8 V, after which they were detected using a TSQ triple-stage quadrupole mass spectrometer (Thermo-Fisher Scientific) operated in SRM mode. Three SRM transitions specific to each native and 13C-labeled acid were monitored (Supplemental Table S1), which were determined empirically using the authentic standards. Instrument parameters utilized during SRM analysis included full width at half maximum of 0.7 for both Q1 and Q3, scan width of 0.5 m/z, scan time of 0.030 s, collision pressure of 1.5 mTorr of argon, and chrom filter peak width of 45-s peak detection, and integration was performed using the Quan Browser for Xcalibur 2.2 SP1.48. Quantities for the endogenous metabolites were interpolated based on the peak areas measured for each native species relative to its corresponding 13C-labeled internal standard.
Expression and Purification of Recombinant Proteins
Sequences for the candidate Ptr4CL genes (Ptr4CL3, GenBank accession no. EU603298; Ptr4CL5, EU603299; Ptr4CL17, EU603300) were cloned previously (Shi et al., 2010). Ptr4CL3, Ptr4CL5, and Ptr4CL17 coding regions were cloned into pET101 protein expression vectors (Invitrogen) and, following their expression in E. coli, were purified using a C-terminal 6×His tag as described previously (Shuford et al., 2012a). Likewise, Ptr4CL3 and Ptr4CL5 were also cloned into the pET100 protein expression vector for specific removal of the His tag from Ptr4CL3 and Ptr4CL5 using EnteroKinase Max (Invitrogen) following their expression and purification. Briefly, 20 µg of the purified enzyme was added to the reaction solution (4 µL of EnteroKinase Max and 3 µL of 10× EnteroKinase Max buffer, diluted to 30 µL with water), and the cleavage was carried out for 10 h at 4°C. Complete removal of the His tag was confirmed by western blotting using an anti-His monoclonal antibody (Promega).
Crude Protein Extraction from SDX Tissue
Total (crude) proteins were extracted from P. trichocarpa SDX according to Chen et al. (2011) and used to test the enzyme activity and for LC-MS/MS analysis of phosphoproteins.
Ptr4CL Immunoprecipitation and Western-Blot Analysis
Ptr4CL3 and Ptr4CL5 immunoprecipitation was adapted from our previous report (Chen et al., 2011). Rabbit anti-aspen (Populus tremuloides) 4CL1 antibodies (Li et al., 2003) were used to pull down Ptr4CL3 and Ptr4CL5 from SDX crude protein extracts. Briefly, 1 mL of SDX protein extract containing 1% Triton X-100 was mixed on a shaker with 30 µL of anti-Pt4CL1 antibody preparation and 30 µL of Dynabeads Protein G (Invitrogen) for 2 h at 4°C. Next, the beads were washed three times with 1 mL of protein extraction buffer (Chen et al., 2011). Bound Ptr4CL3 and Ptr4CL5 were eluted by boiling the beads for 10 min in 30 µL of 2× SDS sample buffer (Sambrook et al., 1989). The eluted proteins were separated by SDS-PAGE and transferred to a nitrocellulose membrane for western-blot analysis, as described previously (Chen et al., 2011), using the anti-Pt4CL1 antibody or rabbit phospho-specific antibodies (Invitrogen) to detect Ptr4CL3 and Ptr4CL5.
Sample Preparation for Phosphopeptide Enrichment for LC-MS/MS Analysis
The phosphopeptide enrichment using immobilized metal ion affinity chromatography was carried out as described previously (Chien et al., 2011). An aliquot of 400 µL of nitrilotriacetic acid agarose resin (Qiagen) was transferred into a 1.5-mL microcentrifuge tube, and the resin was spun down. The supernatant was removed, and two 1-mL water washes were performed before 1 mL of 100 mm FeCl3 solution in 1% acetic acid was added and incubated in the dark for 4 h under constant rotation to charge the resin.
Two MOC StageTips were prepared with 100 µL of iron-nitrilotriacetic acid agarose resin loaded on top of 200-µL pipette tips (Eppendorf) plugged with ultra-high molecular weight polyethylene sheet disks (7-µm pore size and 0.025-inch thickness; Porex) to hold the resin. The resin was washed twice with 100 µL of 2% acetic acid solution by applying pressure to the tip with a syringe.
One milligram of total proteins from P. trichocarpa SDX was digested on four filter-aided sample preparation filters following Gokce et al. (2012). Peptides were pooled and acidified with glacial acetic acid (Fisher Scientific) and split again to be loaded onto the StageTips. The flow through was collected and reloaded. Two washes with 100 µL of 2% acetic acid were performed and collected with the second flow through (approximately 300 µL total). Two 100-µL water:acetonitrile:acetic acid (74:25:1, v/v/v) washes were performed and discarded. Two 100-µL washes with water were collected together with two 100-µL elutions of 5% NH4OH. The flow throughs were combined, and an aliquot was diluted with mobile phase A (water:acetonitrile:formic acid, 74:25:0.1, v/v/v) to a final concentration of 0.1 mg mL−1. The phosphopeptide-enriched elutions from both StageTips were combined, dried down, and reconstituted in 30 µL of mobile phase A.
Nano-LC-MS/MS Analysis of Phosphopeptides
LC was performed on a cHiPLCnanoflex system (Eksigent) equipped with a 5-cm trap column (200 µm × 0.5 mm packed with Chrom XP C18-CL, 3 µm, 120 Å), a 15-cm analytical column (75 µm × 15 cm) packed with the same packing material, and a 20-μm i.d. SilicaTip ESI emitter (New Objective). A 60-min gradient was applied, and data were acquired on a Q-exactive mass spectrometer (Thermo Scientific). Instrument parameters were 70,000 resolving power for MS scans and 17,500 resolving power for MS/MS scans. The top-12 consecutive MS/MS results were allowed, but 1+ charge states were excluded from fragmentation. The automatic gain control limit for MS/MS scans was 2E4 ions, and the maximum ion injection time was 120 ms. The underfill ratio for MS/MS isolation was 1%, and the normalized collision energy was set to 27%. For MS scans, the automatic gain control limit was 1E6 ions, and the maximum ion injection time was 60 ms. The capillary temperature was set to 275°C, and 55 V was applied to the S-lens. A 30-s dynamic exclusion time was applied, and the lock-mass function was enabled. Duplicate analyses were performed for 10-µL injections of the flow through and phosphopeptide-enriched samples.
Data Analysis and Peptide Identification
Raw files were converted to a Mascot generic file (Mgf) utilizing the Mass Matrix file conversion tool version 3.9 (downloaded from http://www.massmatrix.net). Mgf files were further searched in Mascot version 2.3.2 (Matrix Science) against the target reverse P. trichocarpa_JGI_v2.2 database with a MS tolerance of 5 ppm and a MS/MS tolerance of 0.02 D. Search parameters included a maximum of two missed cleavages, fixed modification of carbamidomethylation of Cys residues, and variable modifications were oxidation of Met, deamidation of Asn and Gln, and phosphorylation of Ser, Thr, and Tyr. Resulting dat files were filtered at a 1% false discovery rate in ProteoIQ version 2.3.02 (BioInquire).
Enzyme Reaction Conditions and HPLC Analysis
The 4CL activity assay was conducted using 20 µg of crude SDX protein in 100 µL of assay buffer containing 100 mm Tris-HCl (pH 7.5), 5 mm ATP, 2.5 mm MgCl2, and 200 µM CoA. After preheating the mixture at 40°C for 3 min, the substrate (4-coumaric, caffeic, ferulic, 5-hydroxyferulic, or sinapic acid) was added to a final concentration of 50 µm to start the reaction. The reaction was maintained at 40°C for 1 h and then terminated by adding 5 µL of 3 m TCA to the mixture. Afterward, the reaction mixture was centrifuged for 20 min at 20,000g to condense the enzyme, and 40 µL of supernatant was injected onto a 4.6- × 150-mm Zorbax SB-C18 column (Agilent) for HPLC analysis. Conditions for HPLC analysis, including compound identification, were as described previously (Liu et al., 2012).
Optimal reaction conditions for Ptr4CL3 and Ptr4CL5 were determined using the purified recombinant proteins. Optimal activity for both Ptr4CL3 and Ptr4CL5 was obtained at a reaction temperature of 40°C when using the metal ion, Mg2+, and individually, at pH 8 and pH 7, respectively. Enzyme kinetic and inhibition studies for the recombinant enzymes were carried out under identical conditions to the crude SDX protein 4CL activity assay; however, the recombinant enzyme assays were conducted using an assay volume of 50 µL with a final enzyme concentration of 40 nm, a reaction time of only 12 min, and the assays were carried out under pH 8 for Ptr4CL3 and pH 7 for Ptr4CL5. Substrate concentrations ranging from 5 to 500 µm were utilized to determine the Km and Vmax values for each substrate, while inhibitor concentrations of 10, 20, 40, and 80 µm were employed for inhibition studies.
Ptr4CL Enzyme Kinetic Parameter Determination
Ptr4CL enzyme kinetic parameters (Km and kcat) followed the Michaelis-Menten equation and were determined using Lineweaver-Burk (double reciprocal) plots. Six different substrate concentrations (5–500 µm) were used to determine the Km and kcat values for each substrate.
Ptr4CL Enzyme Inhibition Studies
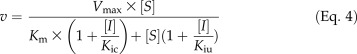
Four concentrations of hydroxycinnamic acid inhibitors (10, 20, 40, and 80 µm) were tested at six to eight concentrations of substrate to determine the modes of inhibition. Data were first analyzed by Lineweaver-Burk (double reciprocal) plots for modes of inhibition. Common diagnostic patterns for the inhibited enzyme include an increased Km value (competitive inhibition), a decreased Vmax value (noncompetitive inhibition), proportionally decreased Km and Vmax values (uncompetitive inhibition), or some combination of these changes (mixed inhibition). Equation 4, derived from the Michaelis-Menten equation, describes such a mixed inhibition mechanism, where the reaction velocity (v) is a function of substrate (S) and inhibitor (I) concentrations. Kic is the competitive inhibition constant and the dissociation constant of the enzyme-competitive inhibitor complex. Kiu is the uncompetitive inhibition constant and the dissociation constant of the enzyme-uncompetitive inhibitor complex. The resulting double reciprocal plots were used to obtain K′m and V′max, the altered Km and Vmax of the inhibited enzyme. Inhibition plots of K′m/V′max against I and 1/V′max against I were used to obtain Kic and Kiu (Eq. 5), respectively. Pure-competitive inhibition is a special case where Kiu approaches infinity (i.e. negligible affinity in an uncompetitive enzyme-inhibitor complex; [I]/Kiu in Eq. 5 is negligible), as would be revealed by the 1/V′max against I plot. Pure-uncompetitive inhibition is a special case where Kic approaches infinity. When Kic = Kiu, the inhibition is pure noncompetitive. In mixed inhibition, Kic < Kiu specifies that competitive inhibition predominates, whereas Kiu < Kic indicates predominant uncompetitive inhibition.
Because either mixed competitive and uncompetitive or mixed competitive and noncompetitive inhibition would result in an increased Km and decreased Vmax, changes in Km and Vmax values were analyzed as a function of inhibitor concentrations according to both Equations 4 and 6 to discern the underlying inhibition mode. Equation 6 (derived from the Michaelis-Menten equation) describes a mixed competitive and noncompetitive inhibition mechanism, where Kin is the noncompetitive inhibition constant. If the inhibition plot of K′m/V′max against I fits a second degree polynomial, hence adhering to Equation 6, it would specify mixed competitive and noncompetitive inhibition, whereas the plot yielding a straight line, hence adhering to Equation 4, would indicate a mode of mixed competitive and uncompetitive inhibition.
Substrate Self-Inhibition Studies
Substrate self-inhibition is analogous to pure uncompetitive inhibition, where a substrate molecule binds to the enzyme-substrate complex to form an inactive substrate-enzyme-substrate complex. In this case, the reaction rate obeys Equation 7, derived from Equation 4, in which [I]/Kic can be ignored, since Kic approaches infinity, and I is substituted by [S] and Kiu by Kis, the dissociation constant of the substrate-enzyme-substrate complex. Typically, the rate of a substrate self-inhibition reaction would follow the Michaelis-Menten model at low substrate concentrations, reach a maximum value at a specific substrate level ([Smax]), and then decline and approach zero as substrate concentration increases. This maximum rate can then be estimated by dv/dS = 0, where [Smax] can also be determined, or derived as [Smax]2 = KmKis, according to Equation 7. More precisely, the maximum rate and [Smax] can be obtained based on a diagnostic parabolic curve from a plot of v against log[S]. [Smax] can then be used to obtain Kis in a plot of 1/v against (([Smax]2/[S]) + [S]), according to Equation 8, which is derived from Equation 7, where Km is substituted by [Smax]2/Kis (based on [Smax]2 = KmKis). Therefore, the rate data in “Ptr4CL Enzyme Kinetic Parameter Determination” above for the enzyme-substrate pairs that do not fit with the Michaelis-Menten correlation for v and [S] were further analyzed by a plot of v against log[S] to verify substrate inhibition, followed by a plot of 1/v against (([Smax]2/[S]) + [S]) to calculate Kis.
 |
 |
 |
 |
 |
Sequence data from this article can be found in the GenBank/EMBL data libraries under accession numbers Ptr4CL3 (EU603298), Ptr4CL5 (EU603299), and Ptr4CL17 (EU603300).
Supplemental Data
The following materials are available in the online version of this article.
Supplemental Figure S1. Temperature, pH, and cation dependency of recombinant Ptr4CL3 and Ptr4CL5 reactions.
Supplemental Figure S2. The substrate specificities of Ptr4CL3 and Ptr4CL5 are not affected by His tagging.
Supplemental Figure S3. Ptr4CL3 inhibition kinetics.
Supplemental Figure S4. Ptr4CL5 inhibition kinetics.
Supplemental Table S1. SRM transitions for hydroxycinnamic acids.
Supplemental Data Set S1. Deriving equations to compute the reaction rates for Ptr4CL3 and Ptr4CL5 in the presence of multiple substrates.
Acknowledgments
We thank Ms. Laura Edwards and Prof. Michael B. Goshe in the Department of Biochemistry at North Carolina State University for their advice regarding phosphopeptide enrichment.
Glossary
- SDX
stem-differentiating xylem
- LC
liquid chromatography
- MS/MS
tandem mass spectrometry
- MS
mass spectrometry
- SRM
selected reaction monitoring
- 4-[13C8]coumaric acid
4-[U-ring-13C6,β,γ-13C2]coumaric acid
- [13C2]caffeic acid
[β,γ-13C2]caffeic acid
- [13C2]5-hydroxyferulic acid
[β,γ-13C2]5-hydroxyferulic acid
- [13C2]sinapic acid
[β,γ-13C2]sinapic acid
- m/z
mass-to-charge ratio
- Kic
competitive inhibition constant
- Kiu
uncompetitive inhibition constant
- Kis
substrate self-inhibition constant
- Kcat
turnover number
References
- Albert R. (2007) Network inference, analysis, and modeling in systems biology. Plant Cell 19: 3327–3338 [DOI] [PMC free article] [PubMed] [Google Scholar]
- Blount JW, Korth KL, Masoud SA, Rasmussen S, Lamb C, Dixon RA. (2000) Altering expression of cinnamic acid 4-hydroxylase in transgenic plants provides evidence for a feedback loop at the entry point into the phenylpropanoid pathway. Plant Physiol 122: 107–116 [DOI] [PMC free article] [PubMed] [Google Scholar]
- Bolwell G, Cramer C, Lamb C, Schuch W, Dixon R. (1986) L-Phenylalanine ammonia-lyase from Phaseolus vulgaris: modulation of the levels of active enzyme by trans-cinnamic acid. Planta 169: 97–107 [DOI] [PubMed] [Google Scholar]
- Brown S, Neish A. (1959) Studies of lignin biosynthesis using isotopic carbon. VIII. Isolation of radioactive hydrogenolysis products of lignin1. J Am Chem Soc 81: 2419–2424 [Google Scholar]
- Brown SA. (1961) Chemistry of lignification: biochemical research on lignins is yielding clues to the structure and formation of these complex polymers. Science 134: 305–313 [DOI] [PubMed] [Google Scholar]
- Brown SA, Neish AC. (1955) Shikimic acid as a precursor in lignin biosynthesis. Nature 175: 688–689 [DOI] [PubMed] [Google Scholar]
- Brown SA, Neish AC. (1956) Studies of lignin biosynthesis using isotopic carbon. V. Comparative studies on different plant species. Can J Biochem Physiol 34: 769–778 [PubMed] [Google Scholar]
- Chen F, Dixon RA. (2007) Lignin modification improves fermentable sugar yields for biofuel production. Nat Biotechnol 25: 759–761 [DOI] [PubMed] [Google Scholar]
- Chen HC, Li Q, Shuford CM, Liu J, Muddiman DC, Sederoff RR, Chiang VL. (2011) Membrane protein complexes catalyze both 4- and 3-hydroxylation of cinnamic acid derivatives in monolignol biosynthesis. Proc Natl Acad Sci USA 108: 21253–21258 [DOI] [PMC free article] [PubMed] [Google Scholar]
- Chiang VL. (2002) From rags to riches. Nat Biotechnol 20: 557–558 [DOI] [PubMed] [Google Scholar]
- Chien KY, Liu HC, Goshe MB. (2011) Development and application of a phosphoproteomic method using electrostatic repulsion-hydrophilic interaction chromatography (ERLIC), IMAC, and LC-MS/MS analysis to study Marek’s disease virus infection. J Proteome Res 10: 4041–4053 [DOI] [PubMed] [Google Scholar]
- Chou TC, Talaly P. (1977) A simple generalized equation for the analysis of multiple inhibitions of Michaelis-Menten kinetic systems. J Biol Chem 252: 6438–6442 [PubMed] [Google Scholar]
- Ehlting J, Büttner D, Wang Q, Douglas CJ, Somssich IE, Kombrink E. (1999) Three 4-coumarate:coenzyme A ligases in Arabidopsis thaliana represent two evolutionarily divergent classes in angiosperms. Plant J 19: 9–20 [DOI] [PubMed] [Google Scholar]
- Gokce E, Franck WL, Oh Y, Dean RA, Muddiman DC. (2012) In-depth analysis of the Magnaporthe oryzae conidial proteome. J Proteome Res 11: 5827–5835 [DOI] [PMC free article] [PubMed] [Google Scholar]
- Gui J, Shen J, Li L. (2011) Functional characterization of evolutionarily divergent 4-coumarate:coenzyme A ligases in rice. Plant Physiol 157: 574–586 [DOI] [PMC free article] [PubMed] [Google Scholar]
- Harada H, Cote WAJ (1985) Structure of wood. In T Higuchi, ed, Biosynthesis and Biodegradation of Wood Components. Academic Press, Orlando, FL, pp 1–42 [Google Scholar]
- Harakava R. (2005) Genes encoding enzymes of the lignin biosynthesis pathway in eucalyptus. Genet Mol Biol 28: 601–607 [Google Scholar]
- Harding SA, Leshkevich J, Chiang VL, Tsai CJ. (2002) Differential substrate inhibition couples kinetically distinct 4-coumarate:coenzyme A ligases with spatially distinct metabolic roles in quaking aspen. Plant Physiol 128: 428–438 [DOI] [PMC free article] [PubMed] [Google Scholar]
- Higuchi T (1997) Biochemistry and Molecular Biology of Wood. Springer, New York, pp 131–181 [Google Scholar]
- Higuchi T. (2003) Pathways for monolignol biosynthesis via metabolic grids: coniferyl aldehyde 5-hydroxylase, a possible key enzyme in angiosperm syringyl lignin biosynthesis. Proc Jpn Acad Ser B Phys Biol Sci 79: 227–236 [Google Scholar]
- Higuchi T, Brown SA. (1963a) Studies of lignin biosynthesis using isotopic carbon. XII. The biosynthesis and metabolism of spinapic acid. Can J Biochem Physiol 41: 613–620 [PubMed] [Google Scholar]
- Higuchi T, Brown SA. (1963b) Studies of lignin biosynthesis using isotopic carbon. XIII. The phenylpropanoid system in lignification. Can J Biochem Physiol 41: 621–628 [PubMed] [Google Scholar]
- Hu WJ, Harding SA, Lung J, Popko JL, Ralph J, Stokke DD, Tsai CJ, Chiang VL. (1999) Repression of lignin biosynthesis promotes cellulose accumulation and growth in transgenic trees. Nat Biotechnol 17: 808–812 [DOI] [PubMed] [Google Scholar]
- Hu WJ, Kawaoka A, Tsai CJ, Lung J, Osakabe K, Ebinuma H, Chiang VL. (1998) Compartmentalized expression of two structurally and functionally distinct 4-coumarate:CoA ligase genes in aspen (Populus tremuloides). Proc Natl Acad Sci USA 95: 5407–5412 [DOI] [PMC free article] [PubMed] [Google Scholar]
- Hu Y, Gai Y, Yin L, Wang X, Feng C, Feng L, Li D, Jiang XN, Wang DC. (2010) Crystal structures of a Populus tomentosa 4-coumarate:CoA ligase shed light on its enzymatic mechanisms. Plant Cell 22: 3093–3104 [DOI] [PMC free article] [PubMed] [Google Scholar]
- Kajita S, Katayama Y, Omori S. (1996) Alterations in the biosynthesis of lignin in transgenic plants with chimeric genes for 4-coumarate:coenzyme A ligase. Plant Cell Physiol 37: 957–965 [DOI] [PubMed] [Google Scholar]
- Kitano H. (2002) Computational systems biology. Nature 420: 206–210 [DOI] [PubMed] [Google Scholar]
- Knobloch KH, Hahlbrock K. (1975) Isoenzymes of p-coumarate:CoA ligase from cell suspension cultures of Glycine max. Eur J Biochem 52: 311–320 [DOI] [PubMed] [Google Scholar]
- Lee D, Meyer K, Chapple C, Douglas CJ. (1997) Antisense suppression of 4-coumarate:coenzyme A ligase activity in Arabidopsis leads to altered lignin subunit composition. Plant Cell 9: 1985–1998 [DOI] [PMC free article] [PubMed] [Google Scholar]
- Lee Y, Chen F, Gallego-Giraldo L, Dixon RA, Voit EO. (2011) Integrative analysis of transgenic alfalfa (Medicago sativa L.) suggests new metabolic control mechanisms for monolignol biosynthesis. PLoS Comput Biol 7: e1002047. [DOI] [PMC free article] [PubMed] [Google Scholar]
- Li L, Cheng XF, Leshkevich J, Umezawa T, Harding SA, Chiang VL. (2001) The last step of syringyl monolignol biosynthesis in angiosperms is regulated by a novel gene encoding sinapyl alcohol dehydrogenase. Plant Cell 13: 1567–1586 [DOI] [PMC free article] [PubMed] [Google Scholar]
- Li L, Popko JL, Umezawa T, Chiang VL. (2000) 5-Hydroxyconiferyl aldehyde modulates enzymatic methylation for syringyl monolignol formation, a new view of monolignol biosynthesis in angiosperms. J Biol Chem 275: 6537–6545 [DOI] [PubMed] [Google Scholar]
- Li L, Zhou Y, Cheng X, Sun J, Marita JM, Ralph J, Chiang VL. (2003) Combinatorial modification of multiple lignin traits in trees through multigene cotransformation. Proc Natl Acad Sci USA 100: 4939–4944 [DOI] [PMC free article] [PubMed] [Google Scholar]
- Liu CC, Liu CF, Wang HX, Shen ZY, Yang CP, Wei ZG. (2011) Identification and analysis of phosphorylation status of proteins in dormant terminal buds of poplar. BMC Plant Biol 11: 158. [DOI] [PMC free article] [PubMed] [Google Scholar]
- Liu J, Shi R, Li Q, Sederoff RR, Chiang VL. (2012) A standard reaction condition and a single HPLC separation system are sufficient for estimation of monolignol biosynthetic pathway enzyme activities. Planta 236: 879–885 [DOI] [PubMed] [Google Scholar]
- Miller RT. (2005) Phospho-specific antibodies: more valuable than originally thought. Am J Physiol Renal Physiol 289: F247–F248 [DOI] [PubMed] [Google Scholar]
- Osakabe K, Tsao CC, Li L, Popko JL, Umezawa T, Carraway DT, Smeltzer RH, Joshi CP, Chiang VL. (1999) Coniferyl aldehyde 5-hydroxylation and methylation direct syringyl lignin biosynthesis in angiosperms. Proc Natl Acad Sci USA 96: 8955–8960 [DOI] [PMC free article] [PubMed] [Google Scholar]
- Prabakaran S, Everley RA, Landrieu I, Wieruszeski JM, Lippens G, Steen H, Gunawardena J. (2011) Comparative analysis of Erk phosphorylation suggests a mixed strategy for measuring phospho-form distributions. Mol Syst Biol 7: 482. [DOI] [PMC free article] [PubMed] [Google Scholar]
- Raes J, Rohde A, Christensen JH, Van de Peer Y, Boerjan W. (2003) Genome-wide characterization of the lignification toolbox in Arabidopsis. Plant Physiol 133: 1051–1071 [DOI] [PMC free article] [PubMed] [Google Scholar]
- Ralph J, Brunow G, Harris PJ, Dixon RA, Schatz PF, Boerjan W (2008) Lignification: are lignins biosynthesized via simple combinatorial chemistry or via proteinaceous control and template replication? In F Daayf, A El Hadrami, L Adam, GM Ballance, eds, Recent Advances in Polyphenol Research. Wiley-Blackwell, Oxford, pp 36–66 [Google Scholar]
- Saballos A, Sattler SE, Sanchez E, Foster TP, Xin Z, Kang C, Pedersen JF, Vermerris W. (2012) Brown midrib2 (Bmr2) encodes the major 4-coumarate:coenzyme A ligase involved in lignin biosynthesis in sorghum (Sorghum bicolor (L.) Moench). Plant J 70: 818–830 [DOI] [PubMed] [Google Scholar]
- Sambrook J, Fritsch EF, Maniatis T (1989) Molecular Cloning: A Laboratory Manual, Ed 3. Cold Spring Harbor Laboratory Press, Cold Spring Harbor, NY [Google Scholar]
- Sarkanen KV. (1976) Renewable resources for the production of fuels and chemicals. Science 191: 773–776 [DOI] [PubMed] [Google Scholar]
- Sarkanen KV, Ludwig CH (1971) Lignins: Occurrence, Formation, Structure and Reactions. John Wiley & Sons, New York, pp 95–163 [Google Scholar]
- Sato T, Kiuchi F, Sankawa U. (1982) Inhibition of phenylalanine ammonia-lyase by cinnamic acid derivatives and related compounds. Phytochemistry 21: 845–850 [Google Scholar]
- Schallau K, Junker BH. (2010) Simulating plant metabolic pathways with enzyme-kinetic models. Plant Physiol 152: 1763–1771 [DOI] [PMC free article] [PubMed] [Google Scholar]
- Schmidt M, Schwartzberg AM, Perera PN, Weber-Bargioni A, Carroll A, Sarkar P, Bosneaga E, Urban JJ, Song J, Balakshin MY, et al. (2009) Label-free in situ imaging of lignification in the cell wall of low lignin transgenic Populus trichocarpa. Planta 230: 589–597 [DOI] [PMC free article] [PubMed] [Google Scholar]
- Schneider K, Hövel K, Witzel K, Hamberger B, Schomburg D, Kombrink E, Stuible HP. (2003) The substrate specificity-determining amino acid code of 4-coumarate:CoA ligase. Proc Natl Acad Sci USA 100: 8601–8606 [DOI] [PMC free article] [PubMed] [Google Scholar]
- Shi R, Sun YH, Li Q, Heber S, Sederoff R, Chiang VL. (2010) Towards a systems approach for lignin biosynthesis in Populus trichocarpa: transcript abundance and specificity of the monolignol biosynthetic genes. Plant Cell Physiol 51: 144–163 [DOI] [PubMed] [Google Scholar]
- Shuford CM, Li Q, Sun YH, Chen HC, Wang J, Shi R, Sederoff RR, Chiang VL, Muddiman DC. (2012a) Comprehensive quantification of monolignol-pathway enzymes in Populus trichocarpa by protein cleavage isotope dilution mass spectrometry. J Proteome Res 11: 3390–3404 [DOI] [PubMed] [Google Scholar]
- Shuford CM, Sederoff RR, Chiang VL, Muddiman DC. (2012b) Peptide production and decay rates affect the quantitative accuracy of protein cleavage isotope dilution mass spectrometry (PC-IDMS). Mol Cell Proteomics 11: 814–823 [DOI] [PMC free article] [PubMed] [Google Scholar]
- Silber MV, Meimberg H, Ebel J. (2008) Identification of a 4-coumarate:CoA ligase gene family in the moss, Physcomitrella patens. Phytochemistry 69: 2449–2456 [DOI] [PubMed] [Google Scholar]
- Souza CdA, Barbazuk B, Ralph SG, Bohlmann J, Hamberger B, Douglas CJ. (2008) Genome-wide analysis of a land plant-specific acyl:coenzyme A synthetase (ACS) gene family in Arabidopsis, poplar, rice and Physcomitrella. New Phytol 179: 987–1003 [DOI] [PubMed] [Google Scholar]
- Terashima N, Kitano K, Kojima M, Yoshida M, Yamamoto H, Westermark U. (2009) Nanostructural assembly of cellulose, hemicellulose, and lignin in the middle layer of secondary wall of ginkgo tracheid. J Wood Sci 55: 409–416 [Google Scholar]
- Timell TE. (1969) The chemical composition of tension wood. Svensk Papp Tidn 72: 173–181 [Google Scholar]
- Vanholme R, Storme V, Vanholme B, Sundin L, Christensen JH, Goeminne G, Halpin C, Rohde A, Morreel K, Boerjan W. (2012) A systems biology view of responses to lignin biosynthesis perturbations in Arabidopsis. Plant Cell 24: 3506–3529 [DOI] [PMC free article] [PubMed] [Google Scholar]
- Voelker SL, Lachenbruch B, Meinzer FC, Jourdes M, Ki C, Patten AM, Davin LB, Lewis NG, Tuskan GA, Gunter L, et al. (2010) Antisense down-regulation of 4CL expression alters lignification, tree growth, and saccharification potential of field-grown poplar. Plant Physiol 154: 874–886 [DOI] [PMC free article] [PubMed] [Google Scholar]
- Walton E, Butt V. (1970) The activation of cinnamate by an enzyme from leaves of spinach beet (Beta vulgaris L. ssp. vulgaris). J Exp Bot 21: 887–891 [Google Scholar]
- Wang JP, Shuford CM, Li Q, Song J, Lin YC, Sun YH, Chen HC, Williams CM, Muddiman DC, Sederoff RR, et al (2012) Functional redundancy of the two 5-hydroxylases in monolignol biosynthesis of Populus trichocarpa: LC-MS/MS based protein quantification and metabolic flux analysis. Planta 236: 795–808 [DOI] [PubMed] [Google Scholar]