Abstract
Our recently developed ultrasound-switchable fluorescence (USF) imaging technique showed that it was feasible to conduct high-resolution fluorescence imaging in a centimeter-deep turbid medium. Because the spatial resolution of this technique highly depends on the ultrasound-induced temperature focal size (UTFS), minimization of UTFS becomes important for further improving the spatial resolution USF technique. In this study, we found that UTFS can be significantly reduced below the diffraction-limited acoustic intensity focal size via nonlinear acoustic effects and thermal confinement by appropriately controlling ultrasound power and exposure time, which can be potentially used for deep-tissue high-resolution imaging.
In centimeter-deep tissues, the spatial resolution of pure optical imaging techniques is limited to ∼millimeters by tissue light scattering.1 To break this limit, ultrasonic techniques have been incorporated into optical methods, such as photoacoustic tomography (PAT)2 and ultrasound-modulated optical tomography (UOT).3 Significant improvement in spatial resolution (hundreds of microns in centimeter-deep tissues) has been achieved.2 Recently, ultrasound-induced temperature-controlled fluorescence (UTF) imaging techniques have been reported.4, 5, 6 A high-intensity-focused-ultrasound (HIFU) transducer was used to heat temperature-sensitive fluorescent probes only in the HIFU focal volume. This enabled a HIFU-enhanced or -generated fluorescence signal to be detected for optical imaging with acoustic spatial resolution in deep tissues. This is a significant step to achieve deep-tissue high-resolution fluorescence imaging.
However, the spatial resolution of the above mentioned ultrasound-combined optical imaging techniques are essentially limited by acoustic diffraction. Recently, we have proposed and demonstrated a concept of ultrasound-switchable fluorescence (USF) for deep-tissue high-resolution imaging.6, 7 USF has shown a potential to break the acoustic diffraction limit based on a temperature threshold of switching on or off fluorophores (see a brief discussion about the mechanism in the supplemental material).6, 13 While the temperature-threshold based method is promising, the improvement in spatial resolution is relatively limited if used alone.6 Exploring other techniques that can break the acoustic diffraction limit for potentially further improving the spatial resolution of the USF- or UTF-based imaging techniques is highly desired. Because the spatial resolution of the USF- or UTF-based imaging technique is significantly dependent on the ultrasound-induced temperature focal size (UTFS), methods that can reduce UTFS below the acoustic diffraction limited size are highly attractive.
Unfortunately, characterizing and minimizing UTFS are challenging for the following reasons. First, no studies have been conducted to investigate how UTFS is affected by different experimental conditions for imaging purposes when increasing tissue temperature only a few Celsius degrees in a very short period (such as tens or hundreds of milliseconds).5, 6 Instead, almost all current HIFU-related studies are focused on tissue treatment, which requires increasing tissue temperature tens of Celsius degrees within a much longer period (such as from seconds to minutes) to kill diseased cells.8 Therefore, the UTFS is usually large (a few millimeters) due to thermal diffusion, which makes reducing UTFS unnecessary in HIFU treatment experiments. Second, quantifying UTFS in real deep tissues for imaging purposes is challenging for the following reasons. (1) HIFU-induced thermal focus is small for the purpose of high resolution imaging (the smallest one in this study is ∼0.246 mm generated by a 2.5 MHz ultrasound transducer). (2) HIFU-induced temperature increase is rapid to avoid thermal diffusion or conduction (the shortest HIFU exposure time in this study is 50 ms). (3) HIFU-induced temperature increase is only a few Celsius degrees. Thus, temperature-induced imaging contrast is low between the heated and surrounding tissues. Therefore, few techniques are available for this type of study.
In this study, we used a temperature image system based on a fast infrared (IR) camera because of its high spatial and temporal resolutions. Accordingly, we adopted an IR partially transparent phantom to simulate tissues (silicone, see the details in Ref. 6). In real biological tissues, IR camera based system fails because of significant tissue absorption of IR light. An online free HIFU simulator based on Khokhlov–Zabolotskaya–Kuznetsov (KZK) and bioheat transfer (BHT) equations was adopted.9 To retain a large ultrasound penetration depth, we limited the HIFU frequency to a relatively low value of 2.5 MHz. The results show that the UTFS can be significantly reduced below its acoustic diffraction limit by appropriately controlling the HIFU exposure power and exposure time via acoustic nonlinear effect and thermal confinement.
A schematic diagram of the experimental setup is shown Fig. 1a. The first function generator (FG 1, AFG3252, Tektronix, Oregon) provided a burst of sinusoidal waves at 2.5 MHz that was amplified by a radio-frequency power amplifier (RF-PA, 325LA, E&I, New York). The amplified signal was sent to the HIFU transducer (H108, Sonic Concepts Inc, Washington) via a matching network (MNW). The HIFU transducer was submerged into a water bath and focused inside an IR partially transparent silicone phantom (VST-50, Factor II, Arizona). While the FG 1 sent the driving signal to the HIFU transducer, it also triggered the second function generator (FG 2, Agilent 33220 A, California) so that the FG 2 provided pulses to trigger the IR camera (SC6100, FLIR, Massachusetts) to acquire the temperature images. Thus, the HIFU exposure was always synchronized with the IR image acquisition. Figure 1b schematically displays the time sequence of the entire system. While the HIFU began exposing (the upper panel), the temperature started increasing (the middle panel). At the same time, the IR camera was triggered to image the temperature distribution (the lower panel). Each frame was acquired by integrating 0.25 ms and multiple frames were acquired during and after the HIFU exposure. The total number of the frames was well controlled so that there is one frame right after the end of the HIFU exposure (see the frame overlapped with the dotted vertical line). This frame always showed the maximum temperature increase compared with other frames. The IR camera lens was focused on the HIFU's focus by adjusting the lens to achieve a sharp image.
Figure 1.
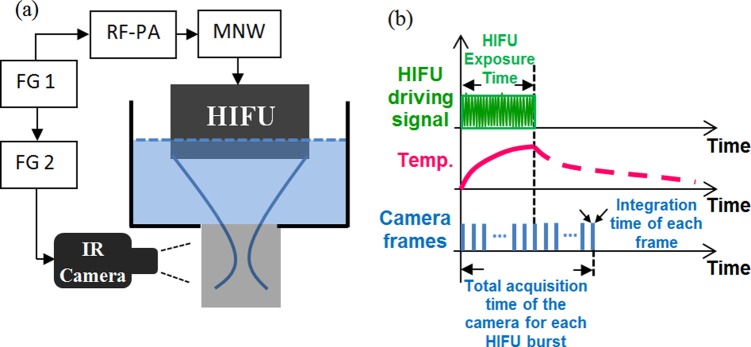
(a) A schematic diagram of the experiment system. FG: function generator; RF-PA: radio-frequency power amplifier; MNW: matching network; HIFU: high intensity focused ultrasound; IR: infrared. (b) A schematic diagram showing the time sequence of the entire system.
To compare the measured UTFS (thermal focal size) with the acoustic focal size of the HIFU transducer in the silicone phantom, a similar method to the one described in Ref. 10 was adopted. Briefly, a hollow capillary tube (filled with air; CT-75-100-5, Paradigm Optics, Washington) was inserted into the silicone phantom and used as a small acoustic reflector. Its inner diameter was ∼75 μm. A pulser-and-receiver (5073 PR, Olympus NDT, Massachusetts) generated a very narrow negative voltage pulse (peak voltage: ∼−135 V; pulse rise time <2 ns and 4 μJ/pulse) to excite the HIFU transducer via the MNW. The HIFU transducer and the phantom were submerged into water. The HIFU transducer was well positioned so that the air-filled capillary tube was placed on the HIFU focus. The reflected acoustic signal from the tube was collected and converted into electronic signal by the same HIFU transducer. The electronic signal was amplified by the pulser-and-receiver and digitized by an oscilloscope. The maximum peak-to-peak voltage of the reflected acoustic signal was recorded at each HIFU location. By scanning the HIFU transducer laterally and axially, the recorded signal can be plotted as a function of the HIFU location. The lateral and axial FWHMs were found as 0.55 and 2.8 mm, respectively, which was limited by acoustic diffraction.11 Note that the measured FWHMs should represent the size of the acoustic intensity focus (rather than the size of the acoustic pressure focus). This is because the same transducer was used to transmit and receive the acoustic signal. Thus, the measured distribution represents the square of the one way pressure distribution, which is equivalent to the intensity distribution.12 This conclusion holds in conventional ultrasound imaging when a pulse-echo technique is used. Therefore, the measured lateral and axial FWHMs of the acoustic intensity focus also represent the lateral acoustic resolution and depth of field of the used transducer, respectively.12
Figure 2 shows three typical and normalized IR images when the HIFU exposure power is 6.1, 12.85, and 16.64 W, respectively, and the HIFU exposure time is 0.1 s. Each image represents the frame acquired right after the end of the HIFU exposure when the temperature temporally reaches the peak value (see the bottom panel in Fig. 1b). Obviously, the UTFS significantly reduces when the HIFU exposure power increases. In addition, the axial location of the peak temperature slightly moves toward the HIFU transducer when the power increases, while the lateral location of the peak temperature remains fixed.
Figure 2.
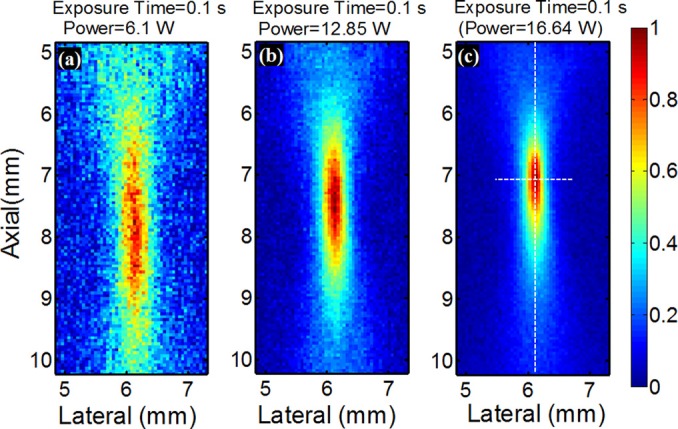
Normalized 2D temperature distribution acquired right after the 0.1 s HIFU exposure when the temperature temporally reaches the peak value with HIFU exposure power equal to (a) 6.1, (b) 12.85, and (c) 16.64 W. Both the two dotted lines in (c) pass through the maximum temperature and are used to plot the lateral and axial temperature profiles. A similar way was adopted for (a) and (b) to plot the profiles.
To quantitatively investigate UTFS, both the lateral and axial FWHMs of each image were calculated. The two dotted lines shown in Fig. 2c were used as an example to show how to select the locations to plot the lateral and axial profiles. The peak temperature on each image was found first. Then, the lateral and axial profiles that passed through this peak temperature location were plotted, and their FWHMs were measured. Figs. 3a, 3b show the measured lateral and axial FWHMs, respectively, as a function of the HIFU exposure power. Clearly, when the power is relatively low (<∼5 W for 0.2 s exposure time and <∼8.8 W for 0.1 s exposure time), both the lateral and axial FWHMs are less dependent on the power, and are close to the measured diffraction-limited acoustic intensity focal size (indicated by the two dashed horizontal lines in Fig. 3). However, both the lateral and axial FWHMs of the temperature focus reduce significantly when the power increases. It is mainly caused by the nonlinear acoustic effect (see details in the discussion part). For example, the experimentally measured minimum lateral and axial FWHMs of the UTFS in Figs. 3a, 3b are 0.246 and 1.072 mm (when the HIFU exposure time is 0.1 s), respectively. They are ∼2.2 and ∼2.6 times smaller than the diffraction-limited acoustic focal sizes of 0.55 (lateral) and 2.8 mm (axial), respectively. However, when the HIFU exposure power further rises, FWHMs abruptly increases. It may be caused by HIFU-induced sample burning. In addition, Fig. 3 implies that a smaller UTFS can be achieved with the exposure time of 0.2 s than the exposure time of 0.1 s at the same HIFU exposure power. However, this conclusion is not true when the exposure time is so long (such as seconds) that the thermal energy diffusion or conduction is significant. To demonstrate this situation, Figs. 4a, 4b show the lateral and axial FWHMs of the UTFS as a function of the HIFU exposure time, respectively. The lines with circles show the results acquired when the HIFU exposure power is low (0.38 W). Both the lateral and axial FWHMs increase with the exposure time and they are much larger than the measured acoustic focal sizes (see the dashed horizontal lines). For example, the lateral and axial FWHMs can reach ∼2.15 and ∼6.0 mm, respectively, when the exposure time is as long as 20 s. This significant increase in the UTFS is mainly caused by thermal diffusion. However, when the HIFU exposure power is increased to 13.75 W (see the lines with squares), both the lateral and axial FWHMs are below the measured acoustic focal sizes. Also, they decrease when the exposure time increases. This result implies that the UTFS can be reduced below the diffraction-limited acoustic focal sizes if appropriately controlling the HIFU exposure power to stimulate the nonlinear acoustic effect and appropriately controlling the HIFU exposure time to confine the thermal energy in the focal volume. For imaging purposes (instead of treatment purposes), the HIFU-induced peak temperature increase (ΔTP) should be limited within a few Celsius degrees to avoid potential tissue thermal damage. This is satisfied in this study (see the supplemental material). ΔTP was found to nonlinearly increase with the HIFU exposure power and exposure time when the nonlinear acoustic effect occurred (see the supplemental material).
Figure 3.
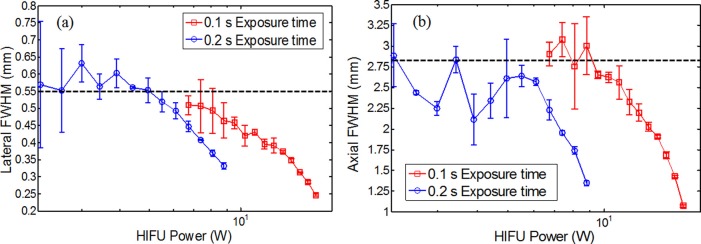
Measured (a) lateral and (b) axial FWHMs as a function of the HIFU exposure power.
Figure 4.
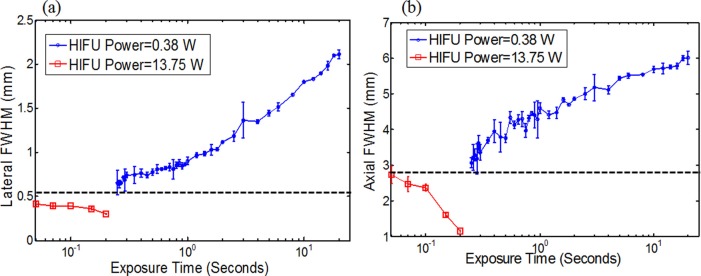
Measured (a) lateral and (b) axial FWHMs as a function of the HIFU exposure time.
In the simulation studies, all the parameters related to tissue properties used here were the same as the default values listed in the manual of the HIFU simulator,9 which were typical parameters for human tissues. Parameters related to the specific experiments, such as HIFU exposure power, exposure time, and HIFU or sample geometries, were changed based on the experimental setup (see the supplemental material). It was considered as a linear model if only the fundamental frequency (f0 = 2.5 MHz) was used in the KZK equation (K = 1). In contrast, when both the fundamental and multiple higher order harmonic frequency components were considered in the KZK equation (K > 1), the model was called a nonlinear model (see the supplemental material).
Fig. 5a shows the lateral and axial FWHMs as a function of the HIFU exposure power calculated from the simulated data. Both the lateral and axial FWHMs are completely independent of the exposure power when the linear model is used. In contrast, when the nonlinear model is adopted, both the lateral and axial FWHMs show significant dependence on the HIFU exposure power. When the power is low (<50 W), the linear and nonlinear models show almost the same FWHMs. In a medium power range (50-150 W), the FWHMs calculated from the nonlinear model quickly reduce. In a high power range (>150 W), the FWHMs reach relatively stable values and become power less dependent. Compared with the linear model results, the lateral and axial FWHMs calculated from the nonlinear model reduce ∼3.4 and ∼2.4 times, respectively, when the power is equal to 150 W (in the high power range). In addition, the ΔTP reaches 5.3 °C when the power is 150 W with an exposure time of 0.5 ms. The results in Fig. 5a generally agree with the experimental results in Fig. 3. However, the experimental results show a relatively lower power threshold for the occurrence of nonlinear effect compared with the simulated results, which may indicate that the silicone phantom used in this study has larger acoustic (and/or thermal) nonlinearity than that used in the simulation.
Figure 5.
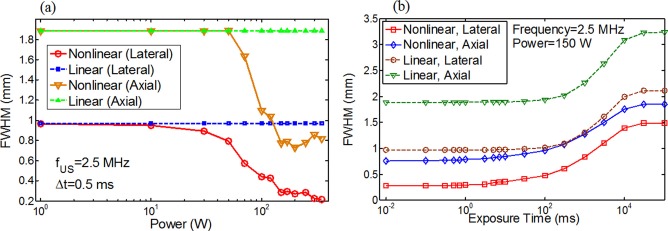
Lateral and axial FWHMs calculated from the simulated data as a function of (a) HIFU exposure power and (b) HIFU exposure time.
Fig. 5b shows the simulated results about how the HIFU exposure time affects the lateral and axial FWHMs when the exposure power is 150 W. The FWHMs calculated from the nonlinear model are significantly smaller than those calculated from the linear model. Similarly, this is mainly due to the nonlinear acoustic effect (see the following paragraph). For nonlinear model results, when the exposure time is shorter than 1 ms, both the lateral and axial FWHMs are significantly less dependent on the exposure time. The lateral and axial FWHMs remain in a range from 0.29 to 0.28 mm and from 0.785 to 0.756 mm, respectively. This is because when the exposure time is so short that the thermal diffusion can be significantly avoided. Thus, the size of the thermal focal spot is almost equal to the size of the nonlinear acoustic intensity focal spot (the size of the heating source) that is independent of the exposure time and is mainly determined by the acoustic parameters, such as power, frequency, and f-number. This result does not agree well with the experimental results shown in Fig. 4 where the lateral and axial FWHMs slightly reduce as the exposure time increases when the exposure power is 13.75 W. The reason is not clear or may be due to some unknown acoustic or thermal nonlinearity in the silicone sample (see the supplemental material for a brief discussion). As the increase of the exposure time, the thermal diffusion cannot be avoided and therefore both the lateral and axial FWHMs increase. When the exposure time is so long (>104 ms) that the temperature rising (caused by heating) and falling (caused by thermal diffusion or conduction) reach a balance, ΔTP reaches a saturated value. Thus, both the lateral and axial FWHMs reach their maxima. In addition, the simulated results showed that ΔTP was below 10 °C when the exposure time is shorter than 1 ms. Therefore, we predict that it is an efficient way in soft tissues to reduce UTFS significantly below the linear acoustic intensity focal size by selecting a high exposure power (such as >150 W, to stimulate nonlinear acoustic effect) and adopting a short exposure time (such as <1 ms, to avoid the thermal diffusion). This result provides a valuable guidance for future USF- or UTF-based deep-tissue high-resolution imaging.
Theoretically, when nonlinear acoustic effect occurs, a part of acoustic energy at the fundamental frequency (f0) can be transferred to higher harmonic frequency components (such as 2f0, 3f0, 4f0,…) in the focal volume.8 Compared with the fundamental frequency, higher order harmonic frequencies can be more tightly focused. This is the major reason that nonlinear acoustic effect can reduce the UTFS. More interestingly, the higher order harmonic frequencies are most likely only generated within the focal volume formed by the fundamental frequency (due to the strong acoustic pressure in the focal volume). Therefore, the acoustic penetration depth is mainly determined by the fundamental frequency, which is usually large (a few centimeters) when the fundamental frequency is relatively low (a few MHz).8 However, thermal diffusion or conduction leads to a smoothing of the spatial temperature distribution when the heating time is longer than the characteristic time of thermal diffusion or conduction.8 Therefore, to confine the ultrasound-induced temperature field within the heating source volume, the HIFU exposure time should be short to avoid thermal diffusion or conduction (known as thermal confinement).6 Thus, acoustic nonlinear effect (controlled by HIFU exposure time) combined with thermal confinement (controlled by HIFU exposure time) can be adopted as a potential way to break acoustic diffraction limit for deep-tissue high-resolution imaging via USF- or UTF-based methods.
In summary, we experimentally and theoretically demonstrated that ultrasound-induced temperature focal size can be significantly reduced beyond the acoustic diffraction limit if nonlinear acoustic effect occurs and the ultrasound-induced thermal energy is confined within the focal volume. For USF- or UTF-based imaging techniques, the ultrasound-induced peak temperature increases only a few degrees. The nonlinear acoustic effect can occur by appropriately controlling the ultrasound exposure power, and the thermal confinement can be satisfied by appropriately controlling the ultrasound exposure time. Therefore, the proposed method in this study may be an alternative way to break the acoustic limit and can be potentially used for deep-tissue high-resolution imaging via USF or UTF techniques. High-resolution USF imaging beyond the acoustic diffraction limit in deep tissues will be the focus of future studies.
Acknowledgments
This work was supported in part by funding from the NIH/NIBIB 7R15EB012312-02 (Yuan), the CPRIT RP120052 (Yuan), and the NSF CBET-1253199 (Yuan). Also, thanks go to Dr. Kambiz Alavi for sharing the IR camera for this study.
References
- Corlu A., Choe R., Durduran T., Rosen M. A., Schweiger M., Arridge S. R., Schnall M. D., and Yodh A. G., Opt. Express 15(11), 6696 (2007). 10.1364/OE.15.006696 [DOI] [PubMed] [Google Scholar]
- Wang L. V. and Hu S., Science 335(6075), 1458 (2012). 10.1126/science.1216210 [DOI] [PMC free article] [PubMed] [Google Scholar]
- Resink S. G., Boccara A. C., and Steenbergen W., J. Biomed. Opt. 17(4), 040901 (2012). 10.1117/1.JBO.17.4.040901 [DOI] [PubMed] [Google Scholar]
- Lin Y., Bolisay L., Ghijsen M., Kwong T. C., and Gulsen G., Appl. Phys. Lett. 100(7), 73702 (2012). 10.1063/1.3681378 [DOI] [PMC free article] [PubMed] [Google Scholar]
- Lin Y., Kwong T. C., Bolisay L., and Gulsen G., J. Biomed. Opt. 17(5), 056007 (2012). 10.1117/1.JBO.17.5.056007 [DOI] [PMC free article] [PubMed] [Google Scholar]
- Yuan B., Uchiyama S., Liu Y., Nguyen T. K., and Alexandrakis G., Appl. Phys. Lett. 101(3), 033703 (2012). 10.1063/1.4737211 [DOI] [PMC free article] [PubMed] [Google Scholar]
- Yuan B., J. Biomed. Opt. 14(2), 024043 (2009). 10.1117/1.3120493 [DOI] [PubMed] [Google Scholar]
- Filonenko E. A. and Khokhlova V. A., Acoust. Phys. 47(4), 468 (2001). 10.1134/1.1385422 [DOI] [Google Scholar]
- Soneson J. E., AIP Conf. Proc. 1113, 165 (2008). [Google Scholar]
- Yuan B., Liu Y., Mehl P., and Vignola J., Appl. Phys. Lett. 95(18), 181113 (2009). 10.1063/1.3262959 [DOI] [Google Scholar]
- Stuart Foster F., Pavlin C. J., Harasiewicz K. A., Christopher D. A., and Turnbull D. H., Ultrasound Med. Biol. 26(1), 1 (2000). 10.1016/S0301-5629(99)00096-4 [DOI] [PubMed] [Google Scholar]
- Hunt J. W., Arditi M., and Foster F. S., IEEE Trans. Bio-Med. Eng. 30(8), 453 (1983). 10.1109/TBME.1983.325150 [DOI] [PubMed] [Google Scholar]
- See supplementary material at http://dx.doi.org/10.1063/1.4792736 for USF mechanisms, simulation parameters and HIFU induced temperature.


