Abstract
We present a plastic microfluidic device with integrated nanoscale magnetic traps (NSMTs) that separates magnetic from non-magnetic beads with high purity and throughput, and unprecedented enrichments. Numerical simulations indicate significantly higher localized magnetic field gradients than previously reported. We demonstrated >20 000-fold enrichment for 0.001% magnetic bead mixtures. Since we achieve high purity at all flow-rates tested, this is a robust, rapid, portable, and simple solution to sort target species from small volumes amenable for point-of-care applications. We used the NSMT in a 96 well format to extract DNA from small sample volumes for quantitative polymerase chain reaction (qPCR).
Rapid isolation of target molecules or cells from complex mixtures is critical for a wide range of medical diagnostics, research and biotechnological investigations, and cell-based therapeutics.1, 2, 3, 4 However, current separation techniques have not demonstrated the purity and throughput required for these and other emerging applications such as directed evolution and stem cell technologies.2, 5 The ability to sort targets from the milieu with high purity, throughput, and recovery is paramount for such applications. Two of the most common methods for such sorting include fluorescence activated cell sorting (FACS)6, 7 and magnetic activated cell sorting (MACS).8, 9
In FACS, labeled cells are individually identified via fluorescence signal. Because this is a cell by cell analysis, there is an inherent limitation in throughput speed (typically 104 to 105 cells per second).10 Moreover, there is a limitation of minimum volume size and concentration required to run FACS; dilute and small samples are difficult to sort.11
MACS is based on immunomagnetic instead of fluorescence labeling. Superparamagnetic particles are selectively attached to target cells which are then isolated from other cells when subjected to a magnetophoretic (MEP) force from an external magnet. MACS has the advantage of collecting the target cells all at once, by sorting in parallel. However, inherently small magnetic moment in MACS results in long separation times.12 Low sensitivity of MACS also makes it difficult to capture desired cells in a sparse population; rare cell isolation in dilute samples is therefore difficult.13
Microfluidic MACS devices have demonstrated reduced sample volumes, faster analysis, and integration capabilities. Chalmers et al.9 developed a MACS device that separated cells labeled with magnetic particles in a flow channel. External magnets were used to generate a magnetic field gradient inside the flow channel. Good purity and recovery results were reported but because the magnetic field gradients generated by the magnetic poles were small, only low throughput was achieved. Xia et al.14 reported a continuous flow microfluidic-based MACS device that used an external magnet to deflect the magnetic beads away from the main flow of non-magnetic beads. This device yielded 92% purity for a mixture of 1 μm magnetic beads with 2 μm non-magnetic beads using a flow rate of 40 μl/min. Weak magnetic field gradients produced by the external magnet resulted in low throughput. Others have similarly reported various assays, such as mRNA extraction from peripheral blood lysate and separation of red and white blood cells from whole blood with microfluidic magnetic devices.9, 12
To improve performance, integration of ferromagnetic materials into microfluidics has been demonstrated.13 By depositing soft ferromagnetic materials at the micro and nanoscale, high magnetic field gradients are generated when magnetized by an external magnet. Inglis et al.13, 15 incorporated microscale Ni structures into a continuous flow microfluidic MACS device. Separation of magnetically labeled leukocytes from whole blood was demonstrated but because only weak magnetic force (pN) was exerted on the target cells, only low throughput separations were achieved. Similarly, Adams et al.16 separated multiple bacterial cell types by utilizing different sized magnetic beads with 90%-96% purity. However, this process required large sample volumes and so may not be suitable to separate low volumes.
We introduce robust nanoscale magnetic traps (NSMT) formed on a shape memory polymer integrated into a microfluidic device. This device employs an external magnet with our NSMT to generate magnetic field gradients capable of sorting 1 μm magnetic beads from 1 μm non-magnetic (polystyrene) beads for high purity and throughput. To form NSMT, commodity shrink wrap polyolefin (PO) film (1 mil, sealed air) was cut to 5 × 7 cm and cleaned by sonicating in isopropanol and deionized water. The PO film was air dried and adhered to glass for structural support. A Ni thin film (either 30 nm or 1 nm) was deposited on the PO using an ion beam sputter coater (IBS/e South Bay Technology). Heating the Ni coated PO to 155 °C causes the PO to reduce by more than 75% in each lateral direction (surface area to 5% of its original surface area) causing the stiffer Ni film to buckle and wrinkle.
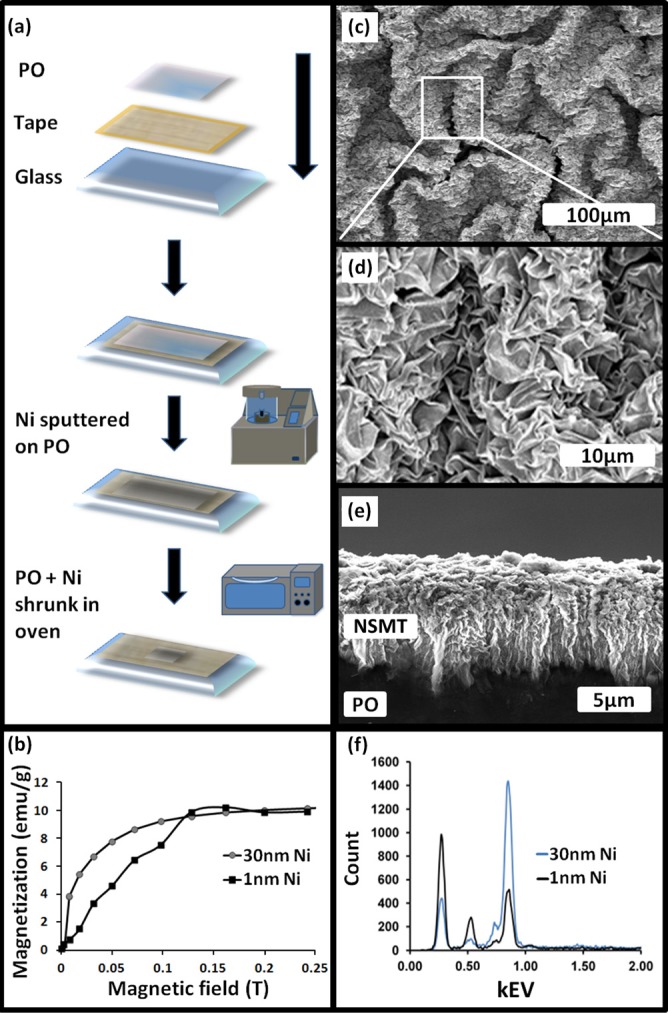
Figure 1a illustrates the process flow to create NSMT. Figures 1c, 1d, 1e are scanning electron micrographs (SEM, FEI/Phillips XL-30 FEG) of NSMT after heating the Ni coated PO sample. Further characterization of the NSMT was performed using energy-dispersive X-ray spectroscopy (EDX) analysis to identify elements. Figure 1f reveals the EDX spectrum for shrunk 30 nm Ni sample. A number of peaks corresponding to nickel (Ni), oxygen (O), and carbon (C) were observed. The signal at 0.851 keV is indicative of Ni in our sample, 0.282 keV indicative of C, and 0.523 keV indicative of partially oxidized Ni. This indicates we have relatively pure Ni with minimal NiO present in our sample. This is particularly important as NiO is antiferromagnetic. Figure 1e shows a cross section SEM of NSMT fabricated by depositing 1 nm Ni film deposited on PO. The cross section shows that the height of the NSMT to be approximately 20 μm, indicative of an integration into the plastic, consistent with the EDX measurements and wear testing. To understand the magnetic properties of our NSMT, superconducting quantum interference device (SQUID, Quantum design SQUID-VSM) measured magnetization. Figure 1b quantifies magnetization vs. applied magnetic field for shrunk 1 nm and 30 nm Ni samples and indicates a saturation magnetization of approximately 0.15 T, consistent with previously published results in literature.13
Figure 1.

NSMT fabrication and characterization. (a) Process flow for making NSMT. (b) Variation of magnetization vs. the applied magnetic field for the NSMT fabricated 1 nm and 30 nm Ni films. (c)–(d) SEM images of NSMT fabricated sputtering 30 nm Ni film and shrinking. (e) SEM cross section of NSMT fabricated by sputtering 1 nm Ni film on PO. (f) EDX data for elemental composition of both 1 nm and 30 nm NSMT.
Magnetic force analysis by magnetic force microscopy (MFM) was performed using an experimental set-up similar to Gomez et al.17 MFM measures the change in natural resonance frequency of the probe tip due to tip-sample interactions including magnetostatic, electrostatic, adhesive, elastic, and Van der Waals interactions.18 Measurements were acquired at a distance approximately 200 nm above the sample surface to minimize contributions from Van der Waals interaction forces.18 The applied external magnetic field was varied and an external magnetic field of 0.1 T was found to give an optimal signal to noise. Higher external fields resulted in strong contributions between sample and cantilever.19, 20
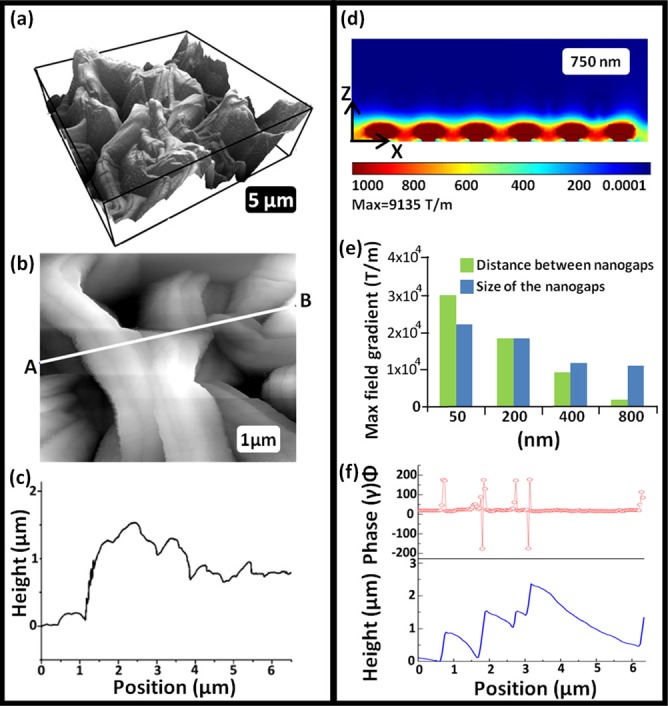
Silicon tips coated with ∼5 nm of Ni and having a spring constant of 7 N/m were used for AFM and MFM measurements. All measurements were taken in AC mode (Asylum Research MFP-3D AFM). Figures 2a, 2b are 3D and 2D AFM topography images, respectively, acquired with a field of 0.1 T. Without an external field, there will be no magnetic field gradient and no usable magnetophoretic force between the tip and the imaging sample. Without the external magnet, the tip was unable to track the rough surface, thus these topography images are influenced by magnetostatic and possibly electrostatic forces, in addition to Van der Waals interactions, between sample and tip. Figure 2c is a height profile taken along the white line in the topography image in Figure 2b. Figure 2f shows a MFM line profile and corresponding topography line profile taken from a 30 nm Ni sample. The line profiles exhibit a clear correlation between the MFM signal and topography. MFM measurements were also performed using a non magnetic Pt-Ir coated tip under the same imaging conditions to examine potential electrostatic contributions to the MFM signal. Using a Pt-Ir tip, the majority of the sample surface exhibited no phase contrast. Some features greater than 2 μm in height exhibited a 20° phase shift, much smaller than the phase shifts measured with the magnetic tip. Therefore, the phase shift observed in the line profile shown in Figure 2f was produced by performing nontraditional MFM measurements. When performing MFM, the spatially varying force between the magnetized AFM tip and the fully magnetized Ni nanostructures (in Z direction) was measured whereas in traditional MFM, the dipole-dipole interactions between tip and the samples are measured. A large magnetic field gradient is therefore expected from the sharp edges of the nanostructured surface; theoretical calculations are necessary to determine the extent of these magnetic field gradients and the corresponding magnetophoretic forces.
Figure 2.

Simulation and AFM-MFM results. (a) 3D AFM scan of 30 nm Ni NSMT. (b) A 7 × 7 μm scan of the 30 nm NSMT. (c) Height profile of the A-B line from figure (b). (d) Simulated magnetic field gradient in the z direction. (e) Calculated magnetic field gradient variation with distance between NSMT and with size of NSMT. (f) AFM measurements and corresponding MFM results for NSMT fabricated using 30 nm Ni film.
Simulations were performed using comsol multiphysics (ver. 4.1, Comsol, Inc., MA, USA). Field gradients are high near the edges of the nanostructures and decay very rapidly from the structures (Figure 2d). We also extended this calculation to determine the magnetic gradient as a function of sizes and spacing. The green bar in Figure 2e illustrates the field gradient for various spacing between two nanostructures, important because the nanostructures have various shapes, sizes, and spacing. The magnetic field gradient has a nonlinear relationship with spacing between two nanostructures.
In addition, we have also calculated the variation of the magnetic field with size of the nanostructures by changing the width of the nanostructures and keeping the height (400 nm) and spacing (200 nm) between them constant (Figure 2e). For features smaller than 200 nm in spacing or size, calculated localized field gradients are extremely large; these values are larger than those previously reported in the literature. Such fine features required to achieve such large localized field gradients exist in the distribution of our wrinkle sizes, as apparent from the AFM in Figure 2c. We have also simulated the magnetic field gradient produced by the external magnet and found they produce field gradients only in the range of 100 T/m (max = 400 T/m).
To calculate the magnetic force acting on the magnetic beads, we calculated the magnitude of magnetophoretic force acting on 1 μm magnetic bead in the vicinity of the NSMT with Eq. 1, where the magnetic force is equal to the number of Bohr magnetons s times a constant μB and ∇B is the magnetic field gradient
| (1) |
By using Eq. 1 and taking the calculated magnetic field gradient, we estimate a 3 nN force on a 1 μm magnetic bead from the NSMT. Similarly 1 μm magnetic beads experience about 0.001 nN (max = 0.004 nN) pulling force from the external magnet. Following these simulations, we were confident to integrate the NSMT into a microfluidic device of the same PO plastic.
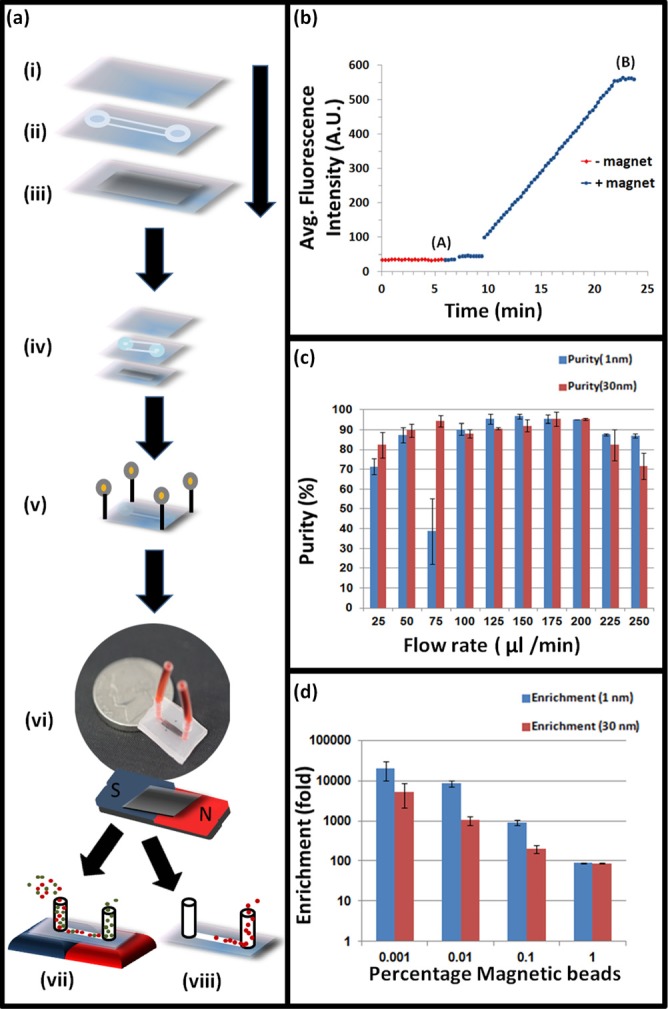
Microfluidic device fabrication is detailed previously.18 Briefly, the device consists of three layers: a top PO layer, a channel layer, and bottom layer containing the NSMT. Figure 3a illustrates a schematic of this device and the manufacturing procedure.
Figure 3.

Fabrication of NSMT integrated microfluidic device. (a) Steps of fabrication and modes of operation. The device consists of three PO layers: a top layer (i), a channel layer (ii), and bottom layer (iii) containing the NSMT. The top layer is single sheet of PO to seal the channel. Channels were designed using CAD software and cut in PO using a laser cutter before the film was shrunk. To create the NSMT layer, 1 nm or 30 nm nickel was sputter coated on pre-stressed PO. The three layers were then aligned (iv) and secured using 0.4 mm pins (v). Layers were then heated to 155 °C to bond them together and form the device. The extraction mode is indicated in vii. The collection mode is indicated in viii. (b) Indicates the variation of fluorescence vs. time in extraction mode. Fluorescence was recorded while flowing 1 μm fluorescent magnetic beads through the microfluidic device. (c) Purity vs. flow rate for 1% magnetic bead and 99% polystyrene bead mixture. (d) Variation of enrichment vs. % magnetic beads.
The device has two modes of operation: extraction and collection (Figure 3a). In extraction mode, an external magnet (K&J Magnetics, NdFeB magnet, 1.5 T) is placed outside the device near the NSMT. The external magnet magnetizes the NSMT to create strong, localized magnetic field gradients. As the magnetic beads flow across the NSMT in the channel, they are pulled toward the NSMT by the magnetic force from the external magnet. The magnetic beads are then trapped on the surface through the magnetophoretic force from the NSMT. Trapped magnetic material is collected in the extraction mode when the external magnet is removed. When collection buffer is flown through the device, previously trapped magnetically labeled materials are collected at the outlet for quantification.
We carried out initial experiments using a mixture of fluorescently labeled magnetic and polystyrene beads; 0.9 μm diameter, excitation/emission = 660/690 nm and 1 μm in diameter, excitation/emission = 480/520 nm, respectively, to test the devices fidelity and purity performance. A Zeiss 710 laser confocal microscope was used for real-time imaging utilizing a 10× air objective (Zeiss, Germany) with 0.4 NA was used and a scan rate of 2.55 μs/frame was chosen. A time series was captured and recorded while magnetic beads were flowing through the device. We then calculated the average fluorescence of each frame by using imagej software (Figure 3b).
The increasing fluorescence can be understood as follows: magnetized beads are subjected to the pulling force by the external magnet (max = 0.004 nN) followed by the trapping force from the NSMT (max = 3 nN) once the beads come in close proximity to the surface. The trapping force is magnet (max = 0.004 nN) followed by the trapping force from the NSMT (max = 3 nN) once the beads come in close proximity to the surface. The trapping force is localized, only extending up a few μm from the surface. The sudden increase in fluorescence between region A and B in Figure 3b is from the trapped beads captured by a combination of these forces.
Figure 3c quantifies purity vs. sample flow rate using an unsorted mixture of 1% magnetic beads. Purity is determined by the degree of magnetic beads trapping and sedimentation of polystyrene beads with various sample flow rates. The control was run with a flat PO/Ni channel bottom (no nanostructures) at the best flow rate (175 μl/min) and resulted in poor purity (<50%) with significantly larger error bars (data not shown). We then performed separation experiments using binary bead mixtures of magnetic and polystyrene beads; 1%, 0.1%, 0.01%, and 0.001% magnetic beads in solution of 109 polystyrene beads/ml mixtures were flowed through the device with an external magnetic field of 1.5 T. The magnetic beads were pulled and trapped in extraction mode and collected in collection mode and quantified using standard FACS. We then calculated the purity and the enrichment of each sample. Figure 3d indicates the variation of enrichment vs. % magnetic beads using flow rate of 175 μl/min. Over 20 000-fold enrichment was achieved for the most dilute (0.001%) sample. Using a continuous wrinkled film substrate, we demonstrated that high purity, enrichment, and recovery are possible.
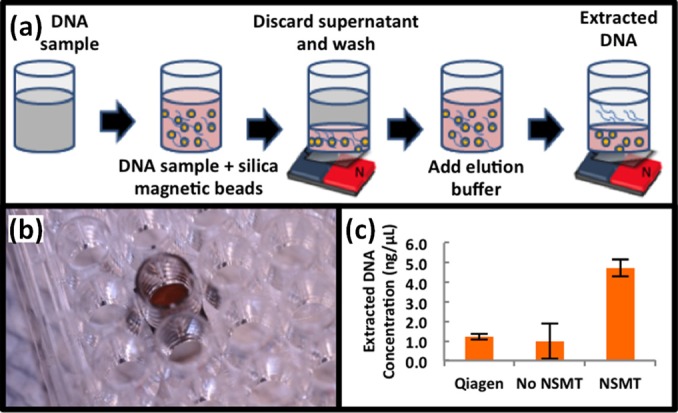
Since we achieve relatively high purity at all flow-rates tested, we next tested the efficacy of DNA extraction with magnetic beads in a 96 well format using our NSMT with no flow. Because many biological preparations rely on using well plates, for ease of usability, we tested whether this format was feasible. Efficient DNA purification is critical and inherent to sample preparation. Briefly, 10 ng/μl of lambda DNA was extracted using our NSMT and compared to the gold standard, Qiagen QIAmp DNA Mini Kit. Extraction using the NSMT was performed in a 96 well plate format with only 50 μl of lambda DNA (Figure 4a); Qiagen kit volumes were scaled to match (note: Qiagen recommends using at least 150 μl). The NSMT was made on the PO film as previously described but instead of integrating into a microfluidic chip, it was adhered to the bottom of a bottomless 96 well plate. As described previously, a small 1.5 T magnet is placed behind the NSMT (on the bottom side of the well) (Figure 4b).
Figure 4.

DNA extraction with NMST for qPCR. (a) Process flow of sample preparation in 96 well plate format. NMST substrates were fabricated on shrink film as previously described but then taped to the bottom of the bottomless well plate. (b) Actual device, with the NMST at the bottom of a 96 well plate and T magnetic underneath. (c) Calculated DNA concentration that NSMT trapped versus the positive control Qiagen and the negative control of external magnet only (no NMST). Method is further described in supplemental section.
We calculate, based on critical threshold (CT) values from the qPCR, that our NSMT extracts ∼44% of the pure DNA while the Qiagen kit only extracts ∼10% of the pure DNA (Figure 4c).
This approach is also readily amenable to other designs. The benefits of the NSMT may also be applied into different cell sorting operations. To demonstrate, we created two simple variations; these designs demonstrate other useful form factors: aligned NSMT and NSMT islands.22
In summary, we present fabrication, characterization, and testing of NSMT. We demonstrated unprecedented localized field gradients and with it higher enrichments than previously reported. We also demonstrate better sample purification for qPCR without the need for flow as compared to a commercially available DNA extraction kit. These NSMT can be used in many magnetic based applications including immunomagnetic cell separation. Furthermore, because these NSMT are robustly integrated into easily configurable plastic based microfluidics devices, other microfluidic components can be readily integrated for a true micrototal analysis system. Such integration is simple and does not require expensive semiconductor fabrication tools to manufacture the microfluidic device. In fact, while we used a sputter coater, other thin film deposition techniques, including electroless deposition, and materials are readily amenable to this process.21 Therefore, this is a versatile technology that enables configurable low cost and effective sorting of biological targets.
Acknowledgments
This work was supported by the DP2 NIH New Innovator Award 1 DP2 OD007283-01.
References
- Saliba A. E., Saias L., Psychari E., Minc N., Simon D., Bidard F.-C., Mathiot C., Pierga J.-Y., Fraisier V., Salamero J., Saada V., Farace F., Vielh P., Malaquin L., and Viovy J.-L., Proc. Natl. Acad. Sci. U.S.A. 107, 14524 (2010). 10.1073/pnas.1001515107 [DOI] [PMC free article] [PubMed] [Google Scholar]
- Hu X., Basset P. H., Qian J., Meinhart C. D., Daugherty P. S., and Soh H. T., Proc. Natl. Acad. Sci. U.S.A. 102, 15757 (2005). 10.1073/pnas.0507719102 [DOI] [PMC free article] [PubMed] [Google Scholar]
- Pruszak J., Sonntag K.-C., Aung M. H., Sanchez-Pernaute R., and Sacso O., Stem Cells 25, 2257 (2007). 10.1634/stemcells.2006-0744 [DOI] [PMC free article] [PubMed] [Google Scholar]
- Wang X., Chen S., Kong M., Wang Z., Costa K. D., Li R. A., and Sun D., Lab Chip 11, 3656 (2011). 10.1039/c1lc20653b [DOI] [PubMed] [Google Scholar]
- Agresti J. J., Antipov E., Abate A. R., Ahn K., Rowat A. C., Baret J. C., Marquez M., Klibanov A. M., Griffiths A. D., and Weitz D. A., Proc. Natl. Acad. Sci. U.S.A. 107, 4004–4009 (2010). 10.1073/pnas.0910781107 [DOI] [PMC free article] [PubMed] [Google Scholar]
- Jorgensen J. L., Cancer Cytopathol. 105, 443 (2005). [Google Scholar]
- DeMay R. M., Practical Principles of Cytopathology (American Society for Clinical Pathology, Chicago, IL, 2007), pp. 131–139. [Google Scholar]
- Miltenyi S., Müller W., Weichel W., and Radbruch A., Cytometry 11, 231–238 (1990). 10.1002/cyto.990110203 [DOI] [PubMed] [Google Scholar]
- Chalmers J. J., Zborowski M., Sun L. P., and Moore L., Biotechnol. Prog. 14, 141 (1998). 10.1021/bp970140l [DOI] [PubMed] [Google Scholar]
- Ibrahim S. H. F. and Engh V. D., Curr. Opin. Biotechnol. 14(1 ), 5–12 (2003). 10.1016/S0958-1669(02)00009-5 [DOI] [PubMed] [Google Scholar]
- Macey M. G., Flow Cytometry: Principles and Applications, (Humana, 2007), pp. 257–274. [Google Scholar]
- Lee H., Jung J., Han S.-I., and Han K.-H., Lab Chip 10, 2764 (2010). 10.1039/c005145d [DOI] [PubMed] [Google Scholar]
- Inglis D. W., Riehn R., Austin R. H., and Sturm J. C., Appl. Phys. Lett. 85, 5093 (2004). 10.1063/1.1823015 [DOI] [Google Scholar]
- Xia N., Hunt T. P., Mayers B. T., Alsberg E., Whitesides G. M., Westervelt R. M., and Ingber D. E., Biomed. Microdevices 8, 299 (2006). 10.1007/s10544-006-0033-0 [DOI] [PubMed] [Google Scholar]
- Inglis D. W., Riehn R., Sturm J. C., and Austin R. H., J. Appl. Phys. 99, 08K101-3 (2006) 10.1063/1.2165782. [DOI] [Google Scholar]
- Adams J. D., Kim U., and Soh H. T., Proc. Natl. Acad. Sci. U.S.A. 105, 18165 (2008). 10.1073/pnas.0809795105 [DOI] [PMC free article] [PubMed] [Google Scholar]
- Gomez R. D., Burke E. R., and Mayergoyz I. D., J. Appl. Phys. 79, 6441 (1996) 10.1063/1.361966. [DOI] [Google Scholar]
- Schwarz A. and Wiesendanger R., Nano Today 3(1–2 ), 28–39 (2008). 10.1016/S1748-0132(08)70013-6 [DOI] [Google Scholar]
- Nguyen D., Taylor D., Qian K., Norouzi N., Rasmussen J., Botzet S., Lehmann K. H., Halverson K., and Khine M., Lab Chip 10, 1623 (2010). 10.1039/c001082k [DOI] [PubMed] [Google Scholar]
- Chen A., Lieu D. K., Freschauf L., Lew V., Sharma H., Wang J., Nguyen D., Karakikes I., Hajjar R. J., Gopinathan A., Botvinick E., Fowlkes C., Li R. A., and Khine M.. Adv. Mater. 23(48 ), 5785–5791 (2011). 10.1002/adma.201103463 [DOI] [PubMed] [Google Scholar]
- Schlesinger M. and Paunovic M., “ Electroless deposition of nickel,” in Modern Electroplating, 5th ed. (Wiley, 2011), Chap. 18. [Google Scholar]
- See supplementary material at http://dx.doi.org/10.1063/1.4790191 for supplemental figures 1a, 1b.


