Abstract
Purpose: Developing an imaging method to directly monitor the spatial distribution of platinum-based (Pt) drugs at the tumor region is of critical importance for early assessment of treatment efficacy and personalized treatment. In this study, the authors investigated the feasibility of imaging platinum (Pt)-based drug distribution using x-ray fluorescence (XRF, a.k.a. characteristic x ray) CT (XFCT).
Methods: A 5-mm-diameter pencil beam produced by a polychromatic x-ray source equipped with a tungsten anode was used to stimulate emission of XRF photons from Pt drug embedded within a water phantom. The phantom was translated and rotated relative to the stationary pencil beam in a first-generation CT geometry. The x-ray energy spectrum was collected for 18 s at each position using a cadmium telluride detector. The spectra were then used for the K-shell XRF peak isolation and sinogram generation for Pt. The distribution and concentration of Pt were reconstructed with an iterative maximum likelihood expectation maximization algorithm. The capability of XFCT to multiplexed imaging of Pt, gadolinium (Gd), and iodine (I) within a water phantom was also investigated.
Results: Measured XRF spectrum showed a sharp peak characteristic of Pt with a narrow full-width at half-maximum (FWHM) (FWHMKα1 = 1.138 keV, FWHMKα2 = 1.052 keV). The distribution of Pt drug in the water phantom was clearly identifiable on the reconstructed XRF images. Our results showed a linear relationship between the XRF intensity of Pt and its concentrations (R2 = 0.995), suggesting that XFCT is capable of quantitative imaging. A transmission CT image was also obtained to show the potential of the approach for providing attenuation correction and morphological information. Finally, the distribution of Pt, Gd, and I in the water phantom was clearly identifiable in the reconstructed images from XFCT multiplexed imaging.
Conclusions: XFCT is a promising modality for monitoring the spatial distribution of Pt drugs. The technique may be useful in tailoring tumor treatment regimen in the future.
Keywords: x-ray fluorescence computed tomography, characteristic x-ray, platinum-based chemotherapy, molecular imaging, CT
INTRODUCTION
Platinum (Pt)-based drugs (e.g., cisplatin, carboplatin, and oxaliplatin) are some of the most widely used and effective anticancer agents. They play a major role in the treatment of a variety of cancers, including testicular, bladder, ovarian, head-and-neck, breast, cervical, lung, and colorectal cancer.1 A successful Pt-based cancer chemotherapy is highly dependent on enhanced accumulation of Pt drugs in the tumor regions.2 Pt-based drugs work by crosslinking DNA, eventually triggering apoptosis. Despite an expanding panel of Pt drugs, tumor cell resistance to chemotherapy agents continues to pose a significant challenge in the clinic.3 Previous studies have suggested several mechanisms of resistance, the most common phenotype is decreased Pt drug accumulation in the tumor region due to either decreased influx or increased efflux.4, 5, 6 Pt drugs may also be inactivated by cytoplasmic or nuclear molecules, such as glutathione (GSH), which bind to Pt-DNA monoadducts, preventing crosslink formation. Export of Pt-GSH conjugates could also contribute to increased efflux.7, 8 A strategy to determine the accumulation defect in the cisplatin-resistant tumor cells is urgently needed in order to optimize local delivery of Pt drugs to the tumor region and provide anatomical and functional imaging feedback of the therapeutic processes.
In this study, we investigated the feasibility of energy-dispersive x-ray fluorescence (XRF) computed tomography (XFCT) to image the spatial distribution of Pt drugs. Pt is an element with high atomic number (Z). Bombarding the tumor regions where Pt drug accumulates with x rays will lead to the emission of characteristic x rays (i.e., XRF photons) through photoelectric process. The XRF photons can be imaged with energy-resolving x-ray photon counting detectors.9, 10, 11 This provides a means of quantitatively detecting the change in the distribution and concentration of Pt drugs. The present study represents an important advance in the ability of XRF to image platinum in a tomographic approach. The data presented herein outline the instrumentation development and phantom validation. A water phantom containing different concentrations of cisplatin was used to mimic a biological tissue accumulating chemodrugs as a proof of concept. This study also demonstrates the capability of XFCT to perform multiplexed imaging of Pt, gadolinium (Gd), and iodine (I) within one water phantom. This offers the potential to simultaneously image multiple phenotypes of chemo/radiotherapy, indexed by different high Z agents.
MATERIALS AND METHODS
Phantom preparation
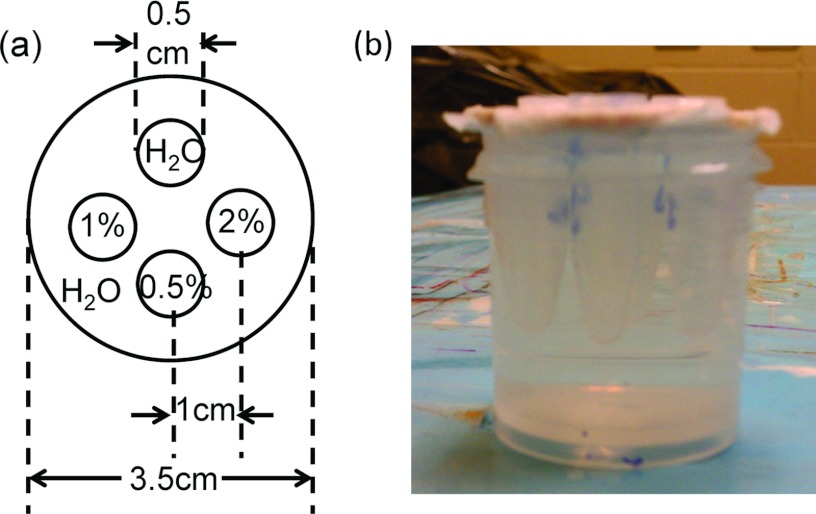
A water phantom containing different concentrations of cisplatin insertion was prepared as shown in Fig. 1. The insertions consisted of 2%, 1%, and 0.5% (w/v) solutions of cisplatin and a water insertion as the negative control. After each solution was poured into an Eppendorf tube (0.7 ml), the tubes were sealed and inserted into a cylindrical water phantom as shown in Fig. 1. The dimensions of the phantom were 3.5 and 5 cm in diameter and height, respectively. The centers of the four Eppendorf tubes were located 1 cm away from the center of the phantom.
Figure 1.
(a) Schematic diagram of the cylindrical water phantom with four conical tube insertions. (b) Photograph of the cylindrical water phantom.
Experimental setup
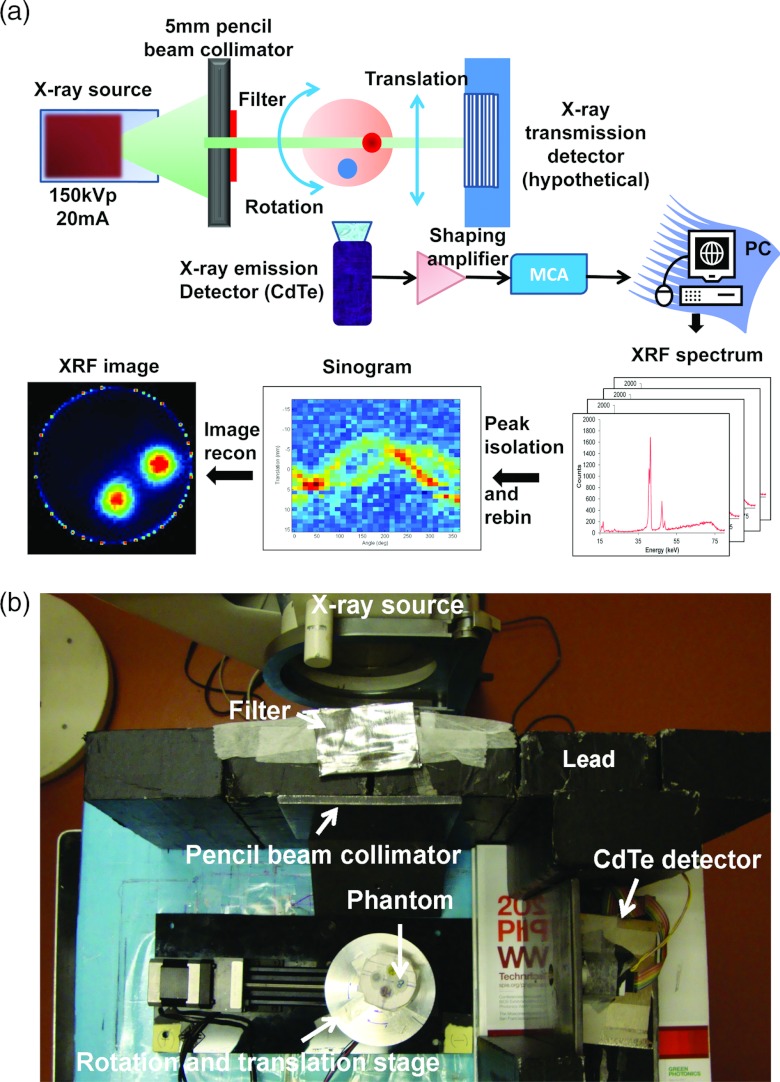
As a proof-of-concept, the XFCT acquisition was performed in a first-generation CT geometry, acquiring a single line integral at a time. The x-ray beam (150 kV, 20 mA) was generated by a Philips RT250 orthovoltage unit (Philips Medical System Inc., Shelton, CT). The x-ray beam was collimated by two lead bricks (20 × 10 × 5 cm3 for each) separated by a 5 mm gap and a lead block with a cylindrical hole of 5 mm in diameter to produce a pencil beam (Fig. 2). To reduce the total dose deposited by x-ray photons with energies below the K-absorption edge for Pt (78.4 keV), a filter consisting of 1 mm Pb, 7.3 mm Al, and 1.4 mm Cu was placed at the exit of the collimator. The water phantom was set to rotate and translate in precise steps using a computer-controlled motion stage (Velmex Inc., Bloomfield, NY), while the x-ray source and the detector were stationary. A single slice of measurements was acquired by translating the phantom 30 times in 1.5 mm increments, and rotating it 31 times to cover 360°. XRF photons emitted from the narrow volume illuminated by the pencil beam were collected using a thermoelectrically cooled cadmium telluride (CdTe) detector (X-123CdTe, Amptek Inc., Bedford, MA). The x-ray detector module includes a preamplifier with pile-up rejection, a digital pulse processor and a multichannel analyzer (MCA) (PX4, Amptek Inc., Bedford, MA). The detector and motion stage were operated from a computer using a custom C++ program. Data acquisition was paused during the movement of the stage to the next rotational or translational positions after each 18-s long data collection for each position. The detector system was placed at a 90° angle to the incident x-ray beam to minimize the number of unwanted scattered photons entering the detector. To shield the x-ray detector from x rays coming from outside the field of view, a conically shaped lead shield with an opening end of 5 mm diameter was built and used to cover the sensitive element. Meanwhile, a second x-ray detector operating in current mode could be placed behind the water phantom along the beam direction to provide transmission measurements [Fig. 2a].
Figure 2.
(a) Schematic of the experimental setup including the filtered x-ray source, water phantom, and CdTe detector. (b) Photograph of the imaging system setup. A water phantom containing different concentrations of cisplatin insertion was moved on a rotation/translation stage while being irradiated by a narrow, filtered x-ray pencil beam. At each position, the XRF photons were collected with a CdTe detector. There were five lead bricks in Fig. 3b. The pencil beam was formed by the second and third lead bricks (from left to right in the figure), the other three bricks were used to block and shield the scatter from x-ray source.
Spectrum analysis and sinogram generation
The raw data measured in an XFCT scan consist of a series of spectra, each spectrum corresponding to a beam position. The spectra included fluorescence peaks from cisplatin as well as background from scattered photons. Considering the low penetration of L-shell XRF, we only focused on acquiring K-shell XRF peaks (Table 1) to take advantage of the strong fluorescence yields as well as the deep tissue penetration of the emitted x rays.
Table 1.
Critical absorption and emission energies for photoelectric absorption and x-ray fluorescence emission.
| |
|
Iodine (I) |
Gadolinium (Gd) |
Platinum (Pt) |
|---|---|---|---|---|
| Atomic number (Z) | 53 | 64 | 78 | |
| Critical absorption | Kab | 33.164 | 50.229 | 78.379 |
| energies (keV) | LIab | 5.190 | 8.393 | 13.873 |
| LIIab | 4.856 | 7.940 | 13.268 | |
| LIIIab | 4.559 | 7.252 | 11.559 | |
| Emission energies | Kβ2 | 33.016 | 49.961 | 77.866 |
| from x-ray | Kβ1 | 32.292 | 48.718 | 75.736 |
| fluorescence (keV)1 | Kα2 | 28.610 | 42.983 | 66.820 |
| Kα1 | 28.315 | 42.280 | 65.111 | |
| Lγ1 | 4.800 | 7.788 | 12.939 | |
| Lβ2 | 4.507 | 7.102 | 11.249 | |
| Lβ1 | 4.220 | 6.714 | 11.069 | |
| Lα2 | 3.937 | 6.059 | 9.441 | |
| Lα1 | 3.926 | 6.027 | 9.360 | |
| Peaks identified from | Kβ2 | 32.42 | 48.87 | …2 |
| XRF imaging (keV) | Kβ1 | |||
| Kα2 | 29.00 | 43.13 | 66.89 | |
| Kα1 | 65.59 |
The emission energies are based on transition relations: Kα1 = Kab − LabIII; Kα1 = Kab − LIIab; Kβ1 = Kab − MIIIab, etc.
The Kβ peak of Pt (77.87 and 75.74 keV) is only detectable in the high concentration of Pt and it is not clearly defined in the low concentration of Pt. Thus, it was not used for data processing to relate fluorescence output to Pt concentration within the phantom.
The spectrum measured for each beam position includes the K-shell XRF peaks from cisplatin superimposed on a broad background of scattered photons. To estimate the concentrations of cisplatin from the spectral measurements, the scatter background in each energy window must be removed before XRF peaks can be isolated.
Energy windows were defined for the XRF peaks of cisplatin as follows: Pt: 64.0–66.1 and 66.1–68.5 keV (Table 1). A cubic spline function was used to fit the background counts for these energy windows. The net number of counts in the peaks was then calculated using:
| (1) |
where k is the element of interest (e.g., cisplatin in this study), Mk is the summation of the measured number of counts over the energy window for element k, and Bk is the fitted number of counts from the third-degree polynomial (fitted background counts) in energy window for element k.
The number of counts Nk corresponds to a line integral for a particular element along the beam (e.g., for 3.6% cisplatin, Nk = 22041 counts; for 0.05% gadolinum, Nk = 27682 counts; for 3.2% iodine, Nk = 17490 counts). By processing spectra corresponding to different beam positions, a sinogram was generated for each of the elements present in the phantom using 30 radial positions and 31 angles.
Image reconstruction
The image formation process is similar to that of single photon emission computed tomography (SPECT) with parallel-hole collimators. The number of XRF photons detected at a given beam position is related to the line integral of the elemental distribution within the phantom. An approximate attenuation correction was applied to the phantom sinogram to compensate for the exponential attenuation of the excitation x-ray beam and the emitted XRF signal with phantom position. The excitation beam attenuation was modeled by an exponential fluence fall-off using the linear attenuation coefficient of water at 80 keV. Attenuation of the fluorescent emission was modeled in a similar fashion, by computing the distance traveled in water by the fluorescent photon. For the purpose of attenuation correction, it was assumed that measured fluorescent photons do not elastically scatter in the phantom. The distributions and concentrations of each individual element were reconstructed with 20 iterations of the maximum-likelihood expectation maximization (ML-EM) algorithm, which models the physical response of the imaging system.12, 13, 14, 15, 16
Multiplexed imaging of cisplatin, Gd, and I using XFCT
To demonstrate the capability of multiplexed imaging of XFCT, a water phantom containing cisplatin, Gd, and I insertions was prepared. The dimensions of the phantom and the insertions were the same as Fig. 1. The insertions consisted of 2% (w/v) saline solutions of cisplatin, Gd, and I alone and a mixture of these three elements. The water phantom was gone through the procedures of image acquisition, spectrum analysis, sinogram generation, and image reconstruction as described above. Energy windows were defined for the XRF peaks of the three elements of interest as follows: Pt: 64.0–66.1 and 66.1–68.5 keV; Gd: 40.3–45.0 and 47.3–49.9 keV; I: 24.6–30.3 and 31.1–34.3 keV (Table 1).
Linearity
The linearity between the XRF count values and various concentrations of Pt, Gd, and I (w/v) was also investigated. Serial dilutions were performed for each element and inserted into the water phantom. The phantom was placed in a 150 kV, 20 mA x-ray beam and imaged with a CdTe detector as described above. The peaks for each element were plotted as a function of the known elemental concentration.
X-ray dose from XFCT imaging
Micro LiF thermoluminescent dosimeters (TLDs) were used to estimate the radiation dose of an XFCT imaging scan. The dimension of dosimeter is 1 × 1 × 1 mm3 (Harshaw TLD-100, Thermo Fisher Scientific Inc., Waltham, MA). Two sets of three TLD microcubes were used for the reference and the XFCT imaging dose measurements, respectively. For the reference dose measurement, an open-field TLD measurement was used, i.e., the TLDs were placed at the center of a water phantom and exposed to an unfiltered and noncollimated x-ray beam (open field, 150 keV, 20 mA). A dose conversion factor was determined by normalizing the open-field TLD reading to the absolute dose measured under the same condition with an Accredited Dosimetry Calibration Laboratory (ADCL) calibrated Farmer ionization chamber (Model No. TN30006-0368, PTW, Freiburg, Germany). To measure the XFCT imaging dose, the TLDs were placed at the center of the water phantom (Fig. 2). The luminescent signals in TLDs were read out by an automatic dosimetry reader (Harshaw 5500 TLD reader, Solon, OH) after a five-segment preheating process using a TLDO annealing oven (PTW, Freiburg, Germany). The imaging dose for the scan was computed by averaging three TLD readings and using the dose conversion factor.
RESULTS AND DISCUSSION
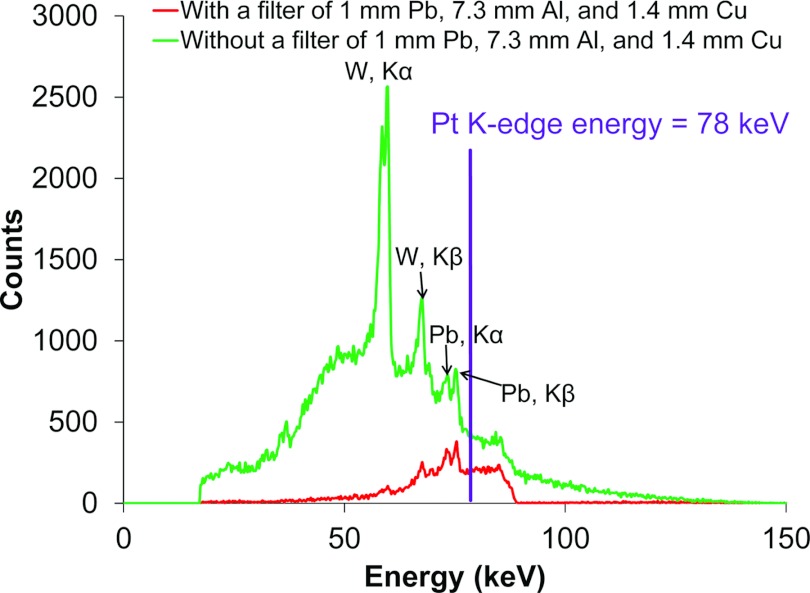
Figure 3 shows the spectra of the incident pencil beam after collimation and filtration measured by the CdTe detector along the x-ray beam direction. Incident x-ray photons with energies below the K-absorption energies of Pt (Table 1) not only create an unwanted scatter background, but also increase the dose deposited in the phantom. As shown in Table 1, x-ray photons above the Pt K-edge energy (78 keV) can be used to excite the Pt, Gd, and I XRF photons simultaneously. A filter with 1 mm thick Pb, 7.3 mm Al, and 1.4 mm Cu was found to efficiently remove x-ray photons below the K-edge of Pt while sustaining a sufficient x-ray fluence.
Figure 3.
A filtered x-ray beam was used for the XFCT imaging acquisition procedure. The x-ray source operated at 150 keV, 20 mA was filtered by a filter of 1 mm Pb, 7.3 mm Al, and 1.4 mm Cu. The Pt K-edge energy is shown as a vertical line. The peaks in the figure were Kα and Kβ peaks from the tungsten (W) in the x-ray tube (59 and 67 keV) as well as Kα and Kβ peaks from the lead (Pb) brick (72 and 74 keV).
Figure 4 is the result of using XFCT to image spatial distribution and concentration of cisplatin. The water phantom contained three Eppendorf tubes with cisplatin concentrations of 0.5%, 1.0%, and 2.0%. The signal intensity varied with cisplatin concentration showing in the reconstructed image. The lowest concentration (0.5% cisplatin) was still visible in Fig. 4.
Figure 4.
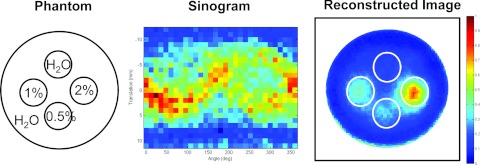
Reconstructed image of the water phantom embedded with different concentrations of cisplatin. (Left) A diagram of the phantom; (middle) sinogram generated from XRF peaks of cisplatin in the acquired spectra; (right) reconstructed image using ML-EM algorithm.
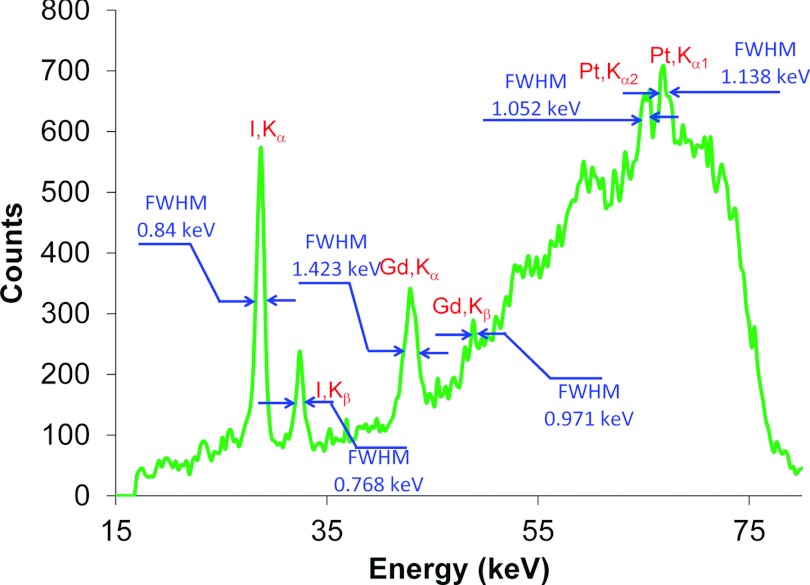
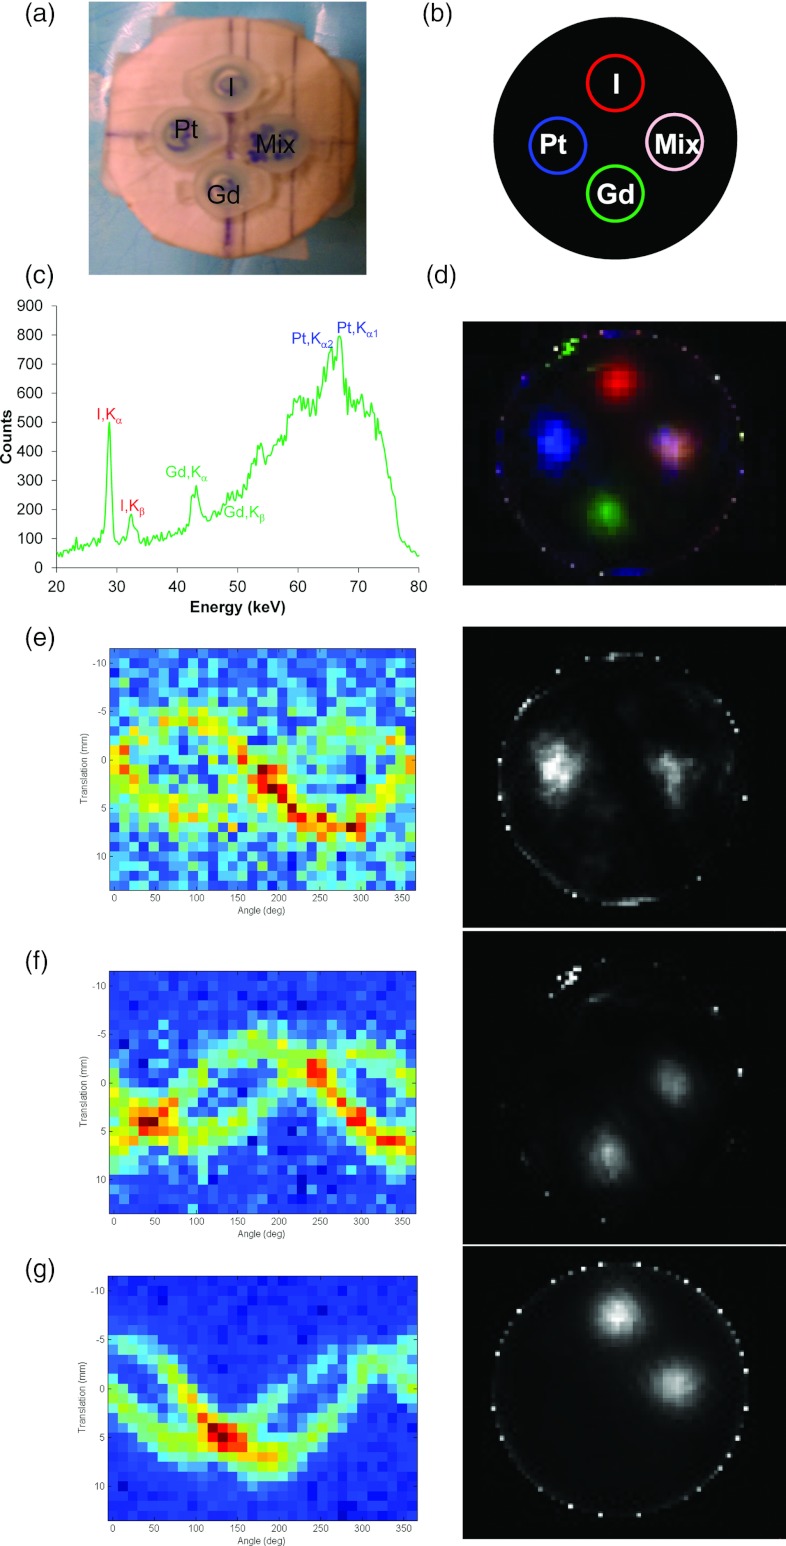
To demonstrate the capability of multiplexed imaging using XFCT, a water phantom embedded with 2% cisplatin, Gd, and I insertions was scanned using the imaging geometry described above. Figure 5 shows a representative XRF spectrum acquired using the line-by-line scan mode. The XRF spectrum showed the sharp peaks characteristic for Pt, Gd, and I. The full width at half maximum (FWHM) for each peak was also measured (Fig. 5). The FWHM values of all these peaks were much smaller than the average peak-to-peak separation, suggesting that multiple elements could be used to probe different phenotypes of Pt-based chemotherapy simultaneously in vivo.
Figure 5.
A representative spectrum showing multiplexed detection in the water phantom of a mixture of 2% Pt, Gd, and I solutions.
XRF peaks in the spectra were processed into a sinogram for each element and reconstructed with 20 iterations of ML-EM. The distribution and concentration (correlated with the image intensity) of every element is clearly identified on the reconstructed images (Fig. 6). Furthermore, all three elements were properly detected when mixed together. In addition, if an x-ray transmission detector was placed downstream of the phantom, a transmission image could be simultaneously obtained, which would provide auxiliary data for attenuation correction and morphological information. Here we used a cone-beam CT scanner to simulate such a capability (Fig. 7).
Figure 6.
Reconstructed XFCT multiplexed images of 2% (w/v) Pt, Gd, and I solution embedded in a water phantom. (a) A photograph of the phantom; (b) a diagram of the phantom showing the pseudocolors for different components in the XRF image; (c) XRF spectrum from one scanning position; (d) multicolor overlay of the reconstructed XFCT image (the spatial positions of different insertions in the water phantom – upper: I; lower: Gd; left: cisplatin; right: the mixture of these three elements). (e)–(g) For the three elements of interest [(e) Pt; (f) Gd; (g) I], XRF peaks in the spectra were processed into a sinogram (left column) for each element and reconstructed with ML-EM (right column).
Figure 7.

Overlay of XFCT and x-ray transmission CT images of the phantom. Pseudocolors are used for different components in the XRF image. The spatial positions of different insertions in the water phantom – upper: I; lower: Gd; left: cisplatin; right: the mixture of these three elements. The measured Hounsfield unit (HU) for each component in the transmission CT was water 2 HU, Pt 1301 HU, I 1893 HU, Gd 1042 HU, and mixture 2241 HU.
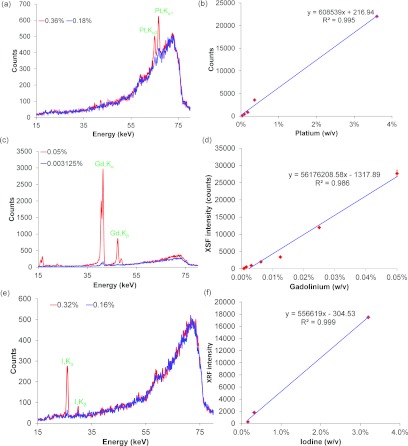
Figures 8a, 8c, 8e show the XRF spectra for different concentrations of Pt, Gd, and I solutions, respectively. The amplitudes of the Pt Kα2 and Kα1 peaks [Fig. 8a], the Gd Kα and Kβ peaks [Fig. 8c], as well as the I Kα and Kβ peaks [Fig. 8e] were proportional to the concentration of Pt, Gd, and I solution, respectively. The XRF intensity showed a highly linear response with respect to elemental concentrations ( = 0.995, = 0.986, = 0.999). The x-ray dose from the entire XFCT imaging procedure was also measured with TLDs and found to be 77 cGy at the center of the phantom.
Figure 8.
The representative XRF spectra of two different concentrations: (a) Pt (0.36% and 0.18%, w/v); (c) Gd (0.05% and 0.003125%, w/v); (e) I (0.32% and 0.16%, w/v). A linear relationship between the XRF intensity and the concentrations of the element solution was found: (b) Pt (0.36%–0.18%, w/v); (d) Gd (0.05%–0.00078%, w/v); (f) I (3.2%–0.16%, w/v).
The most important criterion to develop XFCT imaging strategy for monitoring the spatial distribution of platinum-based drugs is to improve the lower limit of detection while keeping the radiation dose as low as possible. With the current design, scattering inside the phantom and surrounding materials leads to a broad and large background noise in the energy spectrum. This background thus reduced the signal to noise ratio. One effective strategy to improve the minimum detection limit is to use a polarized and monochromatic x-ray source to excite the XRF signals.17, 18, 19 Monochromatic beams produced with synchrotron sources are known to give higher contrast for K-shell XRF signal than clinical polychromatic x-ray sources.20 A quasimonochromatic x-ray beam obtained from proper conversion of a clinical polychromatic x-ray beam will help to improve the current detection limit of platinum drugs by shifting Compton scattering peaks (background noise) away from the signals of interest, i.e., the K-shell platinum XRF peaks, in the acquired energy spectrum.19, 21, 22
Imaging time could be a major concern in the current design using a first-generation CT geometry because the beams are acquired sequentially. To further reduce the acquisition time, parallel imaging can be performed using an x-ray photon counting detector array and multiple simultaneous excitation pencil beams. Currently, a new imaging detection scheme using a fan beam to excite the platinum drugs and a pixelated cadmium zinc telluride (CZT) photon-counting detector array to detect XRF photons is under investigation in order to improve signal to noise ratio. The improvement can also be made in XFCT by using a cone beam geometry.23 Future work includes optimizing the imaging geometry using a polarized x-ray source (to reduce the interference of scatter photons17, 19, 24), and a pixelated CZT photon-counting detector panel (to shorten imaging time) with square-hole pixelated collimator. The spectrum and data analysis algorithms will also be improved.
CONCLUSIONS
We have demonstrated the capability of XFCT to image the spatial distribution of cisplatin and to quantify its concentration in a phantom. The number of XRF counts produced is proportional to the concentration of cisplatin, which allows for accurate quantification of platinum-based chemodrugs. With further improvement on the optimal design of the current system, it is expected that XFCT could be used to monitor the spatial distribution of Pt drugs in the future.
ACKNOWLEDGMENTS
This work was supported by grants from the Friends for an Earlier Breast Cancer Test Foundation, NIH/NCI (Grant Nos. R01CA133474 and R21CA153587), and NSF (Grant No. 0854492).
References
- Koberle B., Tomicic M. T., Usanova S., and Kaina B., “Cisplatin resistance: Preclinical findings and clinical implications,” Biochim. Biophys. Acta 1806, 172–182 (2010). 10.1016/j.bbcan.2010.07.004 [DOI] [PubMed] [Google Scholar]
- Liang X. J., Meng H., Wang Y., He H., Meng J., Lu J., Wang P. C., Zhao Y., Gao X., Sun B., Chen C., Xing G., Shen D., Gottesman M. M., Wu Y., Yin J. J., and Jia L., “Metallofullerene nanoparticles circumvent tumor resistance to cisplatin by reactivating endocytosis,” Proc. Natl. Acad. Sci. U.S.A. 107, 7449–7454 (2010). 10.1073/pnas.0909707107 [DOI] [PMC free article] [PubMed] [Google Scholar]
- Stewart D. J., “Mechanisms of resistance to cisplatin and carboplatin,” Crit. Rev. Oncol. Hematol. 63, 12–31 (2007). 10.1016/j.critrevonc.2007.02.001 [DOI] [PubMed] [Google Scholar]
- Perez R. P., “Cellular and molecular determinants of cisplatin resistance,” Eur. J. Cancer 34, 1535–1542 (1998). 10.1016/S0959-8049(98)00227-5 [DOI] [PubMed] [Google Scholar]
- Chen J., Emara N., Solomides C., Parekh H., and Simpkins H., “Resistance to platinum-based chemotherapy in lung cancer cell lines,” Cancer Chemother. Pharmacol. 66, 1103–1111 (2010). 10.1007/s00280-010-1268-2 [DOI] [PMC free article] [PubMed] [Google Scholar]
- Ferguson P. J., “Mechanisms of resistance of human tumours to anticancer drugs of the platinum family: A review,” J. Otolaryngol. 24, 242–252 (1995). [PubMed] [Google Scholar]
- Harries M. and Gore M., “Part II: Chemotherapy for epithelial ovarian cancer-treatment of recurrent disease,” Lancet Oncol. 3, 537–545 (2002). 10.1016/S1470-2045(02)00847-1 [DOI] [PubMed] [Google Scholar]
- Ozols R. F., “Ovarian cancer, Part II: Treatment,” Curr. Probl. Cancer 16, 61–126 (1992). [PubMed] [Google Scholar]
- Cheong S. K., Jones B. L., Siddiqi A. K., Liu F., Manohar N., and Cho S. H., “X-ray fluorescence computed tomography (XFCT) imaging of gold nanoparticle-loaded objects using 110 kVp x-rays,” Phys. Med. Biol. 55, 647–662 (2010). 10.1088/0031-9155/55/3/007 [DOI] [PubMed] [Google Scholar]
- Jones B. L. and Cho S. H., “The feasibility of polychromatic cone-beam x-ray fluorescence computed tomography (XFCT) imaging of gold nanoparticle-loaded objects: A Monte Carlo study,” Phys. Med. Biol. 56, 3719–3730 (2011). 10.1088/0031-9155/56/12/017 [DOI] [PubMed] [Google Scholar]
- Bazalova M., Kuang Y., Pratx G., and Xing L., “Investigation of X-ray fluorescence computed tomography (XFCT) and K-Edge imaging,” IEEE Trans. Med. Imaging 31, 1620–1627 (2012). 10.1109/TMI.2012.2201165 [DOI] [PubMed] [Google Scholar]
- Shepp L. A. and Vardi Y., “Maximum likelihood reconstruction for emission tomography,” IEEE Trans. Med. Imaging 1, 113–122 (1982). 10.1109/TMI.1982.4307558 [DOI] [PubMed] [Google Scholar]
- Bruyant P. P., “Analytic and iterative reconstruction algorithms in SPECT,” J. Nucl. Med. 43, 1343–1358 (2002). [PubMed] [Google Scholar]
- Pratx G., Carpenter C. M., Sun C., and Xing L., “X-ray luminescence computed tomography via selective excitation: A feasibility study,” IEEE Trans. Med. Imaging 29, 1992–1999 (2010). 10.1109/TMI.2010.2055883 [DOI] [PubMed] [Google Scholar]
- Pratx G., Carpenter C. M., Sun C., Rao R. P., and Xing L., “Tomographic molecular imaging of x-ray-excitable nanoparticles,” Opt. Lett. 35, 3345–3347 (2010). 10.1364/OL.35.003345 [DOI] [PubMed] [Google Scholar]
- Lange K. and Carson R., “EM reconstruction algorithms for emission and transmission tomography,” J. Comput. Assist. Tomogr. 8, 306–316 (1984). [PubMed] [Google Scholar]
- Lewis D. G., “Optimization of a polarized source for in vivo x-ray fluorescence analysis of platinum and other heavy metals,” Phys. Med. Biol. 39, 197–206 (1994). 10.1088/0031-9155/39/1/012 [DOI] [PubMed] [Google Scholar]
- Schmitz R., Bingölbali A., Hussain A., and MacDonald C. A., “Development of polarized and monochromatic x-ray beams from tube sources,” Proc. SPIE 7077, 70770Y-1–70770Y-8 (2008). 10.1117/12.797278 [DOI] [Google Scholar]
- Ali P. A., Al-Hussany A. F., Bennett C. A., Hancock D. A., and El-Sharkawi A. M., “Plane polarized x-ray fluorescence system for the in vivo measurement of platinum in head and neck tumours,” Phys. Med. Biol. 43, 2337–2345 (1998). 10.1088/0031-9155/43/8/024 [DOI] [PubMed] [Google Scholar]
- Ricketts K., Castoldi A., Guazzoni C., Ozkan C., Christodoulou C., Gibson A. P., and Royle G. J., “A quantitative x-ray detection system for gold nanoparticle tumour biomarkers,” Phys. Med. Biol. 57, 5543–5555 (2012). 10.1088/0031-9155/57/17/5543 [DOI] [PubMed] [Google Scholar]
- Jost G., Mensing T., Golfier S., Lawaczeck R., Pietsch H., Hutter J., Cibik L., Gerlach M., Krumrey M., Fratzscher D., Arkadiev V., Wedell R., Haschke M., Langhoff N., Wust P., and Ludemann L., “Photoelectric-enhanced radiation therapy with quasi-monochromatic computed tomography,” Med. Phys. 36, 2107–2117 (2009). 10.1118/1.3125137 [DOI] [PubMed] [Google Scholar]
- Busch H. v., Harding G., Martens G., Schlomka J.-P., and Schweizer B., “Investigation of externally activated x-ray fluorescence tomography for use in medical diagnostics,” Proc. SPIE 5745, 90–101 (2005). [Google Scholar]
- Jones B. L., Manohar N., Reynoso F., Karellas A., and Cho S. H., “Experimental demonstration of benchtop x-ray fluorescence computed tomography (XFCT) of gold nanoparticle-loaded objects using lead- and tin-filtered polychromatic cone-beams,” Phys. Med. Biol. 57, N457–N467 (2012). 10.1088/0031-9155/57/23/N457 [DOI] [PMC free article] [PubMed] [Google Scholar]
- Borjesson J., Alpsten M., Huang S., Jonson R., Mattsson S., and Thornberg C., “In vivo X-ray fluorescence analysis with applications to platinum, gold and mercury in man—Experiments, improvements, and patient measurements,” Basic Life Sci. 60, 275–280 (1993). [DOI] [PubMed] [Google Scholar]


