Abstract
Background: Activation of the sympathetic nervous system is an important feature in hypertension and congestive heart failure. A strategy for directly modulating sympathetic nerve function is to reduce the biosynthesis of norepinephrine (noradrenaline) via inhibition of dopamine-β-hydroxylase (DβH).
Objective: To assess the safety, tolerability, and pharmacokinetics of etamicastat (BIA 5–453), a new DβH inhibitor, following repeated dosing.
Methods: A double-blind, randomized, placebo-controlled study was conducted in healthy young male volunteers. Participants received once-daily doses of placebo or etamicastat 25, 50, 100, 200, 400, or 600 mg, for 10 days.
Results: Etamicastat underwent N-acetylation to its metabolite BIA 5–961. Etamicastat and BIA 5–961 maximum concentrations were achieved at 1–3 and 2–4 hours, respectively, after dosing. Elimination half-lives ranged from 18.1 to 25.7 hours for etamicastat and 6.7 to 22.5 hours for BIA 5–961. Both etamicastat and BIA 5-961 followed linear pharmacokinetics. The extent of systemic exposure to etamicastat and BIA 5–961 increased in an approximately dose-proportional manner, and steady-state plasma concentrations were attained up to 9 days of dosing. Etamicastat accumulated in plasma following repeated administration. The mean observed accumulation ratio was 1.3–1.9 for etamicastat and 1.3–1.6 for BIA 5–961. Approximately 40%of the etamicastat dose was recovered in urine in the form of parent compound and BIA 5–961. There was a high variability in pharmacokinetic parameters, attributable to different N-acetyltransferase-2 (NAT2) phenotype. Urinary excretion of norepinephrine decreased following repeated administration of etamicastat. Etamicastat was generally well tolerated. There was no serious adverse event or clinically significant abnormality in clinical laboratory tests, vital signs, or ECG parameters.
Conclusion: Etamicastat was well tolerated. Etamicastat undergoes N-acetylation, which is markedly influenced by NAT2 phenotype. NAT2 genotyping could be a step toward personalized medicine for etamicastat.
Trial Registration: EudraCT No. 2007-004142-33
Background
Activation of the sympathetic nervous system is a common finding in congestive heart failure and hypertension.[1–6] Adrenoceptor antagonists can be used to inhibit such sympathetic activation, but a proportion of patients do not tolerate the immediate hemodynamic impact, particularly in heart failure.[7] An alternative strategy is to inhibit dopamine-β-hydroxylase (DβH; EC 1.14.17.1), a mono-oxygenase that catalyses the conversion of dopamine into norepinephrine (noradrenaline) in the catecholamine biosynthetic pathway.[8] Gradual sympathetic modulation by DβH inhibitors as opposed to abrupt inhibition observed with β-adrenoceptor blockers (β-blockers) could decrease the hemodynamic negative impact.[9] Furthermore, inhibition of DβH also increases dopamine release,[10,11] which can improve renal function by causing renal vasodilatation and inducing diuresis and natriuresis.[9,12,13]
Several DβH inhibitors have been thus far reported;[14–16] however, both first- and second-generation DβH inhibitors were found to have low potency, poor DβH selectivity, and relevant toxic effects.[17] Nepicastat (RS-25560-197),[8] a third-generation DβH inhibitor, was found to have much greater potency and to be devoid of some of the problems associated with first- and second-generation inhibitors. However, nepicastat was found to cross the blood-brain barrier and to cause potentially significant CNS-related adverse events (AEs).[18] Therefore, there still remains an unmet clinical need for a potent, safe, and peripherally selective DβH inhibitor.
Etamicastat [BIA 5-453; (R)-5-(2-aminoethyl)-1-(6,8-difluorochroman-3-yl)-1,3-dihydroimidazole-2-thione hydrochloride] (figure 1) is intended to act as a reversible inhibitor of peripheral DβH with limited access to the brain.[17] Following oral administration of etamicastat, a blood pressure-lowering effect was observed in studies performed with spontaneously hypertensive rats (SHR). Both the systolic and diastolic blood pressure (but not the heart rate) were decreased in SHR rats in a dose-dependent manner, an effect not observed in normotensive control rats.[19] Chronically administered etamicastat in drinking water also significantly reduced both blood pressure and norepinephrine urinary excretion in SHR rats. In parallel, the urinary excretion of dopamine increased significantly but only in SHR rats.[20]
Fig. 1.

Structural formulae of etamicastat (BIA 5-453) and its acetylated metabolite BIA 5-961.
Etamicastat safety, tolerability, and pharmacokinetics were investigated in a previous entry-into-man single-dose, double-blind, randomized, placebo-controlled study in healthy subjects in the dose range 2–1200 mg.[21] Maximum plasma concentrations (Cmax) occurred at 1–3 hours after dosing. Elimination was bi-compartmental, characterized by a first short early elimination half-life (t1/2) followed by a longer t1/2 of 16–20 hours for etamicastat doses ≥100 mg. In a food interaction study in healthy subjects, the absorption of etamicastat was delayed by the presence of food, but no significant effect was observed in the extent of systemic exposure to etamicastat, as assessed by the area under the plasma concentration-time curve (AUC).[22]
N-Acetyltransferase (NAT) is one of the major hepatic phase II enzymes involved in drug metabolism. Humans express two functional NAT isoforms: NAT1 and NAT2.[23] Data from a previous single-dose study showed that N-acetylation by NAT2 appeared to be the main metabolic pathway of etamicastat.[21] Plasma exposure to the N-acetylated metabolite (BIA 5-961), which was shown to be inactive in in vitro and in vivo preclinical experiments (e.g. following intraperitoneal administration in mice and rats [BIAL unpublished observation]), increased in a dose proportional manner.
A high interindividual variability of pharmacokinetic parameters of etamicastat and BIA 5-961 was observed following single doses of etamicastat in healthy subjects.[21] Pharmacogenomic data showed that such variability is mainly dependent upon the NAT2 phenotype (rapid or slow acetylating ability).[21] Etamicastat was well tolerated at all the investigated dose levels. In the present work, we describe the results of a study aiming to evaluate the safety, tolerability, and pharmacokinetics of multiple-dose regimens of etamicastat in young healthy male volunteers.
Population and Methods
Study Design and Ethics Compliance
This was a phase I, double-blind, randomized, placebo-controlled, multiple-dose study investigating etamicastat oral doses of 25, 50, 100, 200, 400, and 600 mg administered once-daily for 10 days to sequential groups of young healthy male subjects. The study was conducted according to the principles of the Declaration of Helsinki and the Good Clinical Practice (ICH) guidelines. An Independent Ethics Committee (Comité de Protection des Personnes [CCP] Ouest VI, Brest, France) reviewed and approved the study protocol and the subject information. Written informed consent was obtained for each subject prior to enrolment in the study. Subjects were required to sign a specific pharmacogenetic informed consent form to allow NAT1 and NAT2 genotyping and phenotyping.
Participants
Healthy male volunteers aged 18–45 years were eligible for this study. Health status was confirmed by medical history, physical examination and vital signs, electrocardiogram (ECG), and laboratory workup, including hematology, plasma biochemistry, urinalysis, and hepatitis B, hepatitis C, and HIV serology performed at screening.
Volunteers were excluded from participation if they (i) had any clinically relevant disorder; (ii) smoked more than 10 cigarettes per day; (iii) had a history of drug abuse or alcoholism within 1 year prior to admission; (iv) had an ECG corrected QT (QTc) interval reading at screening or enrolment >450 ms; (v) had positive serologic results for HIV antibodies, hepatitis B surface antigen, and/or hepatitis C virus antibodies; (vi) had positive results of urine drug screen (amphetamines, barbiturates, benzodiazepines, cannabinoids, cocaine, methadone, opiates, 3,4-methylenedioxy-methamphetamine [ecstasy]) at screening and admission; (vii) had used any investigational drug within 90 days or prescription drug within 30 days prior to admission; (viii) had consumed any caffeine-containing products (e.g. coffee, tea, chocolate, or soda) in excess of six cups per day (or equivalent), grapefruit, grapefruit-containing products, or alcoholic beverages within 72 hours prior to admission; or (ix) had used any over-the-counter drugs including herbal supplements (except for the occasional use of acetaminophen [paracetamol], acetylsalicylic acid [aspirin] and vitamins within the recommended daily allowance) within 7 days prior to admission. No concomitant medication was allowed during the study unless required to treat an AE.
Interventions
Participants underwent health status screening within 28 days before admission to the study. Following confirmation of eligibility, within each group of eight volunteers, two subjects were randomized to receive placebo and the remaining six subjects to receive etamicastat. Etamicastat doses of 25, 50, 100, 200, 400, and 600 mg were investigated in ascending order and the decision to proceed to the next higher dose was made on the basis of tolerability assessments of the previous dose level. Due to the occurrence of a maculopapular rash of probable infectious origin in three of eight subjects in group 4 (placebo/etamicastat 200 mg), this group was repeated to rule out drug hypersensitivity before escalating to the next dose level.
Subjects were admitted to the research facility from day -2 (2 days before the first dose of investigational product) until approximately 72 hours after the last dosing. Subjects were then discharged from the research facility and instructed to return for a follow-up visit 4–7 days later. At admission, medical history, physical examination, and laboratory safety tests were updated. Supine and standing blood pressure and heart rate measurements and computerized 12-lead ECG recordings were obtained at frequent intervals during admission. Clinical laboratory tests were repeated on days 4 and 10, and 72 hours after the last dose (discharge). At the follow-up visit, the medical history was updated and clinical laboratory safety tests performed.
Etamicastat was administered once daily, in the morning (between 7:30am and 9:00am), for 10 days (days 1–10). Capsules of etamicastat or placebo identical in appearance were used. The doses of investigational product were administered with 250 mL of water following an overnight fasting of at least 8 hours. Subjects remained fasted for at least 4 hours post-dose on day 1 and day 10, and for at least 2 hours post-dose on the remaining treatment days.
A diet low in monoamines was adopted. The following food was not permitted from 3 days prior first dosing through 72 hours after last dosing:
drinks — chocolate, cocoa, beer, alcohol, orange juice;
fruits — banana, pineapple, orange, grapefruit, grapes, strawberries;
dry fruits/nuts — almonds, peanuts, pistachios, prunes;
vegetables — tomatoes, eggplants, broad beans;
meat and fish — smoked fish, liver, brains; and
cheese and vanilla-flavored desserts.
A normal sodium diet (NaCl 7 g/day) was provided.
Safety Assessments
Safety assessments consisted of AE monitoring, physical examinations, vital signs measurements, digital 12-lead ECG recordings, and clinical laboratory tests. During admission, blood pressure and heart rate measurements using a Dinamap ® (GE Healthcare, Chalfont St. Giles, UK) blood pressure monitor using the oscillometric method and 12-lead digital ECG recordings were taken in the supine position, after resting for at least 10 minutes, at the following times: (i) day -1 (the day prior to first dosing) — time 0 (24 hours before first dosing) and 1, 2, 3, 4, 6, 8, 10, 12, and 16 hours after; (ii) day 1 (day of first dosing) — pre-dose and 1, 2, 3, 4, 6, 8, 10, 12, and 16 hours post-dose; (iii) from day 2 to day 9 — pre-dose and 2 hours post-dose; and (iv) day 10 (day of last dosing) – pre-dose and 1, 2, 3, 4, 6, 8, 10, 12, 16, 24, 48, and 72 hours post-dose. Digital ECGs were performed in triplicate (with an interval of 5 minutes, with a difference of at least 1 minute between each of the three recordings). The investigator was responsible for providing the interpretation of all ECGs. The results included heart rate, PR interval, QRS interval, QT interval, and QTc interval, with comments on normality or abnormality. Two corrections of the QT interval were investigated: Fridericia’s correction (QTcF) and Bazett’s correction (QTcB). The primary method of correction was QTcF. A manual reading of the digital ECGs was conducted to assess prolongation of QT/QTc intervals.
All clinical AEs were monitored throughout the entire study period. Their severity (intensity) was categorized according a three-point scale (mild, moderate, and severe), and the causality (potential relationship to drug) was assessed by the investigator before breaking the blinding.
Pharmacokinetic Assessments and Bioanalytical Methods
Blood samples (3 mL) for determination of plasma concentrations of etamicastat and its metabolites were taken, by direct venepuncture or an intravenous catheter, into lithium-heparin tubes at the following times on days 1 and 10: pre-dose, then at 0.5, 1, 2, 3, 4, 5, 6, 8, 10, 12, and 16 hours post-dose. Further blood samples were taken at 24, 36, 48, and 72 hours post-last dose. Pre-dose blood samples were also taken on days 2–9. After collection, blood samples were centrifuged at approximately 1500 g for 10 minutes at 4°C. The resulting plasma was then separated into four aliquots of 250 μL and stored at −80°C until required for analysis. Urine samples for pharmacokinetic assessments were collected at pre-dose and over the intervals 0–4, 4–8, 8–12, and 12–24 hours post-dose on day 1, and at pre-dose and over the intervals 0–4, 4–8, 8–12, 12–24, 24–36, 36–48, 48–60, and 60–72 hours after the last dose (day 10). Four aliquots of 500 μL were prepared and stored at −80°C until required for analysis.
For the preparation of calibration samples, etamicastat and BIA 5-961 were dissolved in methanol to a final concentration of 250 μg/mL (method in plasma) or 1250 μg/mL (method in urine). For the preparation of quality control (QC) samples, a second set of stock solutions was prepared. For calibration and QC samples, working solutions in methanol were added to plasma using a ratio of 2/98 (v/v). For the preparation of the internal standard (ISTD) solution, reference standard (BIA 5-1058; molecular formula C21H21F2N3OS) was dissolved in methanol to a concentration of 1000 μg/mL. Further dilutions to a final concentration of 555 ng/mL were done using methanol.
Plasma samples were vortexed and centrifuged for 20 minutes at approximately 3362 g after unassisted thawing at room temperature. The method involved the addition of 300 μL of acetonitrile/ethanol (50/50, v/v) containing 555 ng/mL of ISTD and 300 μL of acetonitrile to 100 μL of plasma. After protein precipitation at room temperature, samples were centrifuged for 20 minutes at approximately 2773 g and 8°C. The supernatant was transferred into a deep well plate. An aliquot of 10 μL of the supernatant was injected onto the liquid chromatography coupled to mass spectrometric detection (LC-MS/MS) system. The analysis was done by separation with an injection volume of 10 μL (10 μL in a 10 μL sample pool) in reversed phase chromatography (column temperature 50°C) followed by mass detection spectrometry.
Urine samples were vortexed and centrifuged for 20 minutes at approximately 3362 g after unassisted thawing at room temperature. To an aliquot of 20 μL urine, 80 μL lithium-heparin plasma was added and precipitated by 300 μL of ISTD solution. After protein precipitation and short mixing at room temperature, samples were centrifuged for 20 minutes at approximately 2773 g and 8°C. The supernatant (250 μL) was transferred into an ultrafiltration filter plate and centrifuged for about 2 hours at approximately 2773 g and 20°C. An aliquot of 5 μL of the supernatant was injected onto the LC-MS/MS system. The analysis was done by separation with an injection volume of 5 μL (5 μL in a 10 μL sample pool) in reversed phase chromatography (column temperature 50°C) followed by mass detection spectrometry.
Plasma and urine concentrations of etamicastat and its metabolite BIA 5-961 were determined using validated methods consisting of LC-MS/MS. The LC-MS/MS system consisted of a Rheos 2200 pump (Flux Instruments, Basel, Switzerland), a PAL autosampler (CTC Analytics AG, Zurich, Switzerland) and a TSQ Quantum triple-stage quadrupole mass spectrometer (Thermo Fisher Scientific, San Jose, CA, USA). Separation was achieved using a Luna C8 (2), 2.0 × 5.0 mm, 5 μm analytical column (Phenomenex, Torrance, CA, USA), a C8, 2.0 × 5.0 mm, 5 μm precolumn filter (Phenomenex, Torrance, CA, USA), a Gecko 2000 column heater (CIL, Courbevoise, France) at 50°C and a mobile phase (0.5 mL/min) consisting of water containing 1.0% formic acid (phase A) and acetonitrile containing 1.0% formic acid (phase B). The MS detector was operated in positive ion mode.
Calibration curves – over the nominal concentration ranges of 5–5000 ng/mL for plasma assay or 25–25000 ng/mL for urine assay – and a set of QC samples (triplicates over three concentration levels) were analyzed with each batch of study samples. The QC samples were used to monitor the performance of the assay. In plasma, the data for the QC samples showed that the overall imprecision of the method, measured by the coefficient of variation, was ≤6.0% for etamicastat and ≤6.9% for BIA 5-961. The overall accuracy (as the proportion of the determined value in relation to the true or nominal value) ranged from 93.5% to 98.0% for etamicastat, and 93.5% to 98.0% for BIA 5-961. In urine, the overall imprecision was ≤10.0% for etamicastat and ≤7.8% for BIA 5-961, and the overall accuracy ranged from 99.5% to 99.7% for etamicastat and 97.2% to 100.8% for BIA 5-961. The lower limit of quantification of the assay (LLOQ) was 5 ng/mL in plasma and 25 ng/mL in urine. Etamicastat, BIA 5-961 and reference standard (BIA 5-1058) were supplied by BIAL (Laboratory of Chemistry, S. Mamede do Coronado, Portugal).
Pharmacodynamic Assessments
Urine for the assessment of urinary levels of norepinephrine, dopamine, epinephrine and homovanillic acid was collected on day 1 at pre-dose and 0–4, 4–8, 8–12, and 12–24 hours post-dose, and on day 10 at pre-dose and 0–4, 4–8, 8–12, 12–24, 24–36, 36–48, 48–60, and 60–72 hours post-dose. After collection, 3 mL aliquots of acidified urine were prepared and stored at −80°C. The determination of urine levels of catecholamines was carried out by high performance LC with electrochemical detection using a validated method. The LC electrochemical detection system consisted of a pump (Gilson 302) and a stainless steel 5-μm ODS2 column (Biophase; Bioanalytical Systems, West Lafayette, IN, USA), measuring 250 mm in length and 4.6 mm in diameter; samples were injected by means of an automatic sample injector (Triathlon-Spark Holland, Emmen, the Netherlands). The mobile phase was a degassed solution consisting of citric acid (0.1 mmol/L), sodium octylsulfate (0.5 mmol/L), sodium acetate (0.1 mol/L), Na2EDTA (0.17 mmol/L), dibutylamine (1 mmol/L), and methanol (10% v/v), adjusted to pH 3.5 with perchloric acid (2 mol/L), and pumped at a rate of 1.0 mL/min. The detection was carried out electrochemically with a glassy carbon electrode, an Ag/AgCl reference electrode, and an amperometric detector (Intro-Antec Leyden for norepinephrine, dopamine, epinephrine, and Gilson 141 for homovanillic acid); the detector cell was operated at 0.75 V. The lower limits of detection of norepinephrine, dopamine, epinephrine, and homovanillic acid were 22, 19, 37, and 500 ng/L, respectively.
Determination of Subjects NAT1 and NAT2 Genotypes
The NAT1 and NAT2 genes were genotyped for all subjects participating in the current study. Genomic DNA was extracted from total venous blood. For NAT1, eight single nucleotide polymorphisms (SNPs) were analyzed (190 C > T, 445 G > A, 459 G > A, 559 C > T, 560 G > A, 640 T > G, 1088 T > A, and 1095 C > A) and the corresponding genotypes determined. Associated genotypes were defined according to the literature.[17,24] Subjects were classified NAT1 rapid (fast) acetylators if they carried the NAT1*10 (except NAT1*10/*14) or NAT1*11 alleles, normal acetylators if they carried the NAT1*4 or NAT1*3 alleles or the NAT1*10/*14 genotype, and poor (slow) acetylators if they carried the NAT1*14 (except NAT1*10/*14) or NAT1*17 alleles. For NAT2, four coding SNPs were analyzed (191 G > A, 341 T > C, 590 G > A, and 857 G > A) and the corresponding genotypes determined. Associated genotypes were defined according to the literature.[25,26] The NAT2*4 allele encodes for a fully active enzyme and is considered the wild type (rapid acetylator) allele. Subjects were classified NAT2 rapid acetylators if they carried the NAT2*4/*4 allele or the NAT2*4/*5, NAT2*4/*6 or NAT2*4/*7 genotype, and poor acetylators if they carried the NAT2*5/*5, NAT2*6/*6 or NAT2*7/*7 alleles, or the NAT2*5/*6, NAT2*5/*7 or NAT2*6/*7 genotype.
Analyses
For this exploratory study, no formal sample size calculation was performed. Eight subjects per treatment (six subjects assigned to active treatment and two subjects assigned to placebo) are a standard number of subjects per treatment group in early clinical trials in healthy subjects and were considered compatible with a reasonable clinical interpretation and descriptive statistics.
AEs were tabulated and summarized according to the Medical Dictionary for Regulatory Activities (MedDRA). Blood pressure, heart rate, vital signs, and clinical laboratory data were summarized using descriptive statistics. For the laboratory safety data, out-of-range values were flagged in the data listings and a list of abnormal values was presented. Any clinically significant abnormality was considered as an AE.
The following parameters were calculated for supine systolic (SBP) and diastolic (DBP) blood pressure, ECG-measured heart rate and QTcF: maximum observed effect (Emax), time to Emax (tEmax) and area under the effect-time curve over 24 hours (AUCEC). The parameters were summarized using descriptive statistics. Emax and ΔAUCEC (difference in AUCEC in relation to AUCEC on day -1) were compared at day 1 and day 10 between dose groups by using a one-way analysis of variance with dose group as the fixed effect. If global treatment effect was significant, a multiple-comparisons Dunnett’s test was performed to compare each dose group versus placebo. Emax at day 10 was tested versus Emax at day 1 using a paired Student’s t-test in each dose group.
The following pharmacokinetic parameters for etamicastat and its metabolites were derived by non-compartmental analysis from the individual plasma concentration-time profiles: time of occurrence of Cmax (tmax); AUC from time zero to the last sampling time at which concentrations were at or above the limit of quantification (AUCt) and AUC over 24 hours (AUC24), both calculated by the trapezoidal rule, and AUC from time zero to infinity (AUC∞), calculated from AUCt + (Clast/λz), where Clast is the last quantifiable concentration; the apparent terminal rate constant (λz) and corresponding terminal t1/2 calculated from ln 2/λz; observed accumulation ratio (RO), calculated from AUC24 (day 10)/AUC24 (day 1); and theoretical accumulation ratio (RT), calculated from 1/(1 - e-λzητ·τ), where τ is the dosing interval. The volume of distribution (V/F) and the renal clearance of drug from plasma (CLR), calculated from Ae/AUC∞, where Ae is the cumulative amount of drug excreted in the urine, were also derived. Nominal sampling times were used for the pharmacokinetic analysis. Plasma concentrations below the limit of quantification of the assay were taken as zero for all calculations. All calculations were made using raw data.
Summary statistics of all data were reported, as appropriate, using the geometric mean, arithmetic mean, standard deviation (SD), coefficient of variation (CV%), standard error of the mean (SEM), median, and range (minimum and maximum). A nonlinear power model was used to assess dose proportionality of Cmax and AUC24. The relationship is written as a power function: parameter = a · doseb, where a is a constant, b is the proportionality constant, and parameter is Cmax or AUC24. Linearization of this relationship gives: log parameter = log a + log dose · b. The relationship is dose proportional when b = 1. The exponent of the power function, with 95% confidence intervals (95% CI), was fitted to the individual Cmax and AUC24. For determination of time to steady-state of plasma concentrations, a pairwise comparison for pre-dose concentrations between day 2 and day 10 was performed by dose group using a paired Student’s t-test. Values at each period and cumulated values of urinary catecholamines were summarized using descriptive statistics by dose group.
The pharmacokinetic parameters were calculated with WinNonlin (version 5.0.1, Pharsight Corporation, Mountain View, CA, USA). Statistical calculations were performed with SAS ® Software (version 8.2, SAS Institute Inc., Cary, NC, USA). The α risk p-values reported are two-sided and the statistical significance nominal limit was set to 0.05.
Results
Study Population
Of 94 participants screened, 37 were deemed ineligible because they met exclusion criteria or failed to show up at the start of the study. A total of 57 male volunteers, aged 18–45 (median = 30) years were enrolled in the study. The demographic characteristics of the study population by treatment group are summarized in table I. One subject administered placebo withdrew his consent and was replaced. No relevant differences in demographic characteristics were found between treatment groups.
Table I.

Main demographic details by treatment dose group
Safety Results
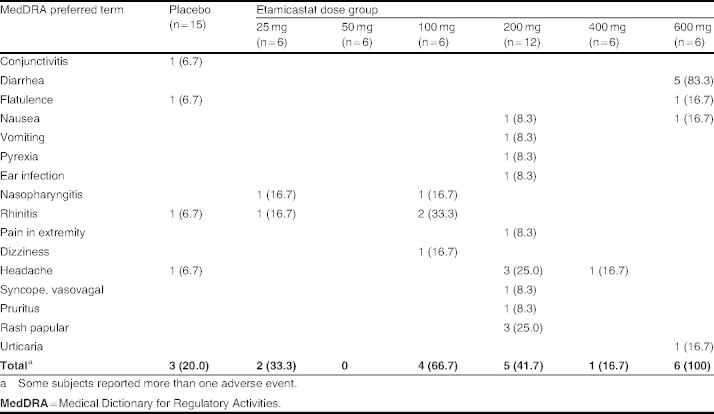
During the course of the study, a total of 32 treatment-emergent AEs were reported by 21 subjects (table II). The most frequent treatment-emergent AE was diarrhea. There were no serious AEs. All AEs were mild to moderate in intensity. An outbreak of maculopapular rash occurred in three subjects administered etamicastat 200 mg. Subjects had elevated antistreptolysin O titers, and antibiotics were prescribed. In the three subjects, histamine, tryptase C3, C4, and C1q were normal, there was no hypereosinophilia and there was a moderate increase of C-reactive protein. Although an infection appeared to be a plausible cause, drug hypersensitivity could not be ruled out. Thus, a decision was made to repeat the placebo/etamicastat 200 mg group before escalating to the subsequent dose level (placebo/etamicastat 400 mg).
Table II.
Number (%) of subjects reporting any treatment-emergent adverse event
Clinical laboratory evaluations indicated no clinically significant abnormality. There was no statistically significant change in QTcF. There was no evidence for prolongation of the QT interval. All QTcF values remained below the limit of 0.450 seconds. There were no apparent trends in ECG parameters over time, and there were no apparent differences between dose groups.
Pharmacokinetic Results
Due to the occurrence of rash, the tenth dose was skipped in two subjects administered etamicastat 200 mg, and the pharmacokinetic profiling planned for day 10 was performed after day 9 dosing. All other subjects of the pharmacokinetic population completed the treatment period as planned.
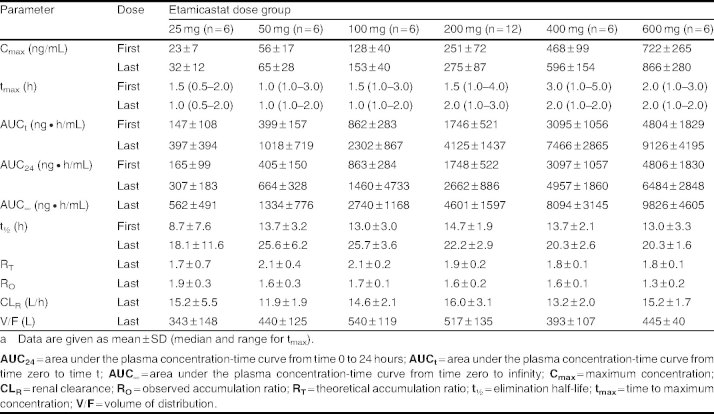
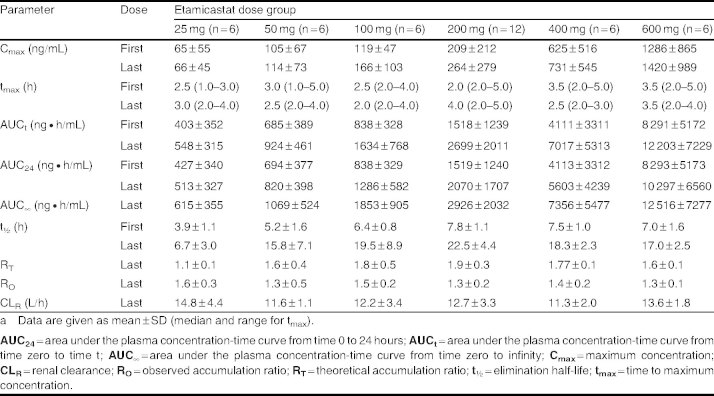
Mean etamicastat plasma concentration-time profiles following the first and last doses of etamicastat are displayed in figure 2, and the corresponding pharmacokinetic parameters are presented in table III. As expected, etamicastat was shown to be metabolized to BIA 5-961. Plasma concentration-time profiles of BIA 5-961 are displayed in figure 3, and the corresponding mean pharmacokinetic parameters are presented in table IV. Figure 4 displays the mean trough (pre-dose) plasma concentrations of etamicastat and BIA 5-961 during the treatment period.
Fig. 2.
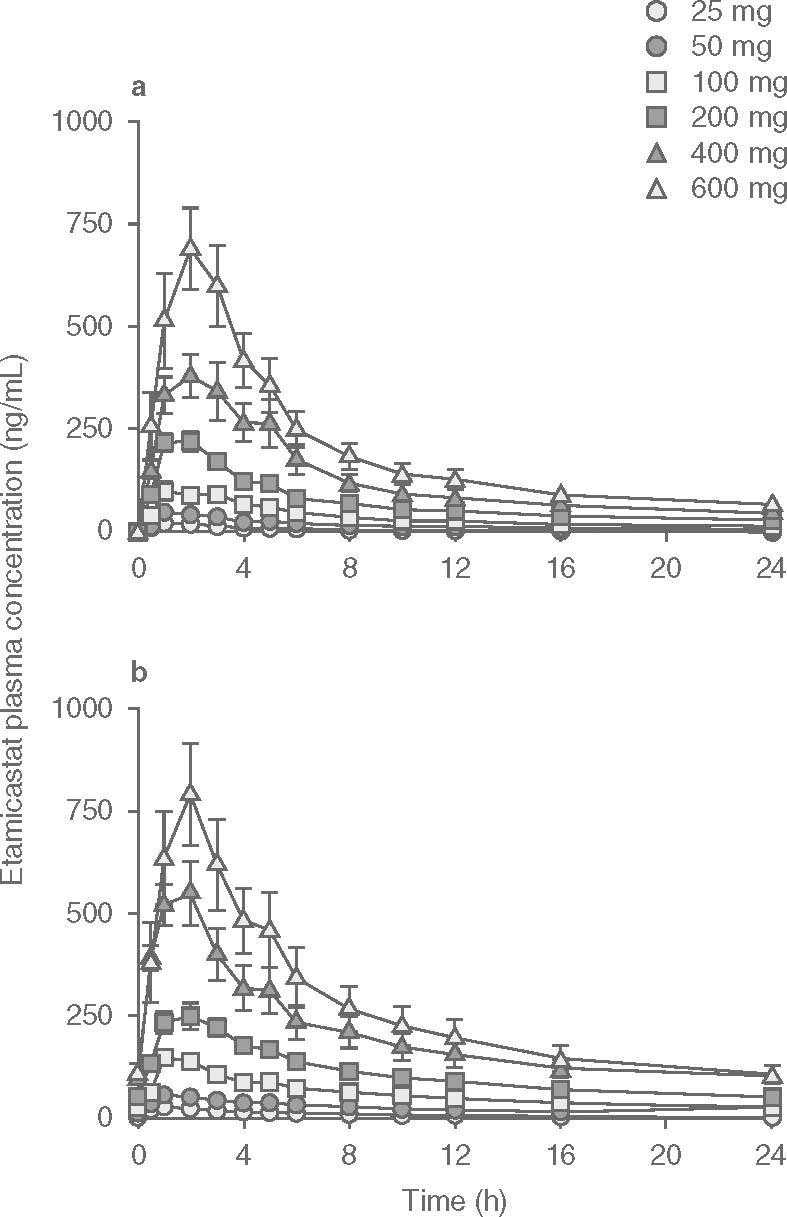
Plasma concentration (mean ± SEM) vs time profiles of etamicastat following single (day 1 []) and repeated (day 10 [b]) oral once-daily administration of etamicastat in the dose range 25–600 mg (etamicastat 200 mg: n = 12; other dose groups: n = 6 per dose group).
Table III.
Pharmacokinetic parameters of etamicastat following the first dose (day 1) and the final dose (day 10) of repeated administration of etamicastat to healthy subjectsa
Fig. 3.
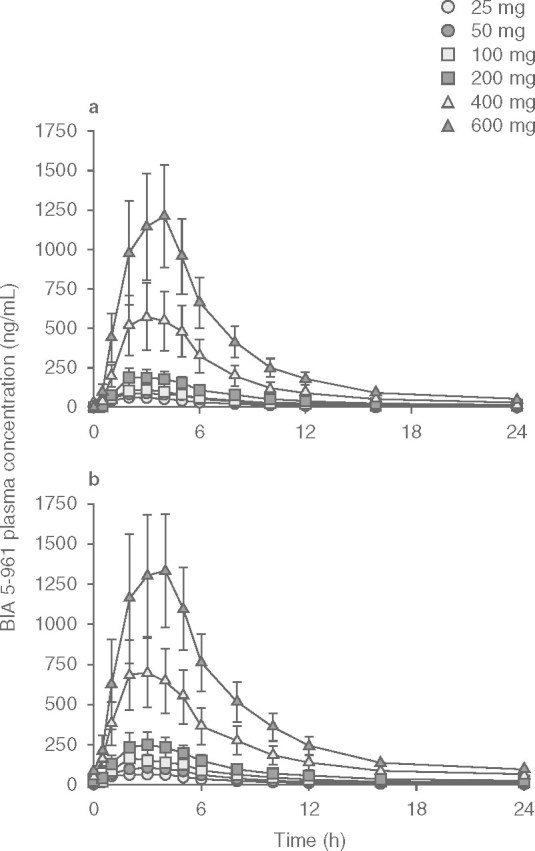
Plasma concentration (mean ± SEM) vs time profiles of BIA 5-961 following single (day 1 []) and repeated (day 10 [b]) oral once-daily administration of etamicastat in the dose range 25–600 mg (etamicastat 200 mg: n = 12; other dose groups: n = 6 per dose group).
Table IV.
Pharmacokinetic parameters of BIA 5-961 following the first dose (day 1) and the final dose (day 10) of repeated administration of etamicastat to healthy subjectsa
Fig. 4.
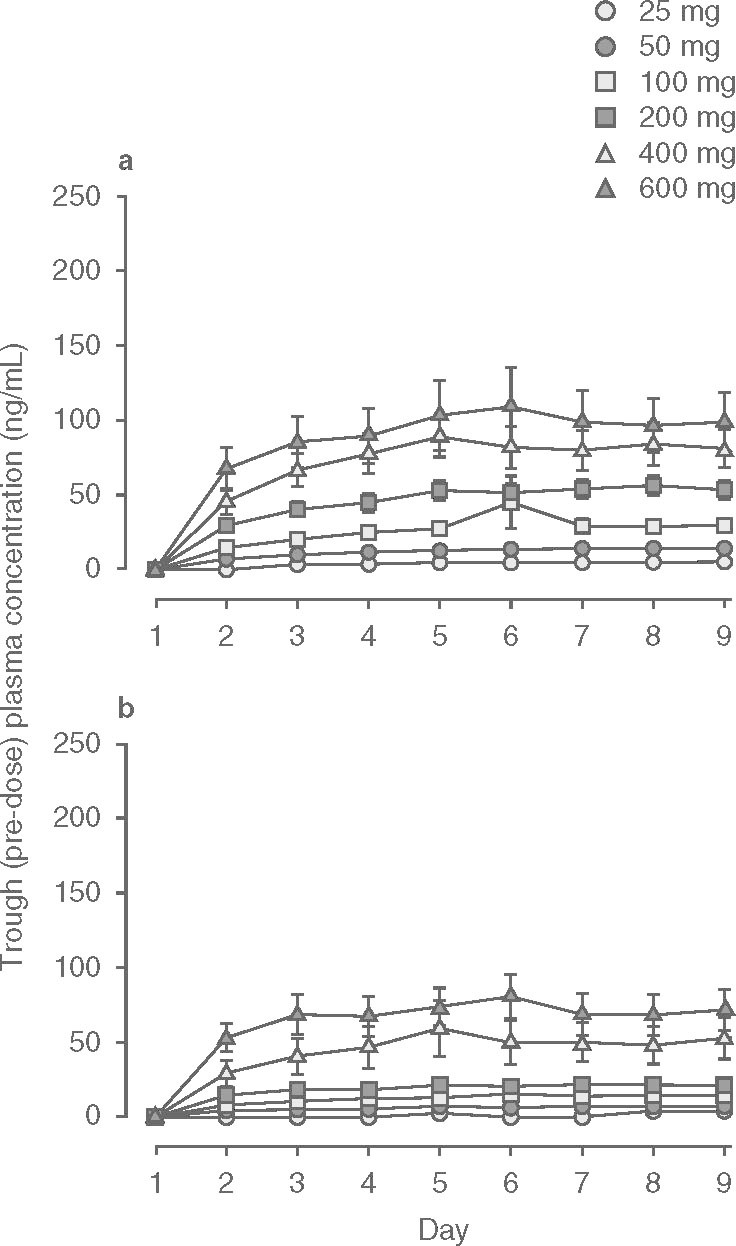
Trough (pre-dose) plasma concentrations (mean ± SEM) of () etamicastat and (b) BIA 5-961 during oral once-daily administration of etamicastat in the dose range 25–600 mg (etamicastat 200 mg: n = 12; other dose groups: n = 6 per dose group).
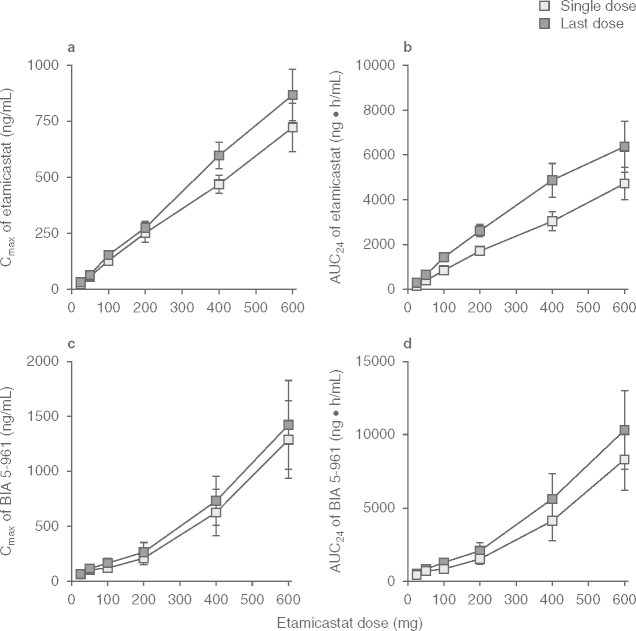
Etamicastat Cmax was reached 1–3 hours post-dose and declined thereafter, with an approximate mean apparent t1/2 of 9–15 hours following the first dose of etamicastat and 18–26 hours following repeated administration. Cmax of BIA 5-961 was reached 2–4 hours post-dose and declined thereafter, with a mean t1/2 of 4–8 hours following the first dose of etamicastat and 7–23 hours following repeated administration. Systemic exposure to etamicastat and BIA 5-961 increased with increasing doses on both day 1 and day 10 (table V and figure 5). The apparent dose-proportional increase in systemic exposure was confirmed by the statistical analysis using an exponential regression model. Also, the comparison of etamicastat and BIA 5-961 pharmacokinetic parameters after log-transformation and dose-normalization showed that Cmax, AUCt and AUC24 following the first dose of etamicastat, and Cmax, AUCt, AUC24, and AUC∞ following the last dose were not significantly different between dose groups.
Table V.

Proportionality of maximum concentration (Cmax) and area under the plasma concentration-time curve from time 0 to 24 hours (AUC24) of etamicastat and BIA 5-961 following the first dose (day 1) and the final dose (day 10) of repeated administration of etamicastat to healthy subjects
Fig. 5.
Maximum plasma concentrations (Cmax) and area under the concentration-time curve from time 0 to 24 hours (AUC24) values (mean ± SEM) of ( and b) etamicastat and (c and d) BIA 5-961 following single (day 1) and repeated (day 10) oral once-daily administration of etamicastat in the dose range 25–600 mg (etamicastat 200 mg: n = 12; other dose groups: n = 6 per dose group).
The RO indicating the extent to which etamicastat accumulated relative to the first dose ranged from 1.3 to 1.9. This ratio was lower than RT, which ranged from 1.7 to 2.1. This is in accordance with the apparent t1/2 of 9–15 hours following etamicastat first dose and 18–26 hours following etamicastat last dose. The RO for BIA 5-961 was also relatively low, ranging from 1.3 to 1.6.
The one-way analysis of variance using trough (pre-dose) etamicastat plasma concentrations from day 2 to day 10 showed that steady state was reached at day 9 (200 mg), day 8 (400 mg) and before day 6 for the remaining dose groups. For BIA 5-961, steady state was reached at day 9 (200 and 600 mg), day 8 (25 mg), and before day 6 for the remaining groups.
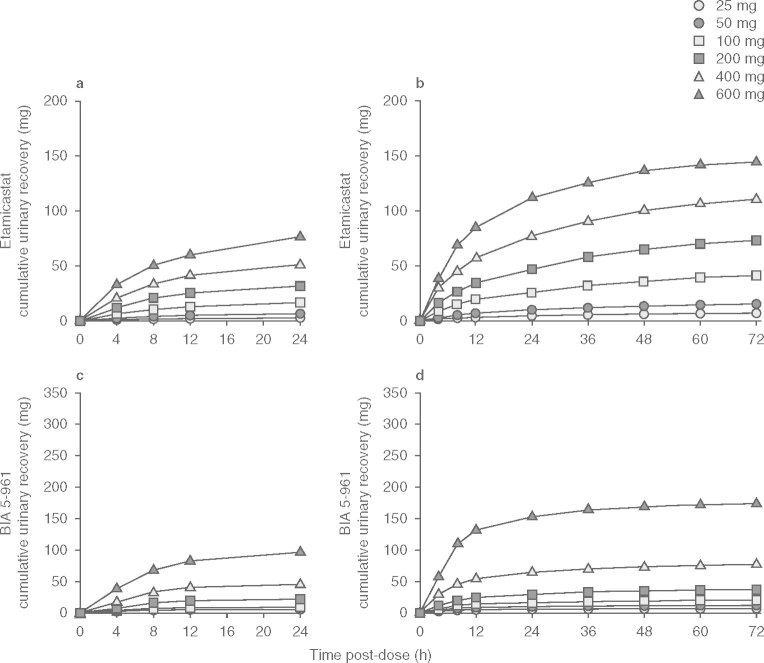
The cumulative amounts of etamicastat and BIA 5-961 recovered in urine are displayed in figure 6. Urine drug recovery occurred predominantly over the first 12 hours after etamicastat administration. The excretion rate of etamicastat ranged from 0.3 ± 0.1 mg/h (25 mg) to 8.5 ± 3.2 mg/h (600 mg) following the first dose and from 0.4 ± 0.2 mg/h (25 mg) to 10.6 ± 2.8 mg/h (600 mg) following the last dose. For BIA 5-961, the excretion rate ranged from 0.7 ± 0.6 mg/h (25 mg) to 10.4 ± 6.9 mg/h (600 mg) and from 0.753 ± 0.560 mg/h (25 mg) to 15.2 ± 9.8 mg/h (600 mg), respectively. Renal clearance was relatively similar at the different dose levels, ranging from 11.9 to 16.0 L/h for etamicastat and from 11.3 to 14.8 L/h for BIA 5-961.
Fig. 6.
Mean cumulative urinary excretion of etamicastat following single (day 1 []) and repeated (day 10 [b]), and BIA 5-961 following single (day 1 [c]) and repeated (day 10 [d]) oral once-daily administration of etamicastat in the dose range 25–600 mg (etamicastat 200 mg: n = 12; other dose groups: n = 6 per dose group).
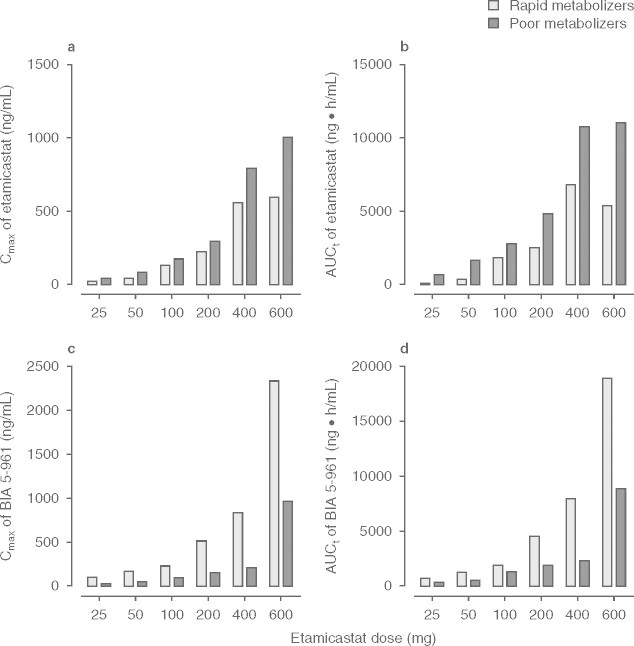
The interindividual variability in the pharmacokinetic parameters was high for both etamicastat and BIA 5-961, with mean CV close to 100% in some parameters. This variability is due to the different subjects’ NAT2 phenotype (fast/slow acetylating ability), which affects the rate of biotransformation of etamicastat into BIA 5-961. Table VI presents the distribution of the different subjects’ NAT1 and NAT2 phenotypes within each etamicastat dose group. No relevant effect of NAT1 phenotype on etamicastat pharmacokinetics was apparent. Etamicastat pharmacokinetics was shown to be markedly affected by the NAT2 status (figure 7). The extent of systemic exposure to etamicastat in NAT2 slow acetylators was 1.5–6.7 times higher than in NAT2 fast acetylators. BIA 5-961 exposure was 1.5–3.5 times higher in rapid NAT2 acetylators. These results explain the high variability observed in the main etamicastat and BIA 5-961 pharmacokinetic parameters.
Table VI.
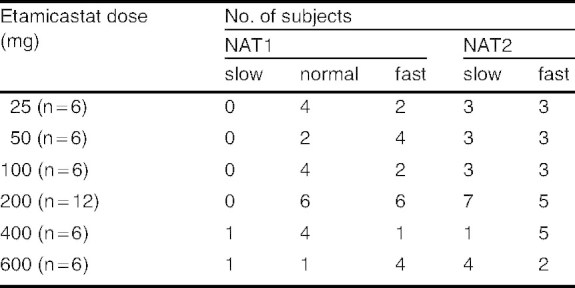
N-acetyltransferase (NAT)-1 and NAT2 phenotype by etamicastat dose group
Fig. 7.
Mean maximum plasma concentrations (Cmax) and area under the concentration-time curve from time zero to the last sampling time at which concentrations were at or above the limit of quantification (AUCt) of ( and b) etamicastat and (c and d) BIA 5-961 in rapid or poor N-acetyltransferase-2 acetylators following single (day 1) and repeated (day 10) oral once-daily administration of etamicastat in the dose range 25–600 mg (etamicastat 200 mg: n = 12; other dose groups: n = 6 per dose group).
Pharmacodynamic Results
The cumulative amounts of norepinephrine recovered in urine over a 24-hour interval post-dose on day 1 (first dose) and day 10 (last dose) are displayed in figure 8. No relevant change from day 1 to day 10 was observed in subjects administered placebo (29.6 ± 12.4 μg on day 10 vs 33.1 ± 10.5 μg on day 1). Following repeated etamicastat administration, urinary excretion of norepinephrine decreased, which is consistent with the claimed DβH inhibitory effect of etamicastat. In relation to the day 1 value, urinary excretion of norepinephrine at day 10 decreased by 24%, 18%, 36%, 34%, 32%, and 34% following repeated administration of etamicastat 25, 50, 100, 200, 400, and 600 mg, respectively. No relevant changes were found in the urinary excretion of homovanillic acid, epinephrine and dopamine in the different dose groups.
Fig. 8.
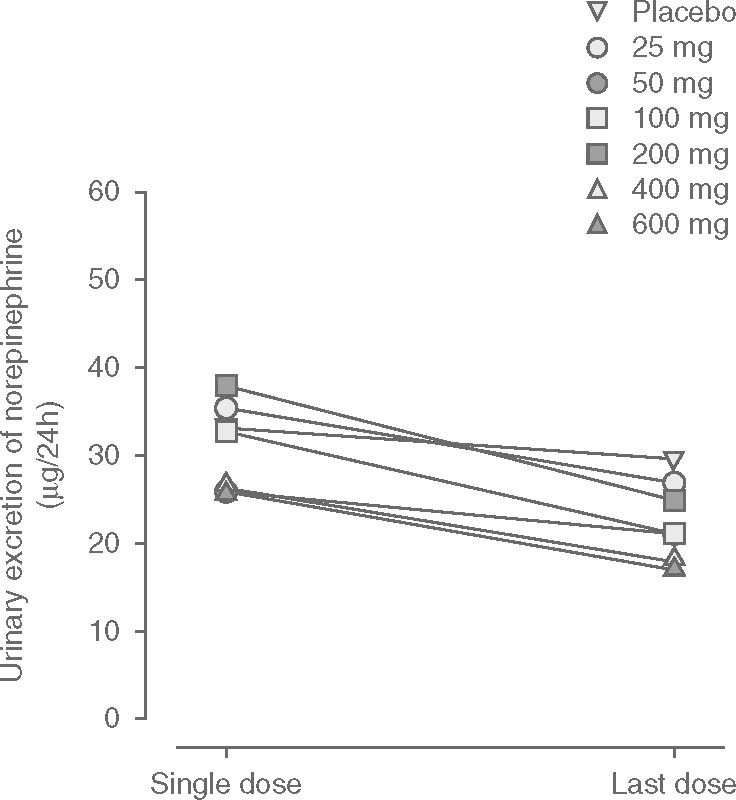
Mean cumulative urinary excretion of norepinephrine (noradrenaline) during a 24-hour period following the first (day 1) and last (day 10) doses of a once-daily regimen of placebo and etamicastat in the dose range 25–600 mg (placebo: n = 14; etamicastat 200 mg: n = 12; other dose groups: n = 6 per dose group).
Due to the expected pharmacologic effect of etamicastat, supine SBP, DBP, and ECG-measured heart rate (HR) measurements were considered as pharmacodynamic variables. Following the first dose of placebo or etamicastat 25, 50, 100, 200, 400, and 600 mg, no significant changes in SBP, DBP, or HR were observed. Following repeated dosing, SBP and HR did not significantly change at any dose levels, but a significant decrease in DBP occurred with etamicastat 100 mg and 200 mg doses. In relation to day 1, DBP Emax and AUCEC decreased by 5.6 mmHg (p < 0.01) and 223 mmHg · h (p < 0.05) following etamicastat 100 mg and by 5.9 mmHg (p < 0.05) and 193 mmHg · h (p < 0.05) following etamicastat 200 mg, respectively.
Discussion
This trial constituted the second study with etamicastat, a new DβH inhibitor, in humans. The objectives of the study were to evaluate the safety, tolerability, and pharmacokinetics of etamicastat in healthy male adults following repeated administration. The study followed a standard design commonly used in studies with identical purposes. Etamicastat administered orally at doses up to 600 mg once daily for 10 days appeared to be well tolerated. All AEs were mild to moderate in intensity. Most subjects (83%) in the 600 mg etamicastat group reported diarrhea as an AE. Diarrhea has also been reported at high etamicastat doses in preclinical studies. DβH gene variants that cause low plasma DβH have also been associated with an increased propensity to report diarrhea.[27] The data show that a marked decrease of DβH activity can predispose to the occurrence of diarrhea. A papular rash of plausible infectious origin occurred in three subjects under treatment with etamicastat 200 mg. There were no serious AEs or clinically significant abnormalities in clinical laboratory tests, vital signs, or ECG parameters.
Consistent with the results from a previous study in which etamicastat single doses of 2–1200 mg were administered to young healthy subjects,[21] etamicastat was shown to be metabolized to its N-acetylated metabolite BIA 5-961 following single and repeated administration of 25–600 mg once-daily doses. Cmax of etamicastat and BIA 5-961 were achieved at 1–3 hours and 2–4 hours after dosing, respectively. Thereafter, etamicastat plasma concentrations declined with a mean apparent t1/2 of 9–15 hours following the first dose and 18–26 hours following the last dose. Estimated t1/2 values for BIA 5-961 were slightly shorter than those of the parent drug. Both etamicastat and BIA 5-961 followed approximate linear pharmacokinetics over the dose range studied. The extent of systemic exposure to etamicastat increased in an approximately dose-proportional manner following single and repeated administration. Etamicastat accumulated in plasma following repeated administration. The mean RO was 1.3–1.9 for etamicastat and 1.3–1.6 for BIA 5-961. The identical accumulation ratio of BIA 5-961 is consistent with the slightly shorter t1/2 of BIA 5-961 compared with that of etamicastat. Steady-state etamicastat and BIA 5-961 plasma concentrations were reached up to 9 days of etamicastat repeated administration.
Approximately 45% of the etamicastat dose was recovered in urine collected up to 24 hours post-dose in the form of parent drug and N-acetylated metabolite. These data are consistent with those from a study aiming to characterize the absorption, distribution, metabolism, and excretion of etamicastat and metabolites following an oral dose of [14C]-labeled etamicastat (BIAL unpublished observation). Eleven days after administration, approximately 95% of the administered radioactivity had been excreted, two-thirds in urine and one-third in feces. Biotransformation of etamicastat occurred mainly via N-acetylation, forming BIA 5-961, the major metabolite. However, glucuronidation, oxidation, oxidative deamination, and de-sulfation were also involved.
Renal clearance of etamicastat from plasma following repeated oral administration of etamicastat was 11.9–16.0 L/h, which is higher than the glomerular filtration rate (7.6 L/h).
N-Acetylation is the major metabolic pathway for etamicastat. Humans express two functional NAT isoforms, NAT1 and NAT2. NAT1 has broad tissue distribution whereas NAT2 is more restricted, with higher levels of expression in the liver and red blood cells.[23] NAT exhibits different substrate specificities. Human NAT1 and NAT2 loci are highly polymorphic, with more than 25 alleles identified in each locus.[28,29] Within this polymorphic population, different phenotypes have been identified for both forms, NAT1 and NAT2. As an important metabolizing enzyme in humans, the polymorphism of human NAT expression, especially NAT2, raises concerns about drug-drug interactions during clinical use. In in vitro studies (BIAL unpublished observation), etamicastat N-acetylation in cytosolic fraction showed a good correlation with sulfamethazine NAT activity, a selective substrate to NAT2, but not with p-aminosalicylic acid, a selective substrate to NAT1, suggesting that etamicastat N-acetylation is predominantly driven by NAT2. These data are consistent with the results from the current study and those of a previous single-dose study in healthy subjects,[21] which showed no apparent major influence of NAT1 phenotype on etamicastat pharmacokinetics. However, the contribution of NAT1 to etamicastat metabolism should not be completely excluded, since NAT2 is expressed predominantly in liver whereas NAT1 is expressed ubiquitously.[23]
As demonstrated in figure 7, the extent of systemic exposure to etamicastat differed markedly between NAT2 poor and rapid acetylators. The extent of systemic exposure to etamicastat in NAT2 poor acetylators was 1.5–6.7 times higher than that observed in rapid acetylators and, inversely, NAT2 rapid acetylators showed a 1.5- to 3.5-fold increase in systemic exposure to the N-acetylated metabolite, confirming the involvement of NAT2 in the biotransformation of etamicastat into BIA 5-961. The magnitude of the effect of NAT2 phenotype on etamicastat pharmacokinetics is a strong argument for genotyping participants in further clinical trials with etamicastat. Effective clinical translation would establish etamicastat pharmacogenomics as a step toward personalized medicine for etamicastat.
Similar to a previous single-dose study,[21] the distribution of fast and slow NAT2 acetylators was not equal in all dose groups in the current study, and differences in the proportion of NAT2 fast/slow acetylators complicated the interpretation of the results (i.e. the dose-proportionality assessment) and were a cause of variability. To facilitate the interpretation of the results, stratification according to NAT2 phenotype could be considered in future studies with etamicastat.
DβH catalyzes the conversion of dopamine into norepinephrine. Consistently with the claimed DβH inhibitory effect by etamicastat, urinary excretion of norepinephrine decreased following repeated administration of etamicastat. For doses of etamicastat 100 mg and above, the decrease in norepinephrine urinary excretion was 32–36%. It should be taken into account, however, that the reported effect may be underestimated, since day 1 values do not correspond to a true baseline because they might have been influenced by the effect of the first dose of etamicastat. No relevant change from day 1 to day 10 was found in the other urinary catecholamines in the different dose groups.
A statistically significant decrease was found in supine DBP following repeated administration of etamicastat 100 mg and 200 mg. Although consistent with the claimed pharmacologic effect, this effect, however, should be interpreted with caution because no clear dose-response relationship was observed and the number of subjects in each dose group is small.
Conclusions
In conclusion, etamicastat was well tolerated and was shown to be metabolized to the N-acetylated metabolite BIA 5-961, following single and multiple doses of etamicastat 25–600 mg. Etamicastat and its metabolite followed linear pharmacokinetics, and steady-state plasma concentrations were attained up to 9 days of dosing. Etamicastat pharmacokinetics are markedly affected by the NAT2 phenotype, and NAT2 genotyping could be a step toward personalized medicine for etamicastat. Consistently with the expected pharmacologic effect, urinary excretion of norepinephrine decreased following repeated administration of etamicastat.
Acknowledgements
The authors thank the subjects who participated in the study.
This trial was sponsored by BIAL (Portela and Co, S.A., S. Mamede do Coronado, Portugal). The authors from BIAL substantially contributed to the design and conception of the study and wrote the first and final versions of the manuscript, but played no role in data collection or pharmacokinetic analysis. All authors had full access to the data and substantially contributed to the interpretation of the data and the writing of the manuscript.
TN, JFR, MVS, BI, LCW, LA, and PSS are or were employees of BIAL (the sponsor of the study) at the time of the study. The other author (AF) is or was an employee of a contract research organization contracted by the sponsor to review the pharmacokinetic data (4Health).
References
- 1.Esler M, Kaye D. Sympathetic nervous system activation in essential hypertension, cardiac failure and psychosomatic heart disease. J Cardiovasc Pharmacol. 2000;35(7Suppl.4):S1–7. doi: 10.1097/00005344-200000004-00001. [DOI] [PubMed] [Google Scholar]
- 2.Grassi G, Bolla G, Quarti-Trevano F, et al. Sympathetic activation in congestive heart failure: reproducibility of neuroadrenergic markers. Eur J Heart Fail. 2008;10(12):1186–91. doi: 10.1016/j.ejheart.2008.09.013. [DOI] [PubMed] [Google Scholar]
- 3.Grassi G, Seravalle G, Quarti-Trevano F. The ‘neuroadrenergic hypothesis’ in hypertension: current evidence. Exp Physiol. 2010;95(5):581–6. doi: 10.1113/expphysiol.2009.047381. [DOI] [PubMed] [Google Scholar]
- 4.Lee CS, Tkacs NC. Current concepts of neurohormonal activation in heart failure: mediators and mechanisms. AACN Adv Crit Care. 2008;19(4):364–85. doi: 10.1097/01.AACN.0000340718.93742.c4. [DOI] [PubMed] [Google Scholar]
- 5.Mancia G, Grassi G, Giannattasio C, et al. Sympathetic activation in the pathogenesis of hypertension and progression of organ damage. Hypertension. 1999;34(4Pt2):724–8. doi: 10.1161/01.HYP.34.4.724. [DOI] [PubMed] [Google Scholar]
- 6.Parmley WW. Neuroendocrine changes in heart failure and their clinical relevance. Clin Cardiol. 1995;18(8):440–5. doi: 10.1002/clc.4960180804. [DOI] [PubMed] [Google Scholar]
- 7.Pfeffer MA, Stevenson LW. Beta-adrenergic blockers and survival in heart failure. N Engl J Med. 1996;334(21):1396–7. doi: 10.1056/NEJM199605233342109. [DOI] [PubMed] [Google Scholar]
- 8.Stanley WC, Li B, Bonhaus DW, et al. Catecholamine modulatory effects of nepicastat (RS-25560-197), a novel, potent and selective inhibitor of dopamine-beta-hydroxylase. Br J Pharmacol. 1997;121(8):1803–9. doi: 10.1038/sj.bjp.0701315. [DOI] [PMC free article] [PubMed] [Google Scholar]
- 9.Hegde SS, Friday KF. Dopamine-beta-hydroxylase inhibition: a novel sympatho-modulatory approach for the treatment of congestive heart failure. Curr Pharm Des. 1998;4(6):469–79. [PubMed] [Google Scholar]
- 10.Soares-da-Silva P. Evidence for a non-precursor dopamine pool in noradrenergic neurones of the dog mesenteric artery. Naunyn Schmiedebergs Arch Pharmacol. 1986;333(3):219–23. doi: 10.1007/BF00512932. [DOI] [PubMed] [Google Scholar]
- 11.Soares-da-Silva P. A comparison between the pattern of dopamine and noradrenaline release from sympathetic neurones of the dog mesenteric artery. Br J Pharmacol. 1987;90(1):91–8. doi: 10.1111/j.1476-5381.1987.tb16828.x. [DOI] [PMC free article] [PubMed] [Google Scholar]
- 12.Gomes P, Soares-da-Silva P. Dopamine. In: Baden M, editor. Cardiovascular hormone systems: from molecular mechanisms to novel therapeutics. Weinheim: Wiley-VCH, 2008: 251–93
- 13.Jose PA, Eisner GM. Felder RA. Role of dopamine receptors in the kidney in the regulation of blood pressure. Curr Opin Nephrol Hypertens. 2002;11(1):87–92. doi: 10.1097/00041552-200201000-00013. [DOI] [PubMed] [Google Scholar]
- 14.Ishii Y, Fujii Y, Mimura C, et al. Pharmacological action of FD-008, a new dopamine beta-hydroxylase inhibitor: I, effects on blood pressure in rats and dogs. Arzneimittelforschung. 1975;25:55–9. [PubMed] [Google Scholar]
- 15.Kruse LI, Kaiser C, DeWolf WE, Jr, et al. Multisubstrate inhibitors of dopamine beta-hydroxylase: 2, structureactivity relationships at the phenethylamine binding site. J Med Chem. 1987;30:486–94. doi: 10.1021/jm00386a008. [DOI] [PubMed] [Google Scholar]
- 16.Ohlstein EH, Kruse LI, Ezekiel M, et al. Cardiovascular effects of a new potent dopamine beta-hydroxylase inhibitor in spontaneously hypertensive rats. J Pharmacol Exp Ther. 1987;241:554–9. [PubMed] [Google Scholar]
- 17.Beliaev A, Learmonth DA, Soares-da-Silva P. Synthesis and biological evaluation of novel, peripherally selective chromanyl imidazolethione-based inhibitors of dopamine betahydroxylase. J Med Chem. 2006;49(3):1191–7. doi: 10.1021/jm051051f. [DOI] [PubMed] [Google Scholar]
- 18.Kruse LI, Kaiser C, DeWolf WE, Jr, et al. Substituted 1-benzylimidazole-2-thiols as potent and orally active inhibitors of dopamine beta-hydroxylase. J Med Chem. 1986;29:887–9. doi: 10.1021/jm00156a002. [DOI] [PubMed] [Google Scholar]
- 19.Igreja B, Wright L, Soares-Da-Silva P. Sustained antihypertensive effects of a selective peripheral dopamine-Xhydroxylase inhibitor. Hypertension. 2007;50:e133. [Google Scholar]
- 20.Beliaev A, Ferreira H, Learmonth DL, et al. Dopamine beta- monooxygenase: mechanism, substrates and inhibitors. Curr Enzyme Inh. 2009;5:27–43. doi: 10.2174/157340809787314265. [DOI] [Google Scholar]
- 21.Nunes T, Rocha JF, Almeida L, et al. A rising single oral dose study to investigate the tolerability and pharmacokinetics of etamicastat, a new dopamine beta-hydroxylase inhibitor, in healthy male volunteers. J Clin Pharmacol. 2009;49:1094. doi: 10.1177/0091270009339191. [DOI] [Google Scholar]
- 22.Falcao A, Nunes T, Rocha JF, et al. Comparative bioavailability study of etamicastat (BIA 5-453) under fasted and fed conditions. J Clin Pharmacol. 2009;49:1095. [Google Scholar]
- 23.Winter HR, Unadkat JD. Identification of cytochrome P450 and arylamine N-acetyltransferase isoforms involved in sulfadiazine metabolism. Drug Metab Dispos. 2005;33:969–76. doi: 10.1124/dmd.104.002998. [DOI] [PubMed] [Google Scholar]
- 24.Fronhoffs S, Bruning T, Ortiz-Pallardo E, et al. Real-time PCR analysis of the N-acetyltransferase NAT1 allele *3, *4, *10, *11, *14 and *17 polymorphism in squamous cell cancer of head and neck. Carcinogenesis. 2001;22(9):1405–12. doi: 10.1093/carcin/22.9.1405. [DOI] [PubMed] [Google Scholar]
- 25.Brocvielle H, Muret P, Goydadin AC, et al. N-acetyltransferase 2 acetylation polymorphism: prevalence of slow acetylators does not differ between atopic dermatitis patients and healthy subjects. Skin Pharmacol Appl Skin Physiol. 2003;16(6):386–92. doi: 10.1159/000072934. [DOI] [PubMed] [Google Scholar]
- 26.Rychlik-Sych M, Skretkowicz J, Gawronska-Szklarz B, et al. Acetylation genotype and phenotype in patients with systemic lupus erythematosus. Pharmacol Rep. 2006;58(1):22–9. [PubMed] [Google Scholar]
- 27.Deinum J, Steenbergen-Spanjers GC, Jansen M, et al. DBH gene variants that cause low plasma dopamine beta hydroxylase with or without a severe orthostatic syndrome [letter] J Med Genet. 2004;414:e38. doi: 10.1136/jmg.2003.009282. [DOI] [PMC free article] [PubMed] [Google Scholar]
- 28.Walraven JM, Zang Y, Trent JO, et al. Structure/function evaluations of single nucleotide polymorphisms in human N-acetyltransferase 2. Curr Drug Metab. 2008;9(6):471–86. doi: 10.2174/138920008784892065. [DOI] [PMC free article] [PubMed] [Google Scholar]
- 29.Walraven JM, Trent JO, Hein DW. Structure-function analyses of single nucleotide polymorphisms in human Nacetyltransferase 1. Drug Metab Rev. 2008;40(1):169–84. doi: 10.1080/03602530701852917. [DOI] [PMC free article] [PubMed] [Google Scholar]


