Abstract
Background
Posttraumatic anterior shoulder instability is associated with anterior glenoid bone loss, contributing to recurrence. Accurate preoperative quantification of bone loss is paramount to avoid failure of a soft tissue stabilization procedure as bone reconstruction is recommended for glenoid defects greater than 20% to 27%.
Questions/purposes
We determined whether radiography, MRI, or CT was most reliable to quantify glenoid bone loss in recurrent anterior shoulder instability.
Methods
Seven intact fresh-frozen human cadaveric shoulders were imaged with radiography, MRI, CT, and three-dimensional (3-D) CT. Three sequential anterior glenoid defects then were created, measured, and the shoulders reimaged after each defect. Defect sizes were less than 12%, 12% to 25%, and 25% to 40%. The gold standard measurement was determined by comparing measurements taken on the cadaver by two surgeons using digital calipers with the measurements determined by using electronic digital calipers on the 3-D CT. This measurement was used for comparison of all estimations by the evaluators. Twelve independent blinded evaluators reviewed the 112 image sets and estimated the percent of glenoid bone loss. Images were scrambled and rereviewed by the same observers 2 months later to determine intraobserver reliability. We determined reliability with kappa values.
Results
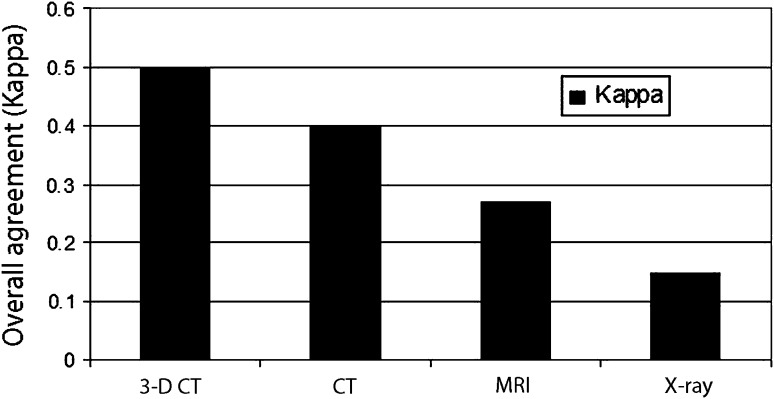
Kappa values between predicted bone loss versus true loss (determined by our gold standard measurements) across all 12 raters for each modality were: 3-D CT, 0.50; CT, 0.40; MRI, 0.27; and radiographs, 0.15. Interobserver agreement (kappa) values were: 3-D CT, 0.54; CT, 0.47; MRI, 0.31; and radiographs, 0.15. The intraobserver agreement (kappa) values were: 3-D CT, 0.59; CT, 0.64; MRI, 0.51; and radiographs, 0.45.
Conclusions
Three-dimensional CT was the most reliable imaging modality for predicting glenoid bone loss. Regular CT was the second most reliable and reproducible modality.
Introduction
Chronic anterior shoulder instability is associated with anterior glenoid bone loss, which contributes to recurrent anterior shoulder instability. Many authors have stressed the importance of recognizing glenoid bone loss as a risk factor for failure of standard soft tissue stabilization procedures [5–7, 23]. Boileau et al. [5] reported a 75% recurrence rate of instability after arthroscopic stabilization for greater than 25% glenoid bone loss and inferior laxity. Tauber et al. [23] found a 50% incidence of untreated glenoid rim defects at the time of revision surgery for recurrent dislocation. In a cadaver study, a glenoid defect of 21% of its length may lead to instability [16]. Numerous surgeons recommend bony reconstruction for bone defects measuring greater than 20% to 27% to avoid failure of a soft tissue stabilization procedure [3, 4, 10, 13, 16, 18, 20, 24].
Therefore, accurate preoperative quantification of glenoid bone loss is important to reduce the risk of recurrent dislocation after surgical stabilization. The method of quantification should be accurate and reliable. Numerous methods have been described to evaluate anterior glenoid bone loss in clinical, surgical, and experimental settings including unique radiographic views (such as the Bernageau, West Point, and Stryker notch views) [8], fluoroscopic evaluation [12], three-dimensional (3-D) CT with software algorithms and/or measurements based on the contralateral glenoid [1, 11, 22], and arthroscopic intraoperative evaluation [9]. MRI is used by many to evaluate the status of the soft tissue structures such as the labrum, but it is unclear whether it can accurately detect glenoid bone loss. The relative accuracy and reliability of these modalities to determine glenoid bone loss is unknown.
The purpose of this study was to evaluate the reliability of standard radiographs (that require no special positioning), MRI, CT, and 3-D CT. We first determined how close our evaluators were to predicting the true amount of glenoid bone loss with each modality (using our gold standard comparison). We then compared the interobserver and intraobserver reliabilities of a large group of fellowship-trained shoulder surgeons when assessing glenoid bone loss and also looked at which size defects were easiest and hardest to predict. We finally evaluated which sequence was most useful to each surgeon when determining the percent of glenoid bone loss.
Materials and Methods
Seven fresh-frozen whole cadaveric shoulders were used, four left and three right. Each shoulder was appropriately labeled and sequentially imaged using radiography, CT (1-mm slices), and MRI (1.5-T scan). All shoulders were properly positioned to allow accurate images for each modality. After the first complete set of imaging for each shoulder, the glenoid was exposed to create deficits in three ranges: less than 12% of the glenoid width, 12% to 25%, and 25% to 40%. We received prior investigational review board approval.
The study was powered to a sample size of seven. The power and sample size are based on the selection of best method. A sample size of seven shoulders provides 90% of power to correctly select the best method for bone loss diagnosis when the second best method has the prediction error 1 SD higher than the best one. The sample size estimated here is likely to be conservative because it ignores the correlation of the prediction errors for the same shoulders by the different methods, because we used four different bone loss levels for each shoulder in the experiment, and because we had 12 evaluators. At the same time, the multivariate normality assumption used in this sample size estimation is likely to be violated, which will lead to slightly overestimating the 90% probability of correct selection. Thus, a sample size of seven shoulders provides 90% power to correctly select the best method for bone loss determination when the second best method has a prediction error of 1 SD higher than the best one [2].
Radiographs chosen were true AP, scapular lateral, and axillary views. The MRI used T1 and T2 coronal, sagittal oblique, and axial views. CT scans also were coronal oblique, sagittal oblique, and axial views. MRI and CT scanners were from Siemens Medical Solutions, Inc (Malvern, PA, USA). The CT scans were processed into humeral subtraction 3-D en face glenoid (sagittal oblique) views (Aquarius Workstation Version 3.7.0.14; TeraRecon, Inc, Foster City, CA, USA).
After the first complete set of imaging had been performed for each shoulder, the glenoid was exposed using a standard deltopectoral approach. A tenotomy of the subscapularis 1 cm medial to the bicipital groove was performed and tagged for later repair. Standard shoulder retractors were used to expose the glenoid, and the AP width of each glenoid then was measured through the bare area using handheld digital calipers by two surgeons (JB, MR) (to compare measurements for accuracy). The determined bare area was marked so all measurements were made through the same spot each time. A sagittal saw and rasps were used to simulate anatomic anterior glenoid bone defects parallel to the plane of the scapula [21]. The first set of defects was created in the range of 0% to 12% of the glenoid width and then remeasured through the bare area to determine the exact percent defect created in each shoulder. The subscapularis tendon then was repaired using nonabsorbable braided suture and the skin was closed using interrupted nylon suture. All measurements recorded in the laboratory were validated using electronic digital calipers during the 3-D CT reconstruction. The shoulders then were reimaged using each modality. We then performed the same technique for the next two sets of defects created between the ranges of 12% to 25% and 25% to 40%. No glenoid defect was greater than 40% of the width. We reimaged all shoulders after each defect, creating a series of 28 anterior glenoid bone loss models with bone loss ranging from 0% to 40%. Each model underwent all four imaging modalities for a total of 112 sets of combinations of bone loss models and imaging modalities. A master key was created and kept by the principle investigator (JYB) detailing the exact percent bone loss for all 112 imaging sets.
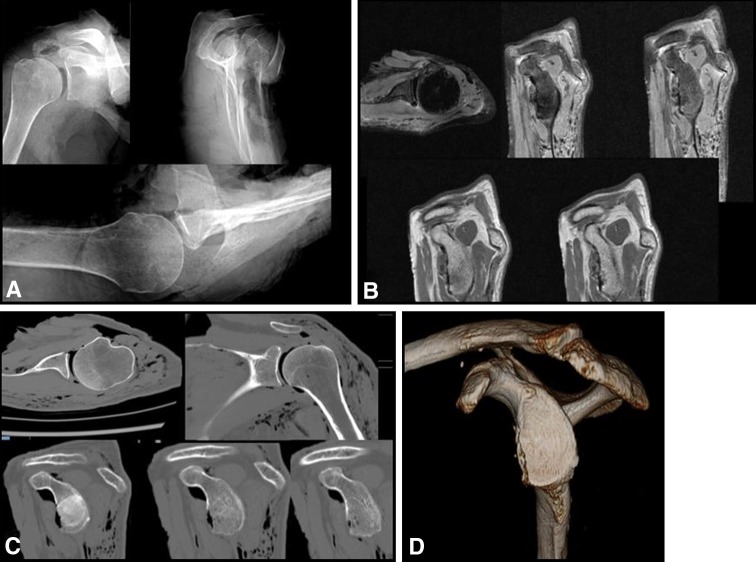
The images were arranged in a PowerPoint (Microsoft, Redmond, WA, USA) presentation with one imaging modality of each model embedded in a specific slide for a total of 112 slides. All three radiographs of each model were placed on a single slide (Fig. 1A). MR and CT images were provided on separate slides and representative cuts through the glenoid in each plane are shown for the MR (Fig. 1B) and CT images (Fig. 1C). The en face glenoid (sagittal oblique) view of the 3-D CT was the only view chosen for the 3-D CT slide (Fig. 1D). The slides then were randomized into a separate presentation with a master key created in the appropriate slide order. All PowerPoint presentations were viewed by 12 members of the Multicenter Orthopaedic Outcomes Network (MOON) Shoulder Group. All are fellowship-trained shoulder surgeons with varying levels of experience and years in practice. They were blinded to the exact percent of bone loss. Each surgeon was asked to review the randomized images and determine the amount of bone loss of each model and modality combination and record the amount to the nearest whole percentage. No electronic measuring tools were provided to the evaluators during the experiment. They were asked to determine the percent bone loss as if the patient had brought in outside films without any electronic measuring tools. The slides then were rerandomized and reevaluated at 2 months by the same 12 shoulder surgeons from the MOON group. The physicians recorded which sequences (eg, for CT, the axial, coronal, or sagittal sequences) were the most helpful in determination of the size of the lesion for each imaging modality and defect combination.
Fig. 1A–D.
Members of the MOON Shoulder Group viewed randomized (A) radiographs, (B) MR images, (C) CT scans, and (D) 3-D CT scans and evaluated the amount of bone loss for each combination of bone defect and modality.
Determination of the most precisely reliable imaging modality was performed by looking at the overall agreement of the measurements. A linear prediction model was used to compare the actual measured percent defect size with the physician-estimated percent defect. This was performed using 95% CIs. Interrater agreement and reliability when evaluating the percent defect sizes and the different modalities were determined by the Fleiss kappa, using the statistical software STATA 9.0 (StataCorp LP, College Station, TX, USA).
Results
The highest overall best agreement (kappa) value between the evaluator-predicted bone loss versus the true bone loss across all 12 raters for each modality was achieved with 3-D CT: 0.50 and the lowest was with radiographs: 0.15 (Fig. 2).
Fig. 2.
Overall agreement between predicted bone loss versus true bone loss is shown. The highest overall agreement (kappa) value between the predicted bone loss versus the true bone loss across all 12 raters for each modality was achieved with 3-D CT: 0.50 (p < 0.001) and the lowest was with radiographs: 0.15 (p < 0.001).
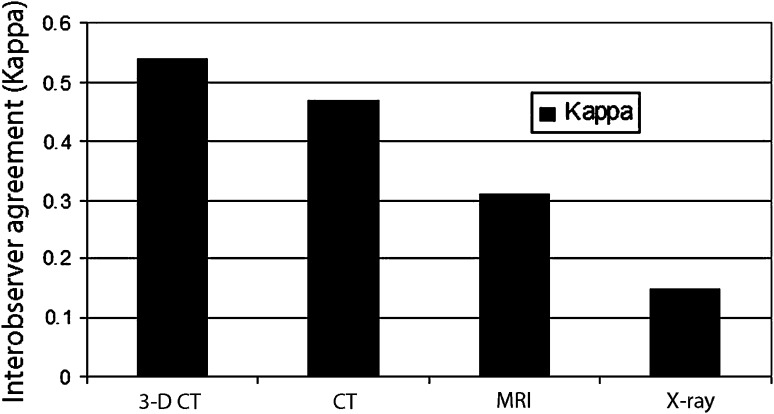
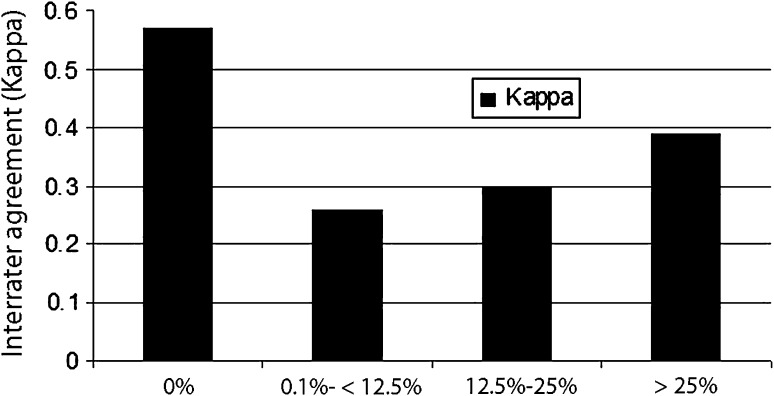
The interobserver agreement (kappa) values from highest to lowest were: 3-D CT, 0.54; CT, 0.47; MRI, 0.31; and radiographs, 0.15 (Fig. 3). When evaluating the interrater agreement (kappa) values by percent defect regardless of the modality type, the most agreement was seen when either there was no defect created or the defects were greater than 25%. The most difficult agreement (which was only fair agreement) was for the range of 0% to 25% defects (Fig. 4).
Fig. 3.
Interobserver agreement by modality type regardless of defect size was measured. The interobserver agreement (kappa) values from highest to lowest are 3-D CT, 0.54 (p < 0.001); CT, 0.47 (p < 0.001); MRI, 0.31 (p < 0.001); and radiographs, 0.15 (p < 0.001).
Fig. 4.
The interrater agreement (kappa) values by percent defect regardless of the modality type were: 0% defect, 0.57 (p < 0.001); 0% to 12% defects, 0.26 (p < 0.001); 12% to 25% defects, 0.30 (p < 0.001); and > 25% defects, 0.39 (p < 0.001). Thus, most agreement either was seen when there was no defect created or for defects greater than 25%. The most difficult agreement (which was only fair agreement) was in the range of 0% to 25% defects.
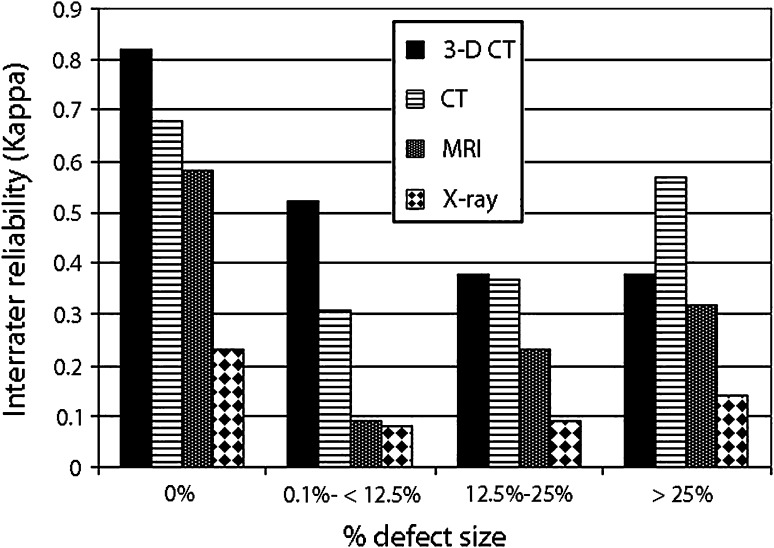
When evaluating the interrater reliability (kappa values), broken down by modality, 0% defects had the best interrater reliability by 3-D CT (0.82); 0% to 12% defects by 3-D CT (0.52); 12% to 25% defects by 3-D CT (0.38); and defects greater than 25% showed the best interrater reliability by CT (0.57) (Fig. 5).
Fig. 5.
When evaluating the interrater reliability, broken down by modality, and looking at kappa values, 0% defects had the best interrater reliability by 3-D CT, 0.82 (p < 0.001); 0% to 12% defects by 3-D CT: 0.52 (p < 0.001); 12% to 25% defects had the best interrater reliability with 3-D CT, 0.38 (p < 0.001); however, CT was close at 0.37 (p < 0.001); and defects > 25% showed the best interrater reliability by CT, 0.57 (p < 0.001).
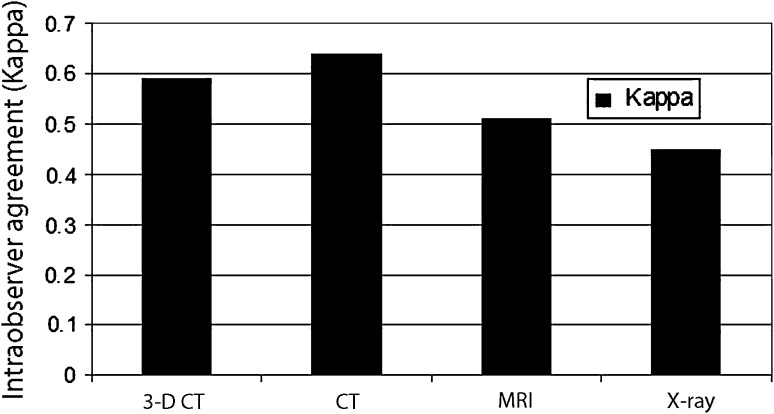
The intraobserver agreement (kappa) values from highest to lowest were: CT, 0.64; 3-D CT, 0.59; MRI, 0.51; and radiographs, 0.45 (Fig. 6).
Fig. 6.
Measurement of intraobserver agreement by modality type regardless of defect size showed that intraobserver agreement (kappa) values were: CT, 0.64 (p < 0.001); 3-D CT, 0.59 (p < 0.001); MRI, 0.51 (p < 0.001); and radiographs, 0.45 (p < 0.001).
When evaluating all the CT scans for each bone model, 48% of the time surgeons preferred the axial cuts, 51% of the time they preferred the sagittal, and only 1% of the time they preferred the coronal sequences. When evaluating all the MRI scans, 40% of the time the axial cuts were preferred, 58% of the time the sagittal scans were preferred, and only 2% of the time the coronal sequences were preferred. For the radiograph views, 94% of the time the axial radiographs were preferred compared with only 4% for the scapular Y view and 2% for the true AP view.
Discussion
Glenoid bone loss, if not detected and addressed, can lead to failure of a soft tissue stabilization procedure performed for recurrent anterior shoulder instability. Therefore a reliable method of detecting glenoid bone loss is essential for the treating surgeon. Our goal was to determine whether radiography, MRI, CT, or 3-D CT was the most reliable imaging modality for evaluating glenoid bone loss.
Our study has numerous limitations. First, we used cadaveric bone models rather than true examples of bone loss in actual patients. A more realistic example of glenoid bone loss is found with a live patient versus created defects. A vacuum effect can be seen on the CT images we used as a result of using cadaveric shoulders. This may have helped the observers to assess more accurately the defect size on the CT scans and could have led to the higher kappa values seen with the larger defects observed on CT. However, it would be impossible to obtain the same high number of models we created from seven full shoulder cadavers with true patient data. We believe that comparing multiple imaging modalities simultaneously was necessary and could not occur without the use of cadaveric models. Therefore, we do not believe this aspect affected our results. Second, no true gold standard measurement for glenoid bone loss exists, and thus we created our own standard (comparing our digital hand measurements with electronic calipers on the 3-D CT) and compared all measurements with this. The CT values confirmed our hand-recorded values, and thus we were confident using our measurements as the gold standard. However, this model was not completely validated with a pilot study. Given the expense of cadaveric shoulders, a pilot study was not feasible. We would have expected similar results (as it would have been performed in a similar fashion), thus we do not believe this had any effect on our results.
In this cadaveric study, 3-D CT showed the best overall agreement (moderate by kappa scores) for predicting the percent of anterior glenoid bone loss. The remaining modalities all showed slight to fair agreement. Surgeons had a difficult time (low kappa scores) categorizing defects in the 12% to 25% range regardless of the modality used. That result presents clinical concerns as this is the crucial range in which a determination is made whether to bone graft the glenoid, which underscores the importance of using the most reliable modality [17]. Many 3-D CT evaluations use software algorithms, mathematical formulas, and/or contralateral CT scans to determine glenoid bone loss in percent width or area [1, 11, 14, 19, 22]. Chuang et al. [11] evaluated 3-D CT scans of the injured and contralateral glenoids to correlate their intraoperative findings with 96% accuracy. Sugaya et al. [22] similarly used 3-D CT scans of injured and contralateral glenoids to evaluate the surface area of glenoid bone loss depending on circles drawn through the inferior portion of the glenoid. However, the additional radiation dose and expense of a contralateral CT scan may not be justified if reliable data can be determined from a unilateral scan as in our study. MRI often is used to assess soft tissue abnormalities, but minimal data exist regarding its accuracy. Huijsmans et al. [15] compared 3-D CT with MRI, but more in the interest of validating the use of perfect circle fit to evaluate glenoid bone loss. We did not find MRI to be superior to CT or 3-D CT in any category and overall found it consistently inferior. Thus, we would not recommend this modality over CT or 3-D CT.
The interobserver agreement among the 12 surgeons also was greatest for 3-D CT, although CT alone also showed moderate agreement. MR images and radiographs were lower with only slight to fair agreement. Therefore, surgeons most agreed on the percent defect size when using 3-D CT scans with greater variability in answers seen with MR images and radiographs. Although some previous studies have evaluated glenoid bone loss in detail, few have compared the interobserver and intraobserver reliabilities between different modalities or been able to compare their estimates of bone loss with direct measurements [9, 11].
The intraobserver numbers showed that overall, regardless of modality, surgeons agreed with their original determination, with all modalities showing moderate to substantial agreement. Therefore, we think the surgeons were consistent with themselves regarding how they read the different images. This clinically is not as important as overall accuracy, because even if a surgeon is consistent with him- or herself, but not accurate, he or she still may underestimate or overestimate bone loss and choose the wrong procedure.
When choosing the most helpful sequences, surgeons were mostly split between axial and sagittal views for CT and MRI. However, when using radiographs, they chose the axial view almost 100% of the time. When evaluating bone loss, Edwards et al. [12] used fluoroscopically directed radiographs and found qualitative evidence of glenoid lesions in 87% of patients. Burkhart et al. [8] evaluated bone loss through a series of eight plain radiographs and were unable to obtain a quantitative sense of glenoid bone loss. We chose to evaluate only standard radiographic views and thus the axillary view was the best. However, as the data showed, the overall reliability of radiographs to determine glenoid bone loss was poor.
Preoperative planning is essential to a successful outcome of shoulder stabilization surgery, especially with anterior glenoid bone loss. Failure to accurately determine glenoid bone loss can lead to failure of a soft tissue stabilization procedure. Selection of the optimal surgical technique, which determines patient expectations regarding type of procedure, length of stay, and need for bone grafting, depends on the extent of bone loss. When evaluating a patient with recurrent anterior shoulder instability with a concern for bone loss, preoperative 3-D CT provides the most reliable and reproducible estimation of glenoid bone loss.
Acknowledgments
We thank the New Albany Surgical Hospital Foundation for donating the cadaveric specimens used in this study. The imaging facilities were provided by The Ohio State University Department of Radiology. The participating members of the MOON group were: Bruce Miller MD, Charles Cox MD, Robert Brophy MD, Rick Wright MD, Brian Wolf MD, Benjamin Ma MD, Matthew Smith MD, Joseph Abboud MD, Keith Baumgarten MD, and Jed Kuhn MD.
Footnotes
The institution of one of the authors (GJ) has received, during the study period, funding from Genzyme (Cambridge, MA, USA) and Biomet (Warsaw, IN, USA).
All ICMJE Conflict of Interest Forms for authors and Clinical Orthopaedics and Related Research editors and board members are on file with the publication and can be viewed on request.
Each author certifies that his or her institution approved the human protocol for this investigation, that all investigations were conducted in conformity with ethical principles of research, and that informed consent for participation in the study was obtained.
References
- 1.Barchilon VS, Kotz E, Barchilon Ben-Av M, Glazer E, Nyska M. A simple method for quantitative evaluation of the missing area of the anterior glenoid in anterior instability of the glenohumeral joint. Skeletal Radiol. 2008;37:731–736. doi: 10.1007/s00256-008-0506-8. [DOI] [PubMed] [Google Scholar]
- 2.Bechhofer R, Santner R, Goldsman D. The Design and Analysis of Experiments for Statistical Selection, Screening, and Multiple Comparisons. New York, NY, USA: John Wiley and Sons; 1995. [Google Scholar]
- 3.Beran MC, Donaldson CT, Bishop JY. Treatment of chronic glenoid defects in the setting of recurrent anterior shoulder instability: a systematic review. J Shoulder Elbow Surg. 2010;19:769–780. doi: 10.1016/j.jse.2010.01.011. [DOI] [PubMed] [Google Scholar]
- 4.Bigliani LU, Newton PM, Steinmann SP, Connor PM, McIlveen SJ. Glenoid rim lesions associated with recurrent anterior dislocation of the shoulder. Am J Sports Med. 1998;26:41–45. doi: 10.1177/03635465980260012301. [DOI] [PubMed] [Google Scholar]
- 5.Boileau P, Villalba M, Hery JY, Balg F, Ahrens P, Neyton L. Risk factors for recurrence of shoulder instability after arthroscopic Bankart repair. J Bone Joint Surg Am. 2006;88:1755–1763. doi: 10.2106/JBJS.E.00817. [DOI] [PubMed] [Google Scholar]
- 6.Burkhart SS, Danaceau SM. Articular arc length mismatch as a cause of failed bankart repair. Arthroscopy. 2000;16:740–744. doi: 10.1053/jars.2000.7794. [DOI] [PubMed] [Google Scholar]
- 7.Burkhart SS, De Beer JF. Traumatic glenohumeral bone defects and their relationship to failure of arthroscopic Bankart repairs: significance of the inverted-pear glenoid and the humeral engaging Hill-Sachs lesion. Arthroscopy. 2000;16:677–694. doi: 10.1053/jars.2000.17715. [DOI] [PubMed] [Google Scholar]
- 8.Burkhart SS, De Beer JF, Barth JR, Cresswell T, Roberts C, Richards DP. Results of modified Latarjet reconstruction in patients with anteroinferior instability and significant bone loss. Arthroscopy. 2007;23:1033–1041. doi: 10.1016/j.arthro.2007.08.009. [DOI] [PubMed] [Google Scholar]
- 9.Burkhart SS, Debeer JF, Tehrany AM, Parten PM. Quantifying glenoid bone loss arthroscopically in shoulder instability. Arthroscopy. 2002;18:488–491. doi: 10.1053/jars.2002.32212. [DOI] [PubMed] [Google Scholar]
- 10.Chen AL, Hunt SA, Hawkins RJ, Zuckerman JD. Management of bone loss associated with recurrent anterior glenohumeral instability. Am J Sports Med. 2005;33:912–925. doi: 10.1177/0363546505277074. [DOI] [PubMed] [Google Scholar]
- 11.Chuang TY, Adams CR, Burkhart SS. Use of preoperative three-dimensional computed tomography to quantify glenoid bone loss in shoulder instability. Arthroscopy. 2008;24:376–382. doi: 10.1016/j.arthro.2007.10.008. [DOI] [PubMed] [Google Scholar]
- 12.Edwards TB, Boulahia A, Walch G. Radiographic analysis of bone defects in chronic anterior shoulder instability. Arthroscopy. 2003;19:732–739. doi: 10.1016/S0749-8063(03)00684-4. [DOI] [PubMed] [Google Scholar]
- 13.Flatow EL, Warner JI. Instability of the shoulder: complex problems and failed repairs: Part I. Relevant biomechanics, multidirectional instability, and severe glenoid loss. Instr Course Lect. 1998;47:97–112. [PubMed] [Google Scholar]
- 14.Huijsmans PE, de Witte PB, de Villiers RV, Wolterbeek DW, Warmerdam P, Kruger NR, de Beer JF. Recurrent anterior shoulder instability: accuracy of estimations of glenoid bone loss with computed tomography is insufficient for therapeutic decision-making. Skeletal Radiol. 2011;40:1329–1334. doi: 10.1007/s00256-011-1184-5. [DOI] [PubMed] [Google Scholar]
- 15.Huijsmans PE, Haen PS, Kidd M, Dhert WJ, van der Hulst VP, Willems WJ. Quantification of a glenoid defect with three-dimensional computed tomography and magnetic resonance imaging: a cadaveric study. J Shoulder Elbow Surg. 2007;16:803–809. doi: 10.1016/j.jse.2007.02.115. [DOI] [PubMed] [Google Scholar]
- 16.Itoi E, Lee SB, Berglund LJ, Berge LL, An KN. The effect of a glenoid defect on anteroinferior stability of the shoulder after Bankart repair: a cadaveric study. J Bone Joint Surg Am. 2000;82:35–46. doi: 10.2106/00004623-200001000-00005. [DOI] [PubMed] [Google Scholar]
- 17.Ljungquist KL, Butler RB, Griesser MJ, Bishop JY. Prediction of coracoid thickness using a glenoid width-based model: implications for bone reconstruction procedures in chronic anterior shoulder instability. J Shoulder Elbow Surg. 2012;21:815–821. doi: 10.1016/j.jse.2011.10.006. [DOI] [PubMed] [Google Scholar]
- 18.Lynch JR, Clinton JM, Dewing CB, Warme WJ, Matsen FA., 3rd Treatment of osseous defects associated with anterior shoulder instability. J Shoulder Elbow Surg. 2009;18:317–328. doi: 10.1016/j.jse.2008.10.013. [DOI] [PubMed] [Google Scholar]
- 19.Nofsinger C, Browning B, Burkhart SS, Pedowitz RA. Objective preoperative measurement of anterior glenoid bone loss: a pilot study of a computer-based method using unilateral 3-dimensional computed tomography. Arthroscopy. 2011;27:322–329. doi: 10.1016/j.arthro.2010.09.007. [DOI] [PubMed] [Google Scholar]
- 20.Ochoa E, Jr, Burkhart SS. Glenohumeral bone defects in the treatment of anterior shoulder instability. Instr Course Lect. 2009;58:323–336. [PubMed] [Google Scholar]
- 21.Saito H, Itoi E, Sugaya H, Minagawa H, Yamamoto N, Tuoheti Y. Location of the glenoid defect in shoulders with recurrent anterior dislocation. Am J Sports Med. 2005;33:889–893. doi: 10.1177/0363546504271521. [DOI] [PubMed] [Google Scholar]
- 22.Sugaya H, Moriishi J, Dohi M, Kon Y, Tsuchiya A. Glenoid rim morphology in recurrent anterior glenohumeral instability. J Bone Joint Surg Am. 2003;85:878–884. doi: 10.2106/00004623-200305000-00016. [DOI] [PubMed] [Google Scholar]
- 23.Tauber M, Resch H, Forstner R, Raffl M, Schauer J. Reasons for failure after surgical repair of anterior shoulder instability. J Shoulder Elbow Surg. 2004;13:279–285. doi: 10.1016/j.jse.2004.01.008. [DOI] [PubMed] [Google Scholar]
- 24.Yamamoto N, Itoi E, Abe H, Kikuchi K, Seki N, Minagawa H, Tuoheti Y. Effect of an anterior glenoid defect on anterior shoulder stability: a cadaveric study. Am J Sports Med. 2009;37:949–954. doi: 10.1177/0363546508330139. [DOI] [PubMed] [Google Scholar]


