Abstract
Azathioprine leads to changes in mean corpuscular volume (MCV) and white blood cell (WBC) indices reflecting efficacy or toxicity. Understanding the interactions between bone marrow stem cells and azathioprine could highlight abnormal response patterns as forerunners for hematologic malignancies. This study gives a statistical description of factors influencing the relationship between MCV and WBC in children with inflammatory bowel disease treated with azathioprine. We found that leukopenia preceded macrocytosis. Macrocytosis is therefore not a good predictor of leukopenia. Further studies will be necessary to determine the subgroup of patients at increased risk of malignancies based on bone marrow response.
Introduction
Azathioprine is a prodrug purine analog thought to exert its immunosuppressive effect through reduction in the proliferation of immune cells by interfering with lymphocyte DNA replication and RNA synthesis, and via downregulation of the antiapoptotic protein bcl-xL leading to premature apoptosis.[1] Increased use of azathioprine in inflammatory bowel disease (IBD) is a consequence of studies confirming its effect in maintenance of remission and reduction in episodes of disease relapse.[2]
Serious adverse effects of azathioprine include pancreatitis, bone marrow suppression, sepsis, allergic reactions, and drug-induced hepatitis.[3] Minor hematologic and biochemical disturbances usually necessitate dose reduction rather than drug discontinuation. Of more recent concern is the long-term risks of thiopurine-mediated malignancy.[4,5] It has been shown that patients with sustained leukopenia during 6-mercaptopurine (a metabolite of azathioprine) therapy had an increased risk of hematologic malignancies compared with control patients.[6] An emerging concern centers on the synergistic risk of malignancy in IBD when azathioprine or 6-mercaptopurine is combined with biologic anti-tumor necrosis factor agents.[7] Knowledge of how azathioprine interacts with bone marrow stem cells over time is necessary to understand the balance between the benefits of disease control and reducing the risk of future malignancy and other adverse events.
Azathioprine is known to lead to macrocytosis and leukopenia.[8] Previous reports have looked at these parameters independently. Fraser et al.[9] showed that lower white blood cell (WBC) count, lower neutrophil count, and independently higher mean corpuscular volume (MCV), but not lymphocyte count, were good predictors of achieving and maintaining remission. Thomas et al.[10] found that MCV could be used as a surrogate marker for 6-thioguanine nucleotide concentration. However, their study was unable to link changes in MCV with toxicity or to identify a significant relationship with leukocyte counts. Glas et al.[11] showed that lower leukocyte counts were associated with disease remission. These findings have not been replicated in pediatric studies. There are no studies that have defined the temporal and dose-response relationships in hematologic parameters in children treated with azathioprine.
In order to further understand how these parameters change in children with IBD treated with azathioprine, this study specifically aimed to (i) statistically describe the relationship between MCV and differential WBC count over time in children with IBD treated with azathioprine; and (ii) determine the effect of age, sex, diagnosis, azathioprine dose per kg of bodyweight, thiopurine methyltransferase (TPMT) level, and additional therapy on this relationship.
Methods
Patients attending the Sheffield Children’s Hospital (Sheffield, UK) who were prescribed azathioprine from April 2002 to April 2007 were identified from the hospital pharmacy database. All patients for whom azathioprine was prescribed for a diagnosis of IBD were included. Case notes and laboratory data were reviewed to determine patient demographics, hematologic indices, azathioprine dosage, bodyweight, and additional treatment modalities over predefined time intervals. These time intervals were defined as T1 (baseline values within 6 months prior to commencing azathioprine), T2 (2–3 months after commencement of azathioprine), T3 (5–6 months after commencement of azathioprine), T4 (11–12 months after commencement of azathioprine), and T5 (23–24 months after commencement of azathioprine). Where multiple values for laboratory results were present in the predefined time windows, an average value was taken of those readings qualifying for study inclusion.
Analysis was performed with Data Desk 5.0 statistical software (Description, Inc., Ithaca, NY, USA). Non-parametric data were log transformed prior to regression analysis. Comparison of summary values was via Mann-Whitney U test for non-parametric data and paired t-test for parametric data (changes from baseline analysis). Trends were tested for significance by ANOVA and more complex interactions between hematological parameters, sex, age, TPMT, and diagnosis by multiple regression analysis.
Results
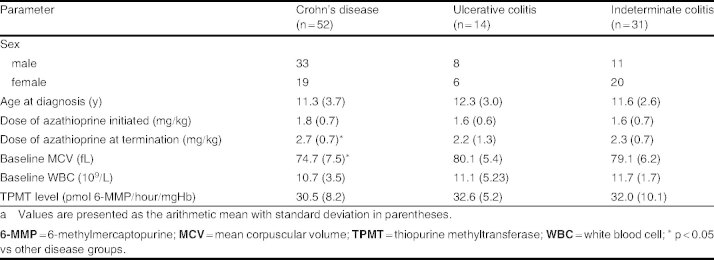
A total of 113 patients under 16 years of age were identified. Sixteen patients were excluded from the analysis on the basis of the following predefined criteria: (i) six children had incomplete or unobtainable data for the first 3 months of commencing azathioprine; (ii) seven patients were transferred to adult services within 3 months of commencing azathioprine; and (iii) three children discontinued azathioprine in the first 3 months as a consequence of adverse reactions (two with hyperamylasemia and one with neutropenia). Table I summarizes the patient characteristics of the remaining 97 patients. MCV was notably lower in the group of patients with Crohn’s disease (74.7 fL [SD 7.5] vs 79.1 fL [SD 6.2]; p < 0.05) when compared with the second largest group, namely indeterminate colitis. The patient numbers at each successive time interval, which are presented in table II, demonstrate that the majority of patients were within 12 months of commencing azathioprine therapy.
Table I.

Patient characteristicsa
Table II.

Mean timepoint at each analysis (standard deviation given in parentheses)
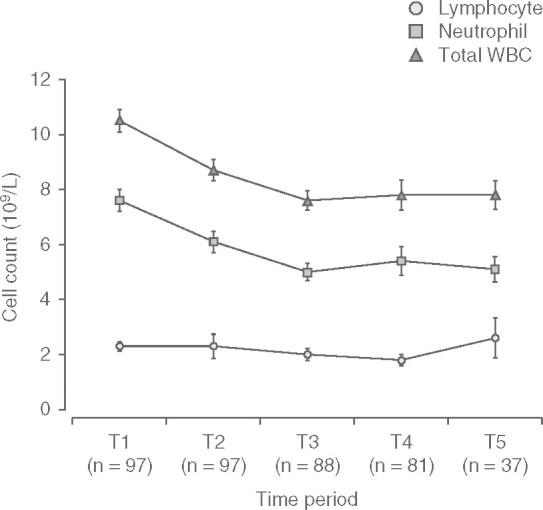
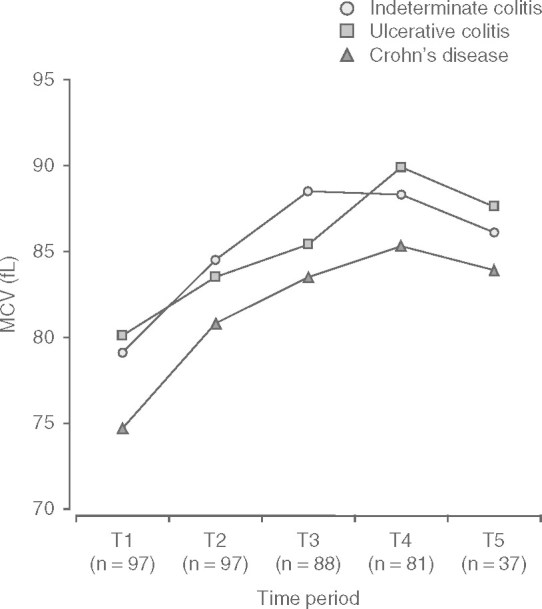
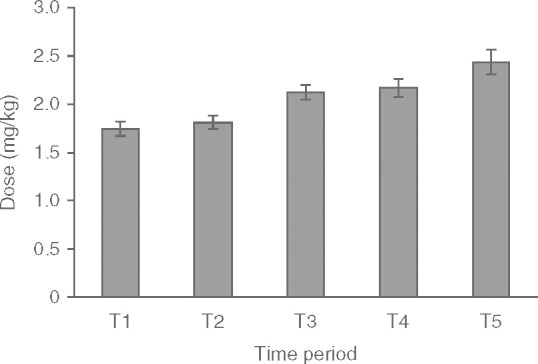
Total WBC and neutrophil count fell steadily within the first 6 months of treatment then reached a plateau between 6 and 24 months (figure 1). The mean values at T3–T5 were approximately 25% lower than the values at baseline (mean minimum total WBC count of 7.6 × 10⁹/L [SD 0.4] p < 0.05 occurring at 5.8 months [SD 0.2] p < 0.05. Conversely, MCV increased steadily within the first 6 months of treatment, with a plateau between 12 and 24 months (figure 2). This equates to a mean maximum MCV of 87.9 fL (SD 1.8) [p < 0.05], which occurred at a mean time of 9.7 months (SD 2.8) [p < 0.05], i.e. 3.9 months after WBC count plateaued. This represented a mean percentage increase in MCV of 15% from baseline. The plateau occurred despite a steady increase in the cumulative dose of azathioprine per kg of bodyweight at each time interval (from 1.75 mg/kg [SD 0.75] at baseline to 2.44 mg/kg [SD 0.77] at T5), as shown in figure 3.
Fig. 1.

Trend in differential white blood cell (WBC) count.
Fig. 2.

Disease-specific trends in mean corpuscular volume (MCV).
Fig. 3.

Mean dose of azathioprine against time.
Ten children were macrocytic (MCV >100 fL) at 24 months. These children were noted to have a significantly greater MCV at baseline (80.5 fL [SD 3.9] vs 70.5 fL [SD 4.3]; p = 0.006) than children who had normocytic red blood cells at 24 months.
The relationship between MCV and WBC values (or change in MCV and change in WBC) across the study period was not influenced by age, sex, azathioprine dose per kg of bodyweight, concomitant infliximab use, elemental diet, or corticosteroid use being factored into a multifactorial regression. Furthermore, TPMT was noted to be a weak predictor of the relationship between MCV and WBC (p < 0.05; r2=15%) in a multifactorial regression analysis. However, the association between MCV and WBC count was significantly strengthened by including a diagnosis of Crohn’s disease in the regression (p < 0.05; r2 = 17%).
Discussion
This study defines a temporal relationship between WBC count and MCV. Opinion that elevated MCV could predict leukopenia secondary to azathioprine toxicity is commonplace; however, our data do not support this notion. In fact, since leukopenia generally precedes macrocytosis, this is unlikely to be the case. We therefore suggest that although macrocytosis may indicate toxicity, it is less likely to be able to predict it in a timely manner. Since the majority of the reduction in WBC, lymphocyte, and neutrophil counts occurs in the first 6 months, it is more likely that regular blood monitoring in the first 6 months of azathioprine therapy will detect drug-induced bone marrow suppression, although this can occur at any stage of therapy.[12] Since indices stabilize by 12 months, the frequency of monitoring can be reduced thereafter.
Our findings identified that the patients who were macrocytic at 24 months were also noted to have an elevated MCV at baseline. There was no clinical evidence of toxicity in these patients. It is possible that this group had a greater baseline MCV due to, as yet, unidentified genetic factors or disease-related factors such as vitamin B12 or folate deficiency. Our study did not include assessments of B12 levels or folate as potential causes of macrocytosis. Although MCV levels reached a plateau, they never returned to baseline, indicating a likely sustained effect of azathioprine rather than a confounding factor. If vitamin B12 or folate deficiency were presumed to be the confounding factor, one would expect MCV to return to baseline as the clinical status of the disease improved. This did not occur. Therefore, it is more likely that pretreatment factors that are, as yet, unknown may predispose some children to a greater degree of drug-induced macrocytosis.
It is postulated that azathioprine-induced macrocytosis is due to inhibition of DNA synthesis in bone marrow precursor cells, leaving both RNA and protein synthesis ongoing and leading to cellular accumulation of nucleic acids.[13] The difference in individual toxicity may be explained by genetic polymorphisms of the genes encoding enzymes in thiopurine metabolism.[12] Further studies will be necessary to determine if this cohort of patients is at increased risk of malignancies.
This study is limited by its retrospective nature and population size. Trends could be assessed by a prospective review, where each patient is monitored over a full 24-month period. In this study, through a cohort effect, there was a gradual reduction in subject numbers analyzed at each time interval. A prospective review would allow assessment of the Paediatric Crohn’s Disease Activity Index, so that trends in hematologic and biochemical parameters could also be correlated with clinical response. In addition, our graphical analysis gives cumulative data, which might have masked extremes of leukopenia and macrocytosis.
Conclusion
Our study has identified that leukopenia generally precedes macrocytosis. Macrocytosis would therefore not be a good indicator in predicting onset of leukopenia. Pretreatment factors that are, as yet, unrecognized may predispose some children to drug-induced macrocytosis. This could also represent a cohort of children who are at risk of malignancies, necessitating further study.
Acknowledgements
No sources of funding were used to conduct this study or prepare this article. The authors have no conflicts of interest that are directly relevant to the content of this article.
References
- 1.Tiede I, Fritz G, Strand S, et al. CD28-dependent Rac1 activation is the molecular target of azathioprine in primary human CD4+ T lymphocytes. J Clin Invest. 2003;111:1133–45. doi: 10.1172/JCI16432. [DOI] [PMC free article] [PubMed] [Google Scholar]
- 2.Timmer A, McDonald JW, Macdonald JK. Azathioprine and 6-mercaptopurine for maintenance of remission in ulcerative colitis. Cochrane Database Syst Rev. 2007;3:CD000478. doi: 10.1002/14651858.CD000478.pub2. [DOI] [PubMed] [Google Scholar]
- 3.Present DH, Meltzer SJ, Krumholz MP, et al. 6-Mercaptopurine in the management of inflammatory bowel disease: short- and long-term toxicity. Ann Intern Med. 1989;111:641–9. doi: 10.7326/0003-4819-111-8-641. [DOI] [PubMed] [Google Scholar]
- 4.Karran P, Attard N. Thiopurines in current medical practice: molecular mechanisms and contributions to therapyrelated cancer. Nat Rev Cancer. 2008;8:24–36. doi: 10.1038/nrc2292. [DOI] [PubMed] [Google Scholar]
- 5.Masunaga Y, Ohno K, Ogawa R. Meta-analysis of risk of malignancy with immunosuppressive drugs in inflammatory bowel disease. Ann Pharmacother. 2007;41:21–8. doi: 10.1345/aph.1H219. [DOI] [PubMed] [Google Scholar]
- 6.Disanti W, Rajapakse RO, Korelitz BI. Incidence of neoplasms in patients who develop sustained leukopenia during or after treatment with 6-mercaptopurine for inflammatory bowel disease. Clin Gastroenterol Hepatol. 2006;4:1025–9. doi: 10.1016/j.cgh.2006.03.018. [DOI] [PubMed] [Google Scholar]
- 7.Mackey AC, Green L, Liang LC, et al. Hepatosplenic T cell lymphoma associated with infliximab use in young patients treated for inflammatory bowel disease. J Pediatr Gastroenterol Nutr. 2007;44:265–7. doi: 10.1097/MPG.0b013e31802f6424. [DOI] [PubMed] [Google Scholar]
- 8.Bernstein CN, Artinian L, Anton PA, et al. Low-dose 6-mercaptopurine in inflammatory bowel disease is associated with minimal hematologic toxicity. DigDis Sci. 1994;39:1638–41. doi: 10.1007/BF02087769. [DOI] [PubMed] [Google Scholar]
- 9.Fraser AG, Orchard TR, Jewell DP. The efficacy of azathioprine for the treatment of inflammatory bowel disease: a 30 year review. Gut. 2002;50:485–9. doi: 10.1136/gut.50.4.485. [DOI] [PMC free article] [PubMed] [Google Scholar]
- 10.Thomas CW, Jr, Lowry PW, Franklin CL. Erythrocyte mean corpuscular volume as a surrogate marker for 6-thioguanine nucleotide concentration monitoring in patients with inflammatory bowel disease treated with azathioprine or 6-mercaptopurine. Inflamm Bowel Dis. 2003;9:237–45. doi: 10.1097/00054725-200307000-00004. [DOI] [PubMed] [Google Scholar]
- 11.Glas J, Torok HP, Daczo J, et al. The leukocyte count predicts the efficacy of treatment with azathioprine in inflammatory bowel disease. Eur J Med Res. 2005;10:535–8. [PubMed] [Google Scholar]
- 12.Derijks LJ, Gilissen LP, Hooymans PM. Review article: thiopurines in inflammatory bowel disease. Aliment Pharmacol Ther. 2006;24:715–29. doi: 10.1111/j.1365-2036.2006.02980.x. [DOI] [PubMed] [Google Scholar]
- 13.Al-Safi S, Tashtoush B, Abdul-Razzakl K. Azathioprineinduced fatal macrocytic anemia in rabbits. Pol J Pharmacol. 2002;54:513–6. [PubMed] [Google Scholar]


