

Abstract
Objectives
To quantify geographical variation in the relative contribution of parasitic infections, socioeconomic factors and malnutrition in the aetiology of anaemia among schoolchildren across Kenya, thereby providing a rational basis for the targeting of an integrated school health package.
Design
Nationally representative cross-sectional survey data were collected using standard protocols. For all included children, data were recorded on haemoglobin (Hb) concentration and common parasitic infections (Plasmodium falciparum, hookworm and schistosomes) and socioeconomic indicators. Ecological proxies of malnutrition and food security were generated using Demographic and Health Survey and UN Food and Agriculture Organization food security data, respectively. Spatially explicit, multilevel models were used to quantify impact upon child Hb concentration.
Setting
Randomly selected schools in ecologically diverse settings across Kenya.
Main outcome measures
Mean Hb concentration adjusted for infection, nutritional and socioeconomic risk factors; associated risk ratios and adjusted Population Attributable Fractions (PAFs) for anaemia, by region.
Results
Data were available for 16 941 children in 167 schools; mean Hb was 122.1 g/l and 35.3% of children were anaemic. In multivariate analysis, mean Hb was significantly lower in boys and younger children. Severe malnutrition and interactions between P falciparum and hookworm infections were significantly associated with lower Hb, with greater impacts seen for coinfected children. The contribution of risk factors to anaemia risk varied by province: in 14-year-old girls, PAFs ranged between 0% and 27.6% for P falciparum, 0% and 29% for hookworm and 0% and 18.4% for severe malnutrition.
Conclusions
The observed geographical heterogeneity in the burden of anaemia attributable to different aetiological factors has important implications for the rational targeting of antianaemia interventions that can be included in an integrated school health programme.
Keywords: Nutrition & Dietetics
Article summary.
Article focus
Cross-sectional haematological and parasitological school survey data for the period 2008–2010 in Kenya.
Spatially explicit, Bayesian multilevel models quantifying impact of infection, nutrition and social risk factors on child haemoglobin (Hb) concentration and adjusted Population Attributable Fractions for anaemia by province.
Implications of spatial heterogeneity in underlying Hb status and risk factors for cost-effective geographical targeting of school-based antianaemia interventions, including deworming, malaria control and school feeding.
Key messages
For school-aged children living in Kenya:
Plasmodium falciparum, hookworm and schistosomes are all significantly associated with lower mean Hb, with the largest impact seen for coinfection with hookworm and P falciparum, emphasising the importance of parasitic infections in the aetiology of anaemia in African school-age populations.
Poor food intake is suggested to be an important contributor to anaemia in school-aged children.
There is pronounced geographical heterogeneity in the burden of anaemia attributable to these identified risk factors, underscoring the importance of appropriately targeting interventions.
Strengths and limitations of this study
A large and uniquely detailed dataset coupled with a novel Bayesian modelling framework that allowed for simultaneous quantification of the mean shift in Hb associated with each risk factor, and subnational risk of anaemia in school-aged children attributable to risk factors.
Dependence upon cross-sectional design and ecological data limits inference of causality; incorporation of individual, nutritional-related factors and iron status indicators would improve quantification of their involvement.
Background
Children of school-going age (5–14 years) make up one-quarter of the population of subSaharan Africa,1 and the proportion of these children attending school has never been higher, in large part due to the recent global and national commitments to universal primary education school enrolment.2 Yet many children enrolled in school suffer from poor health and malnutrition and, as a result, are less likely to attend and complete school or achieve their full educational potential.3 For example, up to 40% of 5–14-year-olds are estimated to be anaemic,4 5 which can affect cognition and learning.6 7 Anaemia also affects the health of older girls as they reach puberty, potentially impacting upon future motherhood and the nutrition of the next generation of learners.8 9 Fortunately, a number of simple and cost-effective interventions are available to avert the burden of anaemia, including malaria control,10 11 deworming,12 iron supplementation13 14 and school-feeding15—interventions which are increasingly delivered as part of an integrated school health package.16
Identifying the optimal combination of school health interventions requires reliable information on both the geographical distribution of anaemia and the relative contribution of different aetiological factors. A previous study of anaemia among preschool children in West Africa employed a geostatistical framework to interpolate estimates of anaemia among children aged 1–4 years collected through demographic health surveys (DHS), while incorporating ecological predictions of malaria and helminth infection. While this work helped to define the geographical distribution and limits of anaemia in the region, it did not quantify spatial variation in the risk attributable to different aetiological factors.17 Here, we take advantage of uniquely detailed haematological data collected during a comprehensive, national school health survey conducted across Kenya between 2008 and 2010.18 An initial analysis showed that the relative contribution of Plasmodium falciparum to anaemia varied according to malaria transmission zones.19 We extend this to investigate the relationships between haemoglobin (Hb) concentration and common parasitic infections (including P falciparum, hookworm and schistosomes), socioeconomic indicators and proxies of malnutrition and food security for schoolchildren across Kenya. We use an innovative Bayesian approach that quantifies the mean shift in Hb associated with each risk factor, which we use to estimate subnational variation in the risk of anaemia in school-aged children attributable to malnutrition, malaria and helminths to define targets for integrated packages of school health interventions.
Methods
School survey data
This study uses cross-sectional school survey data collected between September 2008 and March 2010 using standard protocols, described elsewhere.18 20 In brief, 480 government primary schools were selected to provide a national assessment of malaria and anaemia among schoolchildren. In a random subset of 167 schools, stool and urine samples were also collected to assess the prevalence and intensity of helminth infections. At each school, 10 children plus 1 reserve of each sex were randomly selected from each of classes 2–6 from the children present that day. This captures children aged 4–16, although 80% of the included children were aged between 8 and 13 years. Selected children were asked to provide a fingerprick blood sample, which was used to assess Hb using a portable photometer (Haemocue, Angelholm, Sweden) and Plasmodium infection in the peripheral blood based on microscopy-corrected malaria rapid diagnostic test (RDT)18 results, whereby slides were subsequently read for all RDT positives. Children in all schools were asked to provide stool samples which were examined for the eggs of intestinal nematodes (Ascaris lumbricoides, Trichuris trichiura and hookworm species) and Schistosoma mansoni using the Kato-Katz method. In schools on the coast, where Schistosoma haematobium is widespread, children were asked to provide urine samples which were examined by urine filtration. A questionnaire was administered to all pupils to obtain data on insecticide-treated net ownership and use, history of anthelmintic medication, key socioeconomic variables, household construction and education of the child's parent/guardian. School locations were determined using a hand-held Global Positioning System and classified as urban using an updated 2010 urban extents mask derived from GRUMP.21 22
Nutritional proxy data
Anthropometric and food intake data were not available for all of our study population, and we instead relied on ecological measures. Proxy data for macronutritional status in school-aged children were derived from the Kenya 2008–2009 DHS.23 24 Anthropometric measurements were extracted for children ≤5 years and for women of childbearing age (ages 15–49; see table 1). For children ≤5 years, the reported proportion consuming food rich in iron (flesh and organ meat) in the past 24 h was also extracted. These indicators, which provide a general measure of nutritional status in the wider community, were geo-located to the centre of each sampling cluster. Bayesian kriging,25 a geostatistical interpolation method that accounts for the error introduced by estimating the semivariogram model (a function of the variability in outcome against the distance separating observation points), was used to interpolate a distribution of possible values for each indicator to survey school locations. This was done by incorporating the full posterior distribution of the Bayesian semivariogram model, estimated using the Bayesian statistical software WinBUGS V.14.1 (Medical Research Council Biostatistics Unit and Imperial College London). The mean predicted prevalence values were then categorised according to WHO-defined cut-off values for severity of malnutrition by prevalence range (table 1). See the technical appendix for further details.
Table 1.
Definition of included anthropometric indicators, and population-based cut-off values for severity of malnutrition, as defined by the WHO
| Severity of malnutrition (prevalence range for <6 years) (%) | ||||
|---|---|---|---|---|
| Anthropometric measurement | Low severity | Medium/high severity | Very high severity | |
| Stunting | Height-for-age Z-score–2 SD | <20 | 20–40 | >40 |
| Wasting | weight-for-height Z-score >–2 SD | <5 | 5–15 | >15 |
| Underweight | weight-for-age or BMI-for-age Z-score > –2 SD | <10 | 10–30 | >30 |
BMI, body mass index.
Two additional indicators were used to describe general food availability at each school location: predominant source of livelihood (based on the 2010 FAO Livelihood zones26 27); and food security conditions at the time of the survey (based on the FAO Food Insecurity Severity Scale27 28). Both indicators were obtained from the Famine Early Warning System Network (FEWS NET; http://www.fews.net). Information on the intended provision of formal, government-run school-feeding programmes was abstracted from the Homegrown School Meals Programme (HGSMP) and the Emergency HGSMP 2010 registers provided by the Kenya Ministry of Education (personal communication).
Analysis
A schematic summarising the major steps in our analysis strategy is provided in figure 1. Hb levels were adjusted for altitude and individuals were classified as anaemic using age-specific and sex-specific cut-offs.29 Children were classified as having medium/high-intensity hookworm infection if the infection intensity exceeded 100 epg, and medium/high-intensity S haematobium infection if the infection intensity exceeded 500 epg (both representing the top 10th percentile). Reported information on the ownership of household assets and household construction was used to generate wealth indices using principal component analysis,30 and the resulting scores were divided into quintiles.
Figure 1.
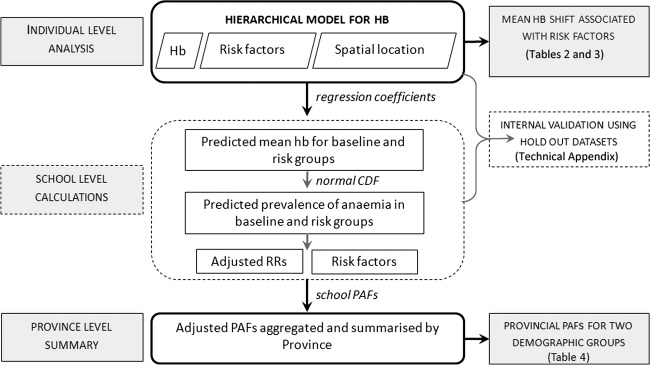
Schematic of adopted analysis strategy. The dual aim of this analysis strategy was to (1) model the impact of risk factors on the children's haemoglobin (Hb) levels, and (2) estimate the adjusted Population Attributable Risk Fraction (PAF) associated with important, modifiable risk factors. This process was repeated at each realisation of the Bayesian hierarchical model to provide posterior mean estimates and credible intervals for all parameters of relevance.
The initial candidate set of predictor variables for univariate analysis included age, sex, relative socioeconomic status, education level of the household head, protective behaviours (bednet usage and deworming) and infection status with hookworm, schistosome and P falciparum, in addition to school-level ecological covariates including urban/rural location, predicted prevalence of anthropometric indicators in younger children and women of reproductive age, livelihood zone and food security status and intended provision of school-feeding. In order to select candidate variables for spatial multivariable analysis, univariate analysis was undertaken using logistic regression (criteria: Wald test p<0.1) using Stata 11.1 software (StataCorp). SE were adjusted for dependence between individuals within schools using a clustered sandwich estimator.31 Backward-stepwise elimination was then used to generate a minimum adequate multivariate model; excluded covariates (p>0.05) were retested in the minimal model to confirm lack of association. Basic age–sex interaction terms were also investigated, but there was insufficient evidence that these improved the overall fit of the model.
Retained covariates were included in a spatial multivariable Bayesian mixed-effects linear regression model using WinBUGs 14.1. This model included individual and school-level ecological fixed effects and a school-level geostatistical random effect (using an isotropic, stationary exponential decay function),25 thereby incorporating a degree of spatial smoothing. Uncertainty in the predicted prevalence of anthropometric proxy indicators was incorporated by modelling these covariates as random variables with a β-distribution, defined using the prediction posterior distribution. At each model realisation, malnutrition was categorised as either low, medium/high or severe for each school location, according to table 1.
Given the large observed differences in mean Hb and prevalence of predictors by region and demographic group, adjusted Population Attributable Fractions (PAFs) for anaemia were estimated for two indicator demographic groups (boys aged 7 years, and girls aged 14 years) for each province in Kenya. In brief, at each model realisation, we estimated the prevalence of anaemia in each of the risk groups based upon the posterior mean and SD of the Hb distribution within each school. These were used to estimate (1) the relative risk of anaemia for each risk group compared with the baseline risk, and (2) the associated adjusted PAF, as described by Rockhill et al.32 Estimates were subsequently summarised by province. Full statistical notations of Bayesian geostatistical modelling, PAF and model validation procedures are presented in the technical appendix. Model validation using hold out datasets, presented in detail in the accompanying technical appendix, suggests a very high degree of correlation at the school level between the observed and expected mean Hb levels (R2>0.98) and the prevalence of anaemia (R2>0.95), suggesting that the approach we used to estimate anaemia prevalence (and associated attributable fractions) was appropriate.
Results
Data on Hb, malaria parasitaemia and helminth infection were available for 16 941 children (aged 5–16) in 167 schools (figure 2). The mean altitude-adjusted Hb concentration was 122.1 g/l, with 35.3% of children estimated to be anaemic. The spatial distribution of the unadjusted Hb data is presented in figure 2, summarised by school. There was significant geographical heterogeneity in mean Hb across the country (Moran's I p<0.001), with the lowest average levels observed in Coast Province (120.1 g/l) and the highest in Central Province (134.0 g/l). Univariate analysis suggested that Hb levels increased with age and with relative socioeconomic status, and were significantly lower in individuals infected with P falciparum or medium/high-intensity helminth infections (table 2). Hb was also significantly lower in areas with predicted severe malnutrition, although there was no ecological relationship with predicted consumption of iron-rich foods. Univariate analysis also suggests a relationship between Hb and food availability, with significantly lower Hb levels in children living in very food-insecure areas.
Figure 2.

Spatial distribution of mean haemoglobin distribution across Kenya, by school. Hb is adjusted for altitude; population density (persons/km2) is shown for reference.
Table 2.
Mean Hb concentration according to infection status, nutritional proxies and other characteristics in 16941 children aged 5–16 years (univariate analysis)
| Variable | Data type and source | Children no. (%) | Mean Hb shift, g/l (SE) | p Value |
|---|---|---|---|---|
| Sex | ||||
| Female | Individual—KHS | 8314 (49.1) | (vs female) | |
| Male | Individual—KHS | 8627 (50.9) | −1.36 (0.28) | <0.001 |
| Age (in years) | Individual—KHS | – | +0.89 (0.11) | <0.001 |
| Socioeconomic indicators | ||||
| Educated household head * | Individual—KHS | 8,333 (49.2) | +0.82 (0.41) | 0.05 |
| Household owns a mobile phone | Individual—KHS | 10 065 (59.4) | +1.42 (0.40) | <0.001 |
| SES quintile | ||||
| Lowest | Individual—KHS | 3,272 (20.4) | (vs. lowest) | |
| Mid (quintiles 2–4) | 9,926 (61.8) | +2.35 (0.50) | <0.001 | |
| Highest | 2,854 (17.8) | +3.07 (0.82) | <0.001 | |
| Urban location | School-level—digital UE map | 1,237 (7.3) | 1.56 (1.52) | 0.3 |
| Current infections | ||||
| P. falciparum parasitaemic | Individual—KHS | 607 (3.6) | −3.36 (0.77) | <0.001 |
| Med/high-intensity hookworm (>100 epg) | Individual—KHS | 931 (5.5) | −2.81 (0.69) | <0.001 |
| Med/high-intensity S. haematobium (>500 epg) | Individual—KHS | 799 (4.7) | −3.81 (1.02) | <0.001 |
| Usually sleeps under a net | Individual—KHS | 9,763 (57.6) | −1.78 (0.52) | 0.001 |
| Taken anthelmintic in the previous 6 months | Individual—KHS | 7,494 (44.2) | +1.24 (0.48) | 0.01 |
| Nutritional proxies | ||||
| Wasting in under 5s (%)† | ||||
| Under 5% | Ecological—interpolated from 2008 DHS | 4,027 (23.8) | (vs <5%) | |
| 5–15% | 10 257 (60.6) | −5.58 (1.04) | <0.001 | |
| Over 15% | 2,657 (15.7) | −8.14 (1.21) | <0.001 | |
| Low BMI in adult women (%)† | ||||
| Under 20% | Ecological—interpolated from 2008 DHS | 12 867 (76.0) | (vs. <20%) | |
| Over 20% | 4,072 (24.0) | −1.98 (0.80) | 0.01 | |
| Consumption of iron rich foods in under 5s (%)† | ||||
| Under 25% | Ecological—interpolated from 2008 DHS | 14 572 (86.0) | (vs. <25%) | |
| Over 25% | 2,369 (14.0) | +1.07 (1.24) | 0.4 | |
| School-feeding (SF) status: ‡ | ||||
| Not an SF district | School-level—MoE registers | 3,690 (21.8) | (vs. not SF dist) | |
| SF district—no programme in school | 8,417 (49.7) | −7.34 (1.08) | <0.001 | |
| SF district—programme in school | 4,834 (28.5) | −4.80 (1.19) | <0.001 | |
| Generalised livelihood zone§ | ||||
| Mixed farming | Ecological—FEWSNET | 3,295 (19.5) | (vs. mixed) | |
| Pastoral and agro-pastoral | 4,991 (29.5) | +1.11 (1.45) | 0.4 | |
| Riverine and fishing | 641 (3.8) | +2.08 (2.42) | 0.4 | |
| Medium potential farming | 4,073 (24.0) | −2.93 (1.13) | 0.02 | |
| High potential farming | 3,941 (23.3) | +1.37 (2.14) | 0.2 | |
| Food security status¶ | ||||
| Generally food secure | Ecological—FEWSNET | 2,756 (16.3) | (vs. secure) | |
| Moderately food insecure | 7,755 (45.8) | −3.20 (1.27) | 0.01 | |
| Highly food insecure | 6,048 (35.7) | −6.17 (1.25) | <0.001 | |
| Extremely food insecure | 382 (2.3) | −5.12 (1.52) | 0.001 | |
*Household head educated to primary complete or above (reported).
†Interpolated from Kenya 2008/2009 DHS survey.
‡School included in either the Homegrown School Meals Programme (HGSMP) or Emergency HGSMP 2010 registers.
§Based on the USAID/FEWSNET Generalised Livelihood Zone 2010 Classification for Kenya.
¶Based on the USAID/FEWSNET Food Insecurity Severity Scale for the quarter corresponding to the KSH survey date.
DHS; Kenya Demographic Health Survey conducted in 2008/2009. MoE; Kenya Ministry of Education. FEWSNET; Famine early warning system network; KSH; Kenya School Health survey (conducted in 2008–2010).
Bayesian hierarchical model of Hb
Table 3 presents a multivariate analysis of factors associated with Hb levels. On average, boys had lower mean Hb compared with girls by 1.53 g/l (95% BCI 1.13 to 1.94 g/), and older children tended to have higher Hb levels, increasing by 1.08 g/l (95% BCI 0.99 to 1.17 g/l) with each yearly age interval. There was strong evidence for a multiplicative negative interaction between infection status and Hb levels, highlighting the health impacts of parasitic infections in school-aged children. Children with medium/high-intensity hookworm infection had Hb levels 1.03 g/l (95% BCI 0.02 to 2.00 g/l) lower than uninfected children, those with P falciparum 3.00 g/l (95% BCI 1.68 to 4.29 g/l) lower and S haematobium infection 1.75 g/l (95% BCI 0.60 to 2.92 g/l); children coinfected with both P falciparum and medium/high-intensity hookworm infection had Hb levels 5.56 g/l (95% BCI 2.67 to 8.64 g/l) lower than uninfected children.
Table 3.
Bayesian hierarchical multivariate regression model for haemoglobin levels
| Variable | Mean Hb shift (g/l) | 95% BCI/SD |
|---|---|---|
| Baseline haemoglobin | 117.3 | (113.9, 120.5) |
| Sex (male) | −1.53 | (−1.94, −1.13) |
| Age (in years) | +1.08 | (+0.99, +1.17) |
| SES quintile (vs quintiles 2–4) | ||
| Lowest | −0.56 | (−1.14, +0.02) |
| Highest | 0.25 | (−0.31, +0.86) |
| Med/high-intensity S. haematobium (>500 epg) | −1.75 | (−2.92, −0.60) |
| Med/high-intensity hookworm (>100 epg) | −1.03 | (−2.00, −0.02) |
| P. falciparum parasitaemic | −3.00 | (−4.29, −1.68) |
| Med/high hookworm—P. falciparum coinfection | −5.56 | (−8.64, −2.67) |
| Wasting in under 5s (vs <5% prevalence) | ||
| 5–15% | −4.39 | (−6.56, −2.09) |
| >15% | −9.74 | (−12.16, −7.45) |
| School-feeding (SF) status: | ||
| SF district—no programme in school | −2.14 | (−4.76, +0.46) |
| SF district—programme in school | −2.78 | (−5.43, −0.21) |
| Random effect terms | ||
| Individual σ2 | 183.6 | (2.02) |
| Spatial σ2 (school-level) | 29.5 | (7.93) |
| Range of spatial correlation (km) | 194 | (99318) |
Proxy measures of nutritional status were also strongly associated with Hb levels. Schoolchildren living in areas predicted to have severe prevalence of wasting had Hb levels that were on average 9.74 g/l (95% BCI 7.45 to 12.16 g/l) lower than those living in low-risk areas. School-feeding programmes also appear to have been targeted to districts with increased risk of anaemia, although examination of the 95% credible intervals suggests no statistical difference within target districts between the mean Hb levels in schools with and without intended provision of formal school-feeding programmes. Perhaps surprisingly, food security at the time of the survey (a qualitative measure that allows adjustment for acute conditions and the impact of seasonality) was not associated with Hb levels in multivariate analysis. Similarly, after accounting for all other factors in the model, relative socioeconomic status was not significantly associated with Hb levels.
The random effects variance components from this model indicate that most of the residual variation remains between children within schools: of the total unexplained variability in Hb, 13.8% occurred at the school level, while 86.2% occurred between children within schools. Closer examination of the spatial school-level random effect suggests that, after accounting for included predictors, most schools (81%) had similar Hb levels that could not be distinguished statistically (shown in green in figure 3). There was, however, some residual spatial clustering of schools with higher/lower than expected Hb levels (foci radii of ∼190 km, table 3) with significantly lower mean Hb levels observed in schools in the far south of Coast Province and in Nyanza and Western provinces (figure 3). Interestingly, a comparison of the observed prevalence of P falciparum and medium/high-intensity hookworm suggests that the prevalence of both infections was higher for these schools than for other schools in these provinces (P falciparum Kruskal-Wallis p=0.02; medium/high-intensity hookworm Kruskal-Wallis p 0.01). In contrast, the mean Hb levels were significantly higher for schools in the Rift Valley, Central and Eastern provinces.
Figure 3.

Graph of spatial random-effect (school-level residual) from the multivariate, Bayesian hierarchical model for Hb. Each point represents one school; the posterior mean is shown by the dot and the 95% BCI are represented by the error bars. The horizontal straight line in the middle of the graph represents the overall mean of the residuals, which are zero centred. Inset shows the school locations, shaded by the value of the school-level residual.
Adjusted population-attributable risk fractions
Using the final Bayesian hierarchical model, we estimated for two demographic groups (girls aged 14 years, and boys aged 7 years) the PAF of anaemia due to P falciparum, medium/high-intensity hookworm infection, medium/high-intensity S haematobium infection, and acute malnutrition (prevalence of wasting in under 5s exceeding 15%) for each province in Kenya, adjusting for all other included predictors (table 4). Our results suggest that the relative contribution of each risk factor varies considerably by province. For example, in Coast Province, 13% (95% BCI 4% to 23%) of anaemia in 14-year-old girls attending school may be attributable to medium/high-intensity hookworm, comparing with 6% (95% BCI 2 to 10%) to P falciparum infection and 3.1% (95% BCI 0% to 8%) to schistosomiasis. Meanwhile, the results suggest that a reduction in acute malnutrition in Coast Province (to <5% wasting in ≤5s) would reduce anaemia prevalence by 19% (95% BCI 0% to 38%). This contrasts with Western Province, where the estimated risk of anaemia attributable to medium and high-intensity hookworm is 29% (95% BCI 1% to 55%) and to P falciparum 24% (95% BCI 0% to 41%); no schoolchildren in this district are exposed to S haematobium and acute malnutrition in under 5s is predicted not to exceed 5%. The wide 95% BCIs observed reflect (1) the smaller sample sizes for provinces other than Coast (given that N = schools, not individuals), and (2) the additional uncertainty surrounding proxies for malnutrition. Trends in PAFs observed for predictors in 7-year-old boys mirror those for older girls but are generally lower, a reflection of the lower baseline Hb levels in this group.
Table 4.
Predicted adjusted population attributable risk fractions for key predictors across Kenya
| Population attributable risk fractions by province, % (95% BCI) |
||||||
|---|---|---|---|---|---|---|
| Central | Coast | Eastern | Nyanza | Rift Valley | Western | |
| 14-year-old girls | ||||||
| Observed prevalence of anaemia | 3.3 | 37.3 | 34.7 | 30.8 | 19.4 | 25.0 |
| PAF for | ||||||
| Med/high-intensity hookworm | n/a | 13.0 (3.7, 23.1) | 5.9 (0, 12.5) | 8.2 (0, 30.0) | 5.0 (0, 12.5) | 29.0 (1.4, 55.1) |
| Malaria | n/a | 5.8 (2.0, 10.4) | n/a | 27.6 (0, 49.1) | n/a | 23.6 (0, 40.9) |
| Schistosomiasis | n/a | 3.1 (0, 0.08) | n/a | n/a | n/a | n/a |
| Acute malnutrition* | n/a | 18.5 (0, 37.9) | 18.4 (0, 73.0) | n/a | 16.0 (0, 52.5) | n/a |
| 7-year-old boys | ||||||
| Observed prevalence of anaemia | 5.0 | 43.3 | 23.2 | 43.2 | 22.4 | 19.2 |
| PAF for | ||||||
| Med/high-intensity hookworm | n/a | 5.6 (1.0, 10.3) | n/a | 11.0 (0, 21.6) | 3.4 (0, 6.6) | 13.5 (0, 27.5) |
| Malaria | n/a | 1.5 (0.3, 6.1) | n/a | 14.3 (0, 32.0) | n/a | 15.8 (0, 28.1) |
| Schistosomiasis | n/a | 0 (0, 5.5) | n/a | n/a | n/a | n/a |
| Acute malnutrition* | n/a | 16.4 (0, 33.5) | 16.4 (0, 67.1) | n/a | 14.1 (0, 45.9) | n/a |
Estimates are based on the predicted numbers anaemic in each risk group given by the mean and individual-level SD at each realisation of the Bayesian multivariate model for Hb, and are shown for two demographic groups by Province.
N/a, no children are exposed (ie, prevalence of predictor is zero in this demographic group).
*Exposure to ‘acute malnutrition’, prevalence of wasting in under 5s exceeds 5%.
Discussion
As global commitment and resources for school health and nutrition initiatives grow,16 there is an urgent need to strengthen our understanding of the likely impact of interventions aimed at tackling important health and development outcomes such as anaemia. This requires a detailed understanding of the relative contribution of aetiological factors at policy-relevant scales. Here, we present a uniquely detailed national analysis of risk factors for anaemia among schoolchildren in 167 schools across Kenya. We introduce a new approach using multilevel linear modelling to provide a detailed description of the varying contribution of risk factors by administrative unit (province), while fully accounting for spatial variation in the underlying mean Hb. The results provide a vital decision-making tool for cost-effective targeting of the delivery of integrated packages of interventions tailored to each province, with the aim of reducing anaemia in schoolchildren. For example, school-feeding programmes in the Coast, Eastern and Rift Valley provinces may want to consider including iron-rich foodstuffs, while programmes in Nyanza and Western provinces, omitting malaria control initiatives, may not see the desired improvements in childhood anaemia.
Our analysis found evidence that P falciparum, hookworm and schistosomes were each significantly associated with lower mean Hb, observations consistent with current knowledge. Such findings corroborate recent results from the Global Burden of Disease study, which suggests that globally for anaemia 10.2% of years lived with a disability across all ages could be attributed to hookworm, 17.9% to malaria and 3.4% to schistosomiasis (Jasrasaria J, Murray CJL, Naghavi M. Global Burden of Disease 2010 Estimate: Strategy Report for Anaemia Envelope. (Unpublished report). Personal Communication 2012). Our analysis provides three additional insights into the epidemiology of anaemia. First, we confirm small-scale studies3,3–3,7 that have suggested that coinfection with hookworm and P falciparum may have a multiplicative effect on the Hb level—effects which occur across Kenya. Second, we demonstrate pronounced geographical heterogeneity in the burden of anaemia attributable to identified risk factors. Associations for hookworm and P falciparum were most pronounced in Western Province, where the results suggest that together these two infections were attributable for close to 53% (95% BCI 1.4% to 96%) of anaemia cases in girls aged 14 years. Together, these findings emphasise the importance of parasitic infections in the aetiology of anaemia in school-aged children and underscore current efforts to control helminths and malaria as part of integrated school health programmes.3,8 39 The PAFs provided here are useful for translating our findings into numbers that can help policy decision makers appreciate the potential benefits of carefully targeted programmes tailored to each province that strike the best balance between dietary interventions, deworming and malaria control.17 40
Third, while acknowledging that we rely on proxy indicators, our results do suggest that poor food intake is an important contributor to anaemia in schoolchildren: the final model indicates that in communities where acute malnutrition is a severe public health problem (ie, where wasting in under 5s exceeds 15%), the mean Hb levels in school-aged children are on average 9.7 g/l lower than in well nourished communities, and as such eliminating acute malnutrition as a public health problem could avert close to 20% of anaemia cases in 14-year-old girls. This is consistent with the limited evidence from smaller individual-level studies suggesting an association between under-nutrition and anaemia in school-aged populations.4,1 4,2
Our spatially explicit hierarchical approach seeks to maximise the usefulness of these observational, cross-sectional data and the results show that while much of the between-school variation could be explained by included risk factors, a high degree of variation does still remain within schools. This suggests that there are individual-level factors beyond those measured that still need to be considered. In addition to individual iron status or food intake, there are a number of candidates. HIV infection is potentially likely to be a contributor, as even in asymptomatic HIV-infected individuals, anaemia is a common manifestation.4,3 4,4 We were also unable to account for genetic traits such as sickle cell and other haemoglobinopathies,4,5 or for the potential effect of menarche in adolescent girls.4,6
A number of additional study limitations should also be acknowledged. As we have previously acknowledged,20 cross-sectional studies such as this are inevitably subject to a number of limitations including the potential of ecological fallacy, especially when incorporating population-level estimates. We acknowledge that our indicator of school-feeding (inclusion in the government school-feeding registers) is far from optimal and that the study would have benefited from detailed individual-level data on iron status and food intake. In addition, modelled associations are likely to be lower than the true impact, due to non-systematic measurement error in our infection indicators, which rely on single samples using standard parasitological diagnosis with <100% sensitivity.4,7 4,8 Despite a robust stratified random sampling frame, our results may also be subject to some selection bias, as very ill children such as those with acute infections and severe chronic malnutrition may have been absent on the day of the school survey and thus not included in the study sample. Although contemporary regional or school-level attendance data are not available, the overall school attendance rates are known to vary geographically across Kenya.49 For example, in 2005 (the most recent year for which subnational net primary school attendance figures are available), the reported net attendance in Nyando District (Nyanza Province) was greater than 90% for both men and women, while in Turkana District (Rift Valley Province) the levels were between 30% and 40%.49 If the Hb levels differ systematically between non-attending and attending school-aged children, this may act to either dilute or exaggerate geographical variation in Hb levels.
An additional factor that would influence individual-level variation is the onset of menarche in girls: no specific data were collected to record this, and the inclusion of a basic age-sex interaction term did not improve the model fit suggesting that more detailed information is required. Finally, this analysis is unable to account for the impact of recently cleared infections on current Hb status. The presented results represent a snapshot of the period 2008–2010 and it is conceivable that seasonality and intervention-related factors may have confounded the results. However, the inclusion of mosquito net use, recent deworming or food security (a seasonal covariate) in multivariate models did not improve model fits, suggesting that temporal and control factors were relatively unimportant.
Conclusions
A recent focus on schoolchild and adolescent health has emphasised the need to develop a deeper understanding of factors impacting health and development of this population group.50–5,3 Here, we present a novel two-step process to model Hb levels and then predict the associated anaemia prevalence in different areas of Kenya. Our approach adds considerable value over and above what could be achieved by modelling anaemia directly, and the adopted geostatistical Bayesian framework allows for propagation of uncertainty associated at each step (including the generation of predicted ecological covariates) into the final confidence limits. Future expansion of this model could look at interpolating existing results to make predictions in non-surveyed areas, although this would require generation of values for all included individual-level covariates for each prediction location, increasing the prediction uncertainty. Our results highlight the marked geographical heterogeneity in the burden of anaemia attributable to identified risk factors in Kenya, which has major implications for effective targeting of packages of school-based interventions. We suggest that deworming can help tackle anaemia both in western and coastal Kenya, whereas malaria control is likely to have the greatest impact in western Kenya, while school-feeding programmes can help reduce anaemia in the Coast, Eastern and Rift Valley provinces. The priority now should be to explored in detail the health and educational impact of carefully designed integrated infection and nutritional interventions in this age group.
Supplementary Material
Acknowledgments
We are very grateful to all the teachers, parents and especially children who participated in this survey and to the many facilitators and members of the survey teams who collected the data and to Don Bundy for comments. The survey work was supported by the Wellcome Trust UK as part of the fellowship support to SJB (#81673) and by the Division of Malaria Control, Ministry of Public Health and Sanitation through a grant from the Department for International Development (DfID) through the WHO Kenya Country Office to Dr AM Noor and Dr E Juma.
Footnotes
Contributors: RLP was responsible for designing and conducting analysis, interpretation, drafting and production of the final manuscript. CG contributed to the survey design, data assembly and cleaning and contributed to the final manuscript. CM and RWS contributed to the survey design, interpretation of results and contributed to the final manuscript. SJB designed the field surveys, provided scientific guidance and contributed to the interpretation and preparation of the final manuscript. All authors read and approved the final manuscript.
Funding: The fieldwork was supported by the Wellcome Trust UK and by the Division of Malaria Control, Ministry of Public Health and Sanitation. RLP acknowledges support of the Bill & Melinda Gates Foundation, and CWG is supported by a Commonwealth Scholarship from the DfID. SJB is supported by a Wellcome Trust Senior Fellowship in Basic Biomedical Science (098045), and RWS is supported by a Wellcome Trust Principal Fellowship (079080).
Competing interests: None.
Ethics approval: Kenya Medical Research Institute and National Ethics Review Committee (numbers 1407 and 1596). Additional approval was provided by the Permanent Secretary's Office of the Ministry of Education (MoE) and the Division of Malaria Control, Ministry of Public Health and Sanitation.
Provenance and peer review: Not commissioned; externally peer reviewed.
Data sharing statement: The school survey dataset used for this analysis is available for download through the Global Atlas of Helminth Infection (http://www.thiswormyworld.org). The WinBUGs statistical code is available from the corresponding author at rachel.pullan@lshtm.ac.uk.
References
- 1.United Nations Department of Economic and Social Affairs. World population prospects, 2010 revision. http://esa.Un.Org/unpd/wpp/ (accessed June 2012).
- 2.Global Partnership for Education. All children learning: Report 2011. Global Partnership for Education. http://allchildrenlearningreport.globalpartnership.org (accessed June 2012).
- 3.World Bank Fresh: Focusing resources on education and school health. A fresh start to improving the quality and equity of education. Washington: UNESCO, UNICEF, WHO & World Bank, 2000 [Google Scholar]
- 4.McLean E, Cogswell M, Egli I, et al. Worldwide prevalence of anaemia, WHO vitamin and mineral nutritional information system, 1993–2005. Public Health Nutr 2008;12:444–54 [DOI] [PubMed] [Google Scholar]
- 5.Best C, Neufingerl N, Avan Geel L, et al. The nutritional status of school-aged children: why should we care? Food Nutr Bull 2010;31:400–17 [DOI] [PubMed] [Google Scholar]
- 6.Grantham-McGregor S, Ani C. A review of studies on the effect of iron deficiency on cognitive development in children. J Nutr 2001;131(2Suppl 2):649S–66S [DOI] [PubMed] [Google Scholar]
- 7.Fretham SJ, Carlson ES, Georgieff MK. The role of iron in learning and memory. Adv Nutr 2011;2:112–21 [DOI] [PMC free article] [PubMed] [Google Scholar]
- 8.Scholl TO. Iron status during pregnancy: setting the stage for mother and infant. Am J Clin Nutr 2005;81:1218S–22S [DOI] [PubMed] [Google Scholar]
- 9.Dharmalingam A, Navaneetham K, Krishnakumar CS. Nutritional status of mothers and low birth weight in India. Matern Child Health J 2010;14:290–8 [DOI] [PubMed] [Google Scholar]
- 10.Clarke SE, Jukes M, Njagi JK, et al. Effect of intermittent preventive treatment of malaria on health and education in schoolchildren: a cluster-randomised, double-blind, placebo-controlled trial. Lancet 2008;372:127–38 [DOI] [PMC free article] [PubMed] [Google Scholar]
- 11.Leenstra T, Phillips-Howard PA, Kariuki SK, et al. Permethrin-treated bed nets in the prevention of malaria and anemia in adolescent schoolgirls in western Kenya. Am J Trop Med Hyg 2003;68:S86–S93 [PubMed] [Google Scholar]
- 12.Smith JL, Brooker S. The impact of hookworm infection and deworming on anaemia in non-pregnant populations: a quantitative update. Trop Med Int Health 2010;15:776–95 [DOI] [PMC free article] [PubMed] [Google Scholar]
- 13.Leenstra T, Kariuki SK, Kurtis JD, et al. The effect of weekly iron and vitamin a supplementation on hemoglobin levels and iron status in adolescent schoolgirls in western Kenya. Eur J Clin Nutr 2009;63:173–82 [DOI] [PubMed] [Google Scholar]
- 14.Gera T, Sachdev HP, Nestel P. Effects of iron supplementation on physical performance in chidlren and adolescents: systematic review of randomized controlled trials. Indian Pediatr 2007;44:15–24 [PubMed] [Google Scholar]
- 15.Bundy DAP, Burbano C, Grosh M, et al. Rethinking school feeding: social safety nets, child development and the education sector. New York: The World Bank, 2009 [Google Scholar]
- 16.Bundy DAP. Rethinking school health: a key component of education for all. Washington: The World Bank, 2012 [Google Scholar]
- 17.Soares Magalhães RJ, Clements ACA. Mapping the risk of anaemia in preschool-age children: the contribution of malnutrition, malaria, and helminth infections in West Africa. PLoS Med 2011;8:e1000438. [DOI] [PMC free article] [PubMed] [Google Scholar]
- 18.Gitonga C, Karanja P, Kihara J, et al. Implementing school malaria surveys in Kenya: towards a national surveillance system. Malar J 2010;9:306. [DOI] [PMC free article] [PubMed] [Google Scholar]
- 19.Gitonga CW, Edwards T, Karanja PN, et al. Plasmodium infection, anaemia and mosquito net use among school children across different settings in Kenya. Trop Med Int Health 2012;17:858–70 [DOI] [PMC free article] [PubMed] [Google Scholar]
- 20.Brooker S, Pullan RL, Gitonga CW, et al. Plasmodium–helminth coinfection and its sources of heterogeneity across east Africa. J Infect Dis 2012;205:841–52 [DOI] [PMC free article] [PubMed] [Google Scholar]
- 21.Balk DL, Deichmann U, Yetman G, et al. Determining global population distribution: methods, applications and data. Adv Parasitol 2006;62:119–56 [DOI] [PMC free article] [PubMed] [Google Scholar]
- 22.Balk D, Pozzi F, Yetman G, et al. The distribution of people and the dimension of place: methodologies to improve the global estimation of urban extents. Urban Remote Sensing Conference; 2004. http://www.iussp.org/Activities/wgc-urb/balk.pdf [Google Scholar]
- 23.Kenya National Bureau of Statistics, Measure DHS Kenya: Dsh, 2008-09-final report. Calverton, MD: Measure DHS, ICF Macro, 2010 [Google Scholar]
- 24.Measure DHS. Kenya 2008-09 DHS data. http://www.measuredhs.com (accessed June 2012)
- 25.Diggle P, Moyeed R, Tawn J. Model-based geostatistics (with discussion). Appl Statistics 1998;47:299–350 [Google Scholar]
- 26.FEWSNET Famine early warning system network (FEWSNET) livelihood zone map for Kenya. FEWSNET and USAID, 2011 [Google Scholar]
- 27.Grillo J, Holt J. Application of the livelihood zone maps and profiles for food security analysis and early warning. USAID FEWSNET, 2009 [Google Scholar]
- 28.FEWSNET Famine early warning system network (FEWSNET) Kenya archive: food security update. FEWSNET and USAID, 2011. (accessed June 2012). [Google Scholar]
- 29.WHO Iron deficiency anaemia: Assessment, prevention and control. A guide for programme managers. Geneva: World Health Organisation, 2001 [Google Scholar]
- 30.Filmer D, Pritchett LH. Estimating wealth effects without expenditure data—or tears: an application to educational enrollments in states of India. Demography 2001;38:115–32 [DOI] [PubMed] [Google Scholar]
- 31.Williams RL. A note on robust variance estimation for cluster-correlated data. Biometrics 2000;56:645–6 [DOI] [PubMed] [Google Scholar]
- 32.Rockhill B, Newman B, Weinberg C. Use and misuse of population attributable fractions. Am J Public Health 1998;88:15–19 [DOI] [PMC free article] [PubMed] [Google Scholar]
- 33.Brooker S, Akhwale WS, Pullan R, et al. Epidemiology of Plasmodium-helminth coinfeciton in Africa: potential impact on anaemia and prospects for combining control. Am J Trop Med Hyg 2007;77:88–98 [PMC free article] [PubMed] [Google Scholar]
- 34.Pullan R, Brooker S. The health impact of polyparasitism in humans: are we under-estimating the burden of parasitic diseases? Parasitology 2008;135:783–94 [DOI] [PMC free article] [PubMed] [Google Scholar]
- 35.Nkuo-Akenji TK, Chi PC, Cho JF, et al. Malaria and helminth co-infection in children living in a malaria endemic setting of Mount Cameroon and predictors of anaemia. J Parasitol 2006;92:1191–5 [DOI] [PubMed] [Google Scholar]
- 36.Midzi N, Mtapuri-Zinyowera S, Mapingure MP, et al. Consequences of polyparasitism on anaemia among primary school children in Zimbabwe. Acta Trop 2010;115:103–11 [DOI] [PubMed] [Google Scholar]
- 37.Ezeamama EE, McGarvey ST, Acosta LP, et al. The synergistic effect of concomitant schistosomiasis, hookworm, and trichuris infections on children's anemia burden. PLoS Negl Trop Dis 2008;2:e245. [DOI] [PMC free article] [PubMed] [Google Scholar]
- 38.Bundy DAP, Shaeffer S, Jukes M, et al. School based health and nutrition programs. Chapter 58 In: Jamison DT, Breman JG, Measham AR, et al., editors. Disease control priorities for developing countries Washington DC: World Bank; 2006 [Google Scholar]
- 39.Brooker S, Clarke S, Snow RW, et al. Malaria in African schoolchildren: options for control. Trans R Soc Trop Med Hyg 2008;102:304–5 [DOI] [PMC free article] [PubMed] [Google Scholar]
- 40.Rowe AK, Powell KE, Flanders WD. Why population attributable fractions can sum to more than one. Am J Prevent Med 2004;26:243–9 [DOI] [PubMed] [Google Scholar]
- 41.Anumudu C, Adolami M, Igwe C, et al. Nutritional anaemia and malaria in pre-school and school-aged children. Ann Afr Med 2008;1:11–17 [DOI] [PubMed] [Google Scholar]
- 42.Daboné C, Delise HF, Receveur O. Poor nutritional status of schoolchildren in urban and peri-urban areas of Ouagadougou (Burkina Faso). Nutr J 2011;10:34. [DOI] [PMC free article] [PubMed] [Google Scholar]
- 43.Calis JC, Van Hensbroek MB, De Haan RJ, et al. HIV-associated anemia in children: a systematic review from a global perspective. AIDS 2008;22:1099–112 [DOI] [PubMed] [Google Scholar]
- 44.Levine AM, Berhane K, Masri-Lavine L, et al. Prevalence and correlates of anemia in a large cohort of HIV-infected women: women's interagency HIV study. J Acquir Immune Defic Syndr 2001;26:28–35 [DOI] [PubMed] [Google Scholar]
- 45.Tolentino K, Friedman JF. An update on anaemia in less developed countries. Am J Trop Med Hyg 2007;77:44–51 [PubMed] [Google Scholar]
- 46.Leenstra T, Kakiuki SK, Kurtis JD, et al. Prevalence and severity of anaemia and iron deficiency: cross-sectional studies in adolescent schoolgirls in western Kenya. Eur J Clin Nutr 2004;58:681–91 [DOI] [PubMed] [Google Scholar]
- 47.Booth M, Vounatsou P, N'Goran E K, et al. The influence of sampling effort and the performance of the kato-katz technique in diagnosing Schistosoma mansoni and hookworm co-infections in rural Cote d'Ivoire. Parasitology 2003;127(Pt 6):525–31 [DOI] [PubMed] [Google Scholar]
- 48.Okell LC, Ghani AC, Lyons E, et al. Submicroscopic infection in Plasmodium falciparum endemic populations: a systematic review and meta-analysis. J Infect Dis 2009;15:1509–17 [DOI] [PubMed] [Google Scholar]
- 49.World Bank World development report 2007: development and the next generation. Washington: The World Bank, 2007 [Google Scholar]
- 50.Education and Policy Data Center. Kenya 2005 District Primary Education Profiles. http://www.epdc.org/country/kenya.
- 51.Little AW, Green A. Successful globilisation, education and sustainable development. Int J Educ Dev 2009;29:166–74 [Google Scholar]
- 52.Sawyer SM, Afifi RA, Bearinger LH, et al. Adolescence: a foundation for future health. Lancet 2012;379:1630–40 [DOI] [PubMed] [Google Scholar]
- 53.Kleinbaum DG, Kupper LL, Morgenstern H. Epidemiological research. Belmont, CA: Lifetime Learning Publications, 1982:163 [Google Scholar]
Associated Data
This section collects any data citations, data availability statements, or supplementary materials included in this article.