Abstract
A microneedle patch coated with vaccine simplifies vaccination by using a patch-based delivery method and targets vaccination to the skin for superior immunogenicity compared to intramuscular injection. Previous studies of microneedles have demonstrated effective vaccination using freshly prepared microneedles, but the issue of long-term vaccine stability has received only limited attention. Here, we studied the long-term stability of microneedles coated with whole inactivated influenza vaccine guided by the hypothesis that crystallization and phase separation of the microneedle coating matrix damages influenza vaccine coated onto microneedles. In vitro showed that the vaccine lost stability as measured by hemagglutination activity in proportion to the degree of coating matrix crystallization and phase separation. Transmission electron microscopy similarly showed damaged morphology of the inactivated virus vaccine associated with crystallization. In vivo assessment of immune response and protective efficacy in mice further showed reduced vaccine immunogenicity after influenza vaccination using microneedles with crystallized or phase-separated coatings. This work shows that crystallization and phase separation of the dried coating matrix are important factors affecting long-term stability of influenza vaccine-coated microneedles.
Keywords: Coating formulation, Crystallization, Influenza vaccine, Microneedle patch, Phase separation, Vaccine stability
1. Introduction
Vaccination provides the most economic means to prevent influenza infection [1]. Currently, the dominant method of vaccine delivery has been through intramuscular (IM) injection of a liquid vaccine formulation via hypodermic needles. However, recent studies have reported that intradermal influenza vaccination has a dose-sparing effect and increased immunogenicity in the elderly compared to IM vaccination [2,3]. This effect has been explained by the abundance of antigen-presenting cells in the skin, such as the epidermal Langerhans cells and dermal dendritic cells, which induce a greater level of immunogenicity. Unfortunately, intradermal injection requires special training and it is difficult to consistently control the depth of the injection [4,5]. As a result, much work has been done to replace conventional needles with new vaccine delivery devices that specifically target the skin [6].
Microneedle patches have received increasing attention as a delivery system that enables simple and reliable vaccination in the skin using a low-cost technology that may even permit self-administration of vaccines by patients themselves [7]. Using this approach, arrays of solid, metal microneedles measuring hundreds of microns in length have been coated with vaccine formulations. Upon insertion into the skin, the vaccine dissolves off the microneedles into the skin within minutes, after which the microneedle patch can be removed and discarded.
Animal studies have shown that vaccination in this way with influenza as well as other vaccines is immunogenic and often provides dose-sparing, stronger immune responses and improved protective efficacy against live virus challenge compared to IM vaccination [8–13]. These studies have primarily been carried out using freshly prepared microneedles, such that the issue of long-term stability of the vaccine coated onto microneedles has received only limited attention [14,15]. Similar microneedle patches have also been used for delivery of human parathyroid hormone in human clinical trials [16], for which long-term stability was demonstrated [17].
Microneedle coating formulations are typically composed of surfactants to facilitate wetting of the microneedle surface during the coating process, viscosity enhancers to increase coating thickness, and sugars to stabilize biomolecules during drying [17–22]. The addition of non-reducing disaccharides such as trehalose has been shown to be important to maintaining influenza vaccine immunogenicity during the coating process [21,23]. Trehalose’s stabilizing effect on microneedle vaccines can be accounted for by two well-known hypotheses: the water-replacement hypothesis and the vitrification hypothesis [24]. In short, disaccharides lower the phase transition temperature (Tm) of the lipid membrane and preserve protein structures upon drying. Also, conformational fluctuations of biomolecules are reduced when embedded in amorphous sugar matrices. As a result, the physicochemical state of the sugar-based dry coating is expected to play a crucial role in stabilizing microneedle coating formulations for influenza and other vaccines. Sugar-based vaccine powder formulations [25,26] and vaccine-embedded sugar films on membranes [27] have similarly been developed for non-microneedle systems.
The importance of phase behavior in solid-state pharmaceuticals is well known [28,29]. For example, pharmaceuticals in an amorphous form have been shown to have a higher dissolution rate and bioavailability than those in a crystallized state [30,31]. The amorphous state, however, is often unstable, leading to crystallization [32–34]. Thus, it is often important to design pharmaceutical formulations to prevent crystallization when the amorphous state is preferred.
This study seeks to examine the long-term stability of influenza vaccine coated onto microneedles as assessed by in vitro hemagglutination (HA) activity and in vivo immunogenicity, as well as determine the associated mechanisms of vaccine destabilization. We are guided by the hypothesis that crystallization and phase separation of the microneedle coating matrix damages influenza vaccine coated onto microneedles.
2. Materials and methods
2.1. Preparation of virus
A/PR/8/1934 (H1N1, abbreviated as PR8) influenza virus was grown in hen’s eggs for 2.5 days at 37 °C, as described previously [35]. Briefly, the allantoic fluid was harvested and cell debris was removed using low-speed centrifugation. Influenza virus was purified through sucrose density gradient centrifugation. Formalin was used to inactivate the purified virus at a final concentration of 1:4000 (v/v). Plaque assays for the virus were carried out on Madin–Darby canine kidney (MDCK) cells to confirm virus inactivation. This inactivated virus vaccine was used to perform stability tests on metal plates and solid metal microneedles. Mouse-adapted PR8 influenza virus was used in the challenge experiments.
2.2. Coating formulation and vaccine coating on microneedles
Titanium (Ti) microneedle arrays composed of a row of five in-plane microneedles were fabricated by lithographic masking followed by wet etching, as described previously [18]. Each microneedle measured 750 μm in length and 200 μm by 50 μm in cross section at the base, and tapered to a sharp tip. The coating formulation used in all experiments was composed of 15% w/v trehalose-dihydrate (Sigma Aldrich, St. Louis, MO), 0.25% w/v carboxymethylcellulose sodium salt (low viscosity, Sigma Aldrich; abbreviated as CMC), 0.5% w/v Lutrol® micro 68 (BASF, Mt. Olive, NJ), and 1.5 mg/mL PR8 inactivated virus in sterile Dulbecco’s phosphate buffered saline (DPBS, Mediatech, Manassas, VA).
Microneedle patches were cleaned using acetone, methanol and isopropanol (Sigma Aldrich), followed by plasma cleaning (PDC-32G, Harrick Plasma, Ithaca, NY) for 1 min at the maximum radio frequency level. Microneedles were coated using an automated dip-coating device [18], and air-dried at ambient conditions (22–24 °C, 25–45% relative humidity). In some experiments, coatings were applied to Ti sheets, which were the same sheets used to make microneedles. In this way, the Ti sheets provided the same surface for coating, but did not provide the microneedle geometry. Coating formulations were pipetted onto the Ti sheets.
Vaccine concentration was determined by measuring the absorbance of vaccine samples using a bicinchoninic acid (BCA) assay kit (ThermoFisher Scientific, Waltham, MA) at 560 nm on a microplate reader (iMark, Bio-Rad Laboratories, Hercules, CA.) Protein concentrations were calculated with reference to bovine serum albumin (BSA) standards. In the case of vaccine-coated microneedles, the concentration of coating excipients was controlled to be the same in resuspended microneedle samples as in BSA standard samples to avoid any interference from the coating materials with the dose estimation using the BCA assay.
2.3. In vitro vaccine stability tests
To identify vaccine destabilizing factors in coated microneedles, time-dependant influenza vaccine stability tests were performed on Ti microneedles and on Ti sheets coated with inactivated PR8 virus (1 μg per sample) and stored at ambient conditions in unsealed containers.
Morphological changes were monitored over the course of up to eight months using an optical microscope (SZX12, Olympus America, Center Valley, PA) with a CCD camera (RT Slider, Diagnostic Instruments, Sterling Heights, MI). The remaining activity of the coated vaccine was assessed by measuring hemagglutination (HA) activity, as described previously [36]. Briefly, to measure HA titers, dried vaccine-coated samples were resuspended in 200 μL of DPBS overnight at 4 °C. A serial dilution of the resuspended virus was then mixed with a 0.7% suspension of chicken red blood cells (Lampire Biological Laboratories, Pipersville, PA) to read end-point titers.
2.4. X-ray diffractometry
X-ray diffraction (X’pert Pro Multi Purpose Diffractometer, PANalytical, West-borough, MA) (XRD) analysis was used to study structural changes of coated vaccine over time. The measurements were made in the θ–2θ mode using a bracket sample holder with a Cu Kα radiation (Cu Kα1 = 1.54059 Å, Cu Kα2 = 1.54442 Å) at room temperature. Data were collected between 8° and 40° 2θ using a step size of 0.0084° and an acquisition time of 5 s per step. Samples were measured at 45 kV and 40 mA. X-ray powder diffraction patterns were analyzed using Jade 8 software (MDI Materials Data, Livermore, CA) and shown after background correction. Diffraction peaks were fitted to a Gaussian profile.
2.5. Electron microscopy
Transmission electron microscopy (TEM; Hitachi-2000 FX, Hitachi High Technologies America, Schaumburg, IL) was used to observe the morphology of the coated vaccine over time. In preparation, the vaccine suspension was placed on a 3 mm formvar-amorphous carbon-coated copper grid (Ted Pella, Redding, CA) and allowed to settle for 3 min. Excess solution was removed by blotting with filter paper. Samples were then immediately stained with 1.5% phosphotungstic acid (pH = 7.0, Electron Microscopy Sciences, Hatfield, PA) for approximately 30 s. Excess staining solution was removed with filter paper and the specimens were dried in a desiccator at room temperature before TEM observation. The TEM was operated at 100 kV.
A scanning electron microscope (SEM; LEO 1530, Carl Zeiss NTS, Peabody, MA) operating at acceleration voltage of 15 kV was used to observe the surface morphology of the dried vaccine coating film on the Ti sheet. A thin gold film was deposited on the sample surface to reduce charging effects.
2.6. Thermal analysis
Differential scanning calorimetry (DSC, Q200, TA instruments, New Castle, DE) was used to measure the glass transition temperature of the coatings. Employing the same procedures used to make vaccine coatings on Ti sheets, DSC samples were prepared using all excipients without vaccine. After air-drying for 24 h, the dried coating was scraped off the Ti plate and finely ground. Experiments were run at a scan rate of 10 °C/min using dry nitrogen as the purge gas. A 9.3 mg sample was tested using aluminum pans (TA instruments) with temperature ranging from −90 °C to 80 °C, and empty pans were used as a reference control. The onset temperature of the discontinuities in the heat flow vs. temperature curve was taken as the glass transition point.
2.7. Immunization and challenge of mice
Female inbred BALB/c mice (Harlan Laboratories, Indianapolis, IN) 6–8 weeks of age were immunized once with influenza vaccine-coated microneedles. Groups of mice (12 mice per group) were immunized using microneedles coated with 0.1 μg of inactivated PR8 influenza virus vaccine delivered to the skin. Mice were anesthetized with ketamine (110 mg/kg, Abbott Laboratories, Abbott Park, IL)-xylaxine (11 mg/kg, Phoenix Scientific, St. Joseph, MO) and hair was removed by Nair® depilatory cream (Church and Dwight Company, Princeton, NJ). The skin was dried using cotton balls and microneedles were manually inserted into the skin and left in place for 10 min.
There were four groups of mice: (1) placebo microneedles coated with vaccine-free formulation (negative control), (2) microneedles coated and dried one day before vaccination (positive control), (3) microneedles coated with PR8 vaccine in a matrix that was crystallized (as determined by microscopic examination) after 4 months storage and (4) microneedles coated with PR8 vaccine in a matrix that was phase-separated with large bumps (as determined by microscopic examination, see below) after 4 months storage.
To study post-challenge survival rates and immune responses, mice were challenged 10 weeks after immunization with a lethal dose of mouse-adapted PR8 virus (10 × LD50). Body weight changes of the mice were then monitored on daily basis. Mice with body weight loss greater than 25% were euthanized following Emory University Institutional Animal Care and Use Committee (IACUC) guidelines. All animal studies were carried out with approval of the IACUCs at Emory University and Georgia Institute of Technology.
2.8. Antibody responses and hemagglutination inhibition (HAI) titers
Serum samples were collected on the 2nd, 4th, and 6th weeks following immunization. Influenza virus-specific IgG antibody titers were measured by enzyme-linked immunosorbent assay (ELISA) plates coated with inactivated PR8 virus and by goat anti-mouse IgG-specific secondary antibodies (Horseradish Peroxidase Conjugate, Southern Biotech, Birmingham, AL) [37]. End-point titers were plotted as a function of time by measuring optical densities at 450 nm.
Hemagglutination inhibition (HAI) titers were determined as described previously [36]. Briefly, sera were collected from mice in the 6th week following immunization and were incubated overnight at 37 °C with receptor-destroying enzyme (RDE, Denka Seiken, Tokyo, Japan). Two-fold serially diluted sera were mixed with 4 HA units of PR8 influenza virus and HAI titers were determined by adding chicken red blood cells. HAI titers were recorded by reading the highest serum dilution that prevented hemagglutination.
2.9. Lung viral titer and lung inflammatory cytokine assays after challenge
Lung virus titers of the mice were measured in four mice from each group on day 4 after challenge. Titers were determined by counting the number of plaques formed on MDCK cells, as described previously [37]. Inflammatory cytokines (IL-6) were analyzed by Ready-Set-Go cytokine kits (eBioscience, San Diego, CA) following the manufacturer’s protocol.
2.10. Assays of T cell response and antibody secreting cells (ASC) after challenge
To determine T cell responses by ELISPOT assay, spleen samples were collected from four mice per group euthanized four days after challenge. Harvested spleen cells (106 cells per well) were stimulated with PR8 hemagglutinins-specific peptides, a mixture of two major histocompatibility complex class I (MHC-I) peptides (IYST-VASSL and LYEKVKSQL), and a pool of five MHC-II peptides (SFERFEIFPKE, HNTNGVTAACSH, CPKYVRSAKLRM, KLKNSYVNKKGK, and NAYVSVVTSNYNRRF) [37]. Interleukin-4 (IL-4) and interferon-γ (IFN-γ) were assayed using ELISPOT reagents (BD PharMingen, San Jose, CA). To assay antibody secreting cells (ASC), bone marrow and spleen cells were added to 96-well culture plates (Millipore, Billerica, MA) coated with inactivated PR8 virus in RPMI medium for 2 days. Secreted antibody levels were determined after 6 days culture and their optical densities were compared.
2.11. Statistics
All parameters were recorded for individuals within all groups. When multiple conditions were compared, one-way or two-way analysis of variance (ANOVA, α = 0.05) was performed. In some cases, median values were compared to validate the results. A P value of less than 0.05 was considered to be significant.
3. Results
Previous studies reported that influenza vaccine coated onto microneedles can lose HA activity during storage [14], and our data presented below confirm this finding. In this study, we sought to identify factors associated with vaccine destabilization, paying special attention to changes in coating matrix phase behavior. Indeed, microscopic examination revealed that two characteristic morphological changes were observed increasingly over time (Supplementary Fig. S1). One was a change in light scattering across part or all of the coating sample that either increased or decreased sample brightness, depending on the angle of illumination. As discussed below, we interpret this change as crystallization of trehalose in the coating formulation. The second one was the appearance of much smaller patches of micron-scale domains that appeared as small bumps in the coating surface, which we interpret as localized phase separation that does not involve crystallization. These two morphological changes and their association with loss of vaccine antigenicity and immunogenicity, are examined below.
3.1. Crystallization of influenza vaccine
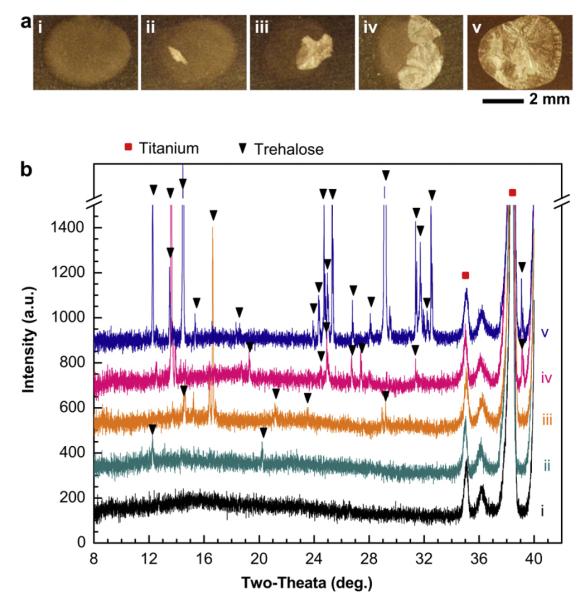
Influenza vaccine coating formulation was dried onto Ti sheets as spots measuring ~4 mm in diameter to simulate the microneedle coating process using a high-throughput method that did not require making microneedles from the Ti sheets or coating with the microneedle coating apparatus. Fig. 1a shows representative brightfield optical micrographs of samples 15 days after coating and storage at ambient conditions. Fig. 1a(i) shows no change in appearance relative to a freshly-coated sample (data not shown). The approximately circular region that dominates the image is the vaccine coating droplet that has dried onto the dark-colored Ti surface. In contrast, the other samples in Fig. 1a exhibit the formation of new phases with bright contrast to increasing degrees from Fig. 1a(ii) to Fig. 1a(v). We consistently observed the formation of these new phases and consistently observed a high degree of heterogeneity among samples, as discussed further below.
Fig. 1.
Crystallization of influenza vaccine coatings on Ti sheets. (a) Representative, brightfield optical microscopy images of coatings after storage at ambient conditions (20–23 °C, 20–45% relative humidity) for 15 days. Although all samples were stored for the same amount of time under the same conditions, different degrees of crystallization occurred, as shown by the crystallized portions of the coatings that appear white under these imaging conditions. (b) X-ray diffraction (XRD) patterns corresponding to samples i–v in part (a). Scan range was, 2θ = 8°–40°. Peak shifts were corrected using Ti (P63/mmc; a = b = 2.950 Å, c = 4.686 Å; α = β = 90°, γ = 120°) as a standard reference material [39]. Structural analysis was performed by comparing observed characteristic XRD peaks with simulation results based on cell information of trehalose-dihydrate and trehalose anhydrous forms [40,41]. XRD patterns were comparable to characteristic peaks for trehalose-dihydrate crystals.
To better understand the nature of the observed morphological changes, we performed structural analysis using X-ray diffraction (XRD) on the samples shown in Fig. 1a. These data are shown in Fig. 1b. All five of the spectra exhibit sharp peaks at 2θ = 35.2° and 38.5°. These peaks are characteristic of Ti (100) and (002) reflections, respectively, and are expected signals from the underlying Ti sheet.
Spectrum (i) of Fig. 1b shows the diffraction pattern from a coating without apparent morphological changes (i.e., Fig. 1a(i)). The broad peak observed at 2θ = ~10–30° indicates that the coating matrix is in an amorphous phase [38]. As the degree of morphological change observed in Fig. 1a increases, the size of this broad peak decreases, as shown in spectra (ii) through (v) in Fig. 1b and in greater detail in Supplementary Fig. S2. This indicates that the change in coating morphology is associated with a loss of the amorphous phase.
While spectrum (i) does not have other peaks, the other spectra in Fig. 1b have additional peaks that increase in number and intensity with increasing visual morphological changes. In spectrum (ii), there are small peaks observed at 2θ = 12.4° and 20.3°, which correspond to the characteristic (210)= and (311) peaks, respectively, of trehalose-dihydrate crystals (P212121; a = 17.9 Å, b = 12.21 Å, c = 7.586 Å; α = β = γ = 90°) [40]. It should be noted that there could be a mixture of the dihydrate and anhydrous trehalose forms due to the similarity of their peak positions.
In spectra (iii) through (v), additional peaks associated with trehalose appear as well [40]. The range of intensities of the crystalline reflections at different angular positions indicates that the degree of crystallization is heterogeneous and the preferred orientation of the trehalose crystallites is not reproducible. Regardless of this variability, we conclude that the coating formulation crystallizes and that trehalose-dihydrate probably comprises the major crystalline phase of the coatings (given that the coating composition is approximately 95% trehalose). For the purposes of this study, the detailed structural identification of the trehalose crystal form is not important. Therefore, if not specified, all trehalose crystalline phases have been designated as simply trehalose in this article.
Finally, comparison of Fig. 1a and b indicates that the non-reflective regions seen in the microscopy images represent amorphous phases and the bright reflective regions represent trehalose crystals.
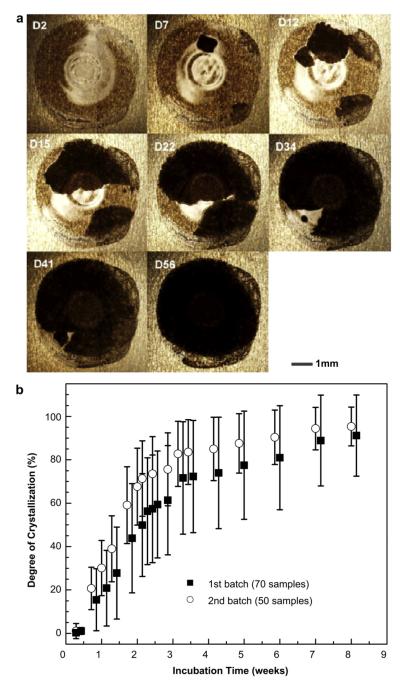
Data on crystallization of coatings were collected over a time-course of 10 weeks. Fig. 2 shows these data collected from two separate batches (batch 1: n = 70 replicate samples, batch 2: n = 50) prepared at different times but both stored at the same ambient conditions. Fig. 2a shows brightfield microscopy images of a representative coating sample, which exhibited increased crystallization over time during storage. Because illumination during imaging was done at a different angle compared to Fig. 1a, the crystallized regions in Fig. 2a appear black instead of white.
Fig. 2.
Time-dependence of crystallization of influenza vaccine coatings on Ti sheets over 8 weeks. (a) Representative optical microscopy images and (b) time-course of crystallization observed from two different batches (n = 70 samples for batch 1, n = 50 samples for batch 2) prepared several days apart and stored at ambient conditions. Degree of crystallization was calculated by measuring the size of the crystallized area (black areas under these imaging conditions) relative to the total sample area through image analysis using Adobe Photoshop CS3. Data are represented as the mean ± standard deviation (SD).
3.1.1. Crystallization kinetics on Ti sheet
Quantitative data from the two batches containing a total of 120 coating samples are shown in Fig. 2b. Crystallization exhibited biphasic behavior, where a rapid initial increase in degree of crystallization was followed by a much slower increase at later times. In batch 1, crystallization occurred at an average rate of 4.7%/day during the first two weeks of storage, but dropped almost 12-fold to just 0.4%/day after week 3 (linear least square fit). Similarly, in batch 2 the average initial crystallization rate was 3.1%/day during the first two weeks and decreased to 0.6%/day after week 3. Due to the high initial crystallization rate, the average degree of crystallization exceeded 50% within 2–3 weeks of storage and reached about 90% crystallization after 7 weeks under the conditions studied.
3.1.2. Effect of crystallization on vaccine stability
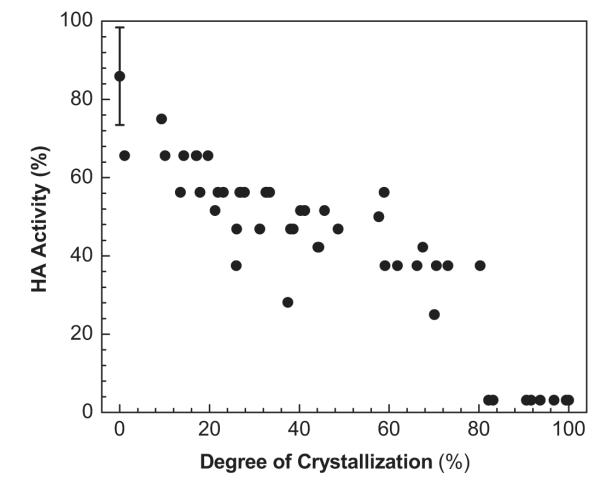
We next hypothesized that the observed crystallization of the trehalose matrix is associated with loss of influenza vaccine stability. To test this, we prepared 50 vaccine coatings, stored them for one week and then assessed each sample for degree of crystallization and hemagglutination (HA) activity as a measure of vaccine stability (Fig. 3). Although all coatings were stored in the same way, there was a broad range of crystallization and a broad range of HA activity. HA activity was calculated relative to HA titer of uncoated inactivated PR8 virus in DPBS.
Fig. 3.
The effect of the degree of crystallization of influenza vaccine coatings on Ti sheets on functional HA activity. Coating samples containing vaccine comprising 1 μg of protein were stored for 1 week at ambient conditions and collected for HA measurement after measuring crystal size.
The data point with the error bar at zero crystallization and 86% HA activity represents freshly prepared coatings before crystallization occurred. This indicates that the coating process itself caused a 14% loss of HA activity, presumably due to the loss of water surround the PR8 virus particles during drying. The remaining data points without error bars represent the 50 individual coating samples assayed one week after coating. There is a clear trend toward decreasing HA activity with increasing degree of crystallization, which suggests a mechanistic relationship between the crystallization process and loss of vaccine antigenicity. Approximately half of vaccine HA activity was lost after about 30% crystallization occurred and essentially all HA activity was lost above about 80% crystallization.
3.1.3. Morphological changes of vaccine in crystallized coatings
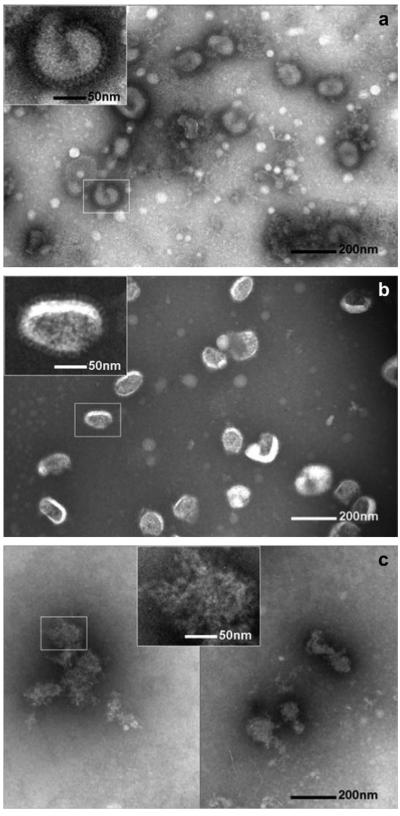
Finally, transmission electron microscopy (TEM) analysis was performed to investigate the mechanism of vaccine activity loss due to the crystallization of the coating (Fig. 4). Uncoated inactivated PR8 virus in DPBS served as a negative control and showed the characteristic spherical shape with approximately 100 nm diameter and a spike-shaped hemagglutinin glycoprotein present on the surface of the lipid envelope (Fig. 4a). PR8 virus reconstituted from an amorphous coating looked similar to the negative control (Fig. 4b), which is consistent with the expectation that vaccine integrity is not significantly damaged by coating in an amorphous matrix. In contrast, PR8 virus reconstituted from a crystallized coating lost its spherical morphology and appeared completely ruptured (Fig. 4c). Therefore, the HA activity loss associated with crystallization (Fig. 3) can be explained by mechanical perturbation of the PR8 virus particle structure during crystallization possibly involving disruption of lipid envelope membranes and antigenic protein denaturation.
Fig. 4.
Representative TEM images of inactivated influenza PR8 virus vaccine. (a) PR8 virus (a) in DPBS at 4 °C, (b) after resuspension in DPBS from an amorphous coating and (c) after resuspension in DPBS from a crystallized coating. The insets show magnified virus images. Virus particles in (a) and (b) show typical intact viral structures, whereas in the virus particles in (c) appears significantly destroyed. TEM analysis shows that crystallization induces destruction of influenza virus. Samples received negative staining of the viral surface with 1.5% phosphotungstic acid (pH = 7.0) before TEM imaging.
3.2. Phase separation of influenza vaccine
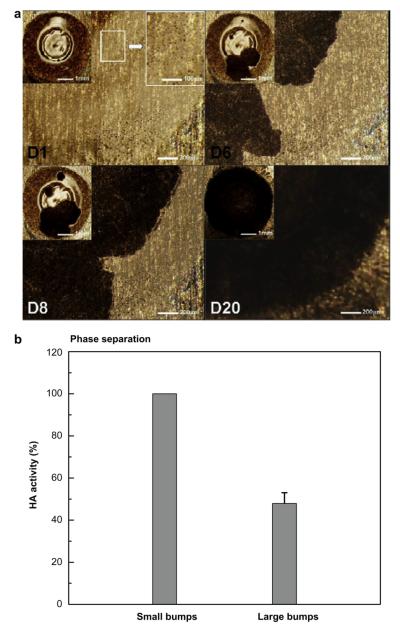
In addition to crystallization, we frequently observed another morphological change in vaccine coatings that appeared to be evidence of phase separation that did not involve crystallization. We saw micron-scale domains that appeared to be bumps formed on the coating surface, which gave a rough appearance (see Fig. 5a-D1) compared to the smooth surface of amorphous samples (see Fig. 1a(i) and 2a-D2). While these phase-separated domains had a range of sizes, any given batch of samples typically had bumps of similar size. In addition, bump size tended to increase as time went on. We categorized these domains as small bumps (<15 μm) and large bumps (>15 μm). An example of small bumps is shown in Fig. 5a and an example of large bumps is shown in Supplementary Fig. S3.
Fig. 5.
Morphological evolution of phase-separated, vaccine-embedded coating on Ti plate. (a) Representative optical micrographs showing the progress of phase separation and crystallization in samples with small bumps. Insets show magnified views. Under the imaging conditions used, crystals have dark contrast in these images. (b) Effect of bump size on functional HA activity in phase-separated coating. Phase-separated amorphous samples with 1 μg of protein were incubated for 2 weeks and collected for HA measurement (n = 6–10, mean ± SD).
Fig. 5a shows a representative morphological evolution of a phase-separated vaccine coating. These bumps are approximately circular and generally measure 5–12 μm in diameter, as determined from the magnified optical micrograph (upper right inset of Fig. 5a) and scanning electron microscopy (Supplementary Fig. S4a). XRD analysis revealed that phase-separated domains maintained their amorphous structure (Supplementary Fig. S4b). Over time, phase-separated domains remained, but a new morphology with dark contrast (Fig. 5a-D6) always eventually appeared and grew until it completely replaced the old phase (Fig. 5a-D20). The newly formed phase with a dark contrast was analyzed using XRD and found to be trehalose crystals (Supplementary Fig. S4c). While some coating samples proceeded directly from a single-phase amorphous morphology to a crystalline state (Figs. 1 and 2), other samples first formed amorphous phase-separated domains and then crystallized (Fig. 5).
3.2.1. Vaccine stability in phase-separated coatings
To determine the effect of non-crystalline phase separation on vaccine stability, we determined the HA activity of influenza vaccine collected from phase-separated amorphous coatings with small bumps (<15 μm) and with large bumps (15–40 mm). Each group was confirmed to be free of crystals via XRD analysis. As shown in Fig. 5b, vaccine HA activity in coatings with small bumps was unchanged, but amorphous phase separation leading to large bumps led to a loss of more than half of vaccine HA activity. While in this study we have not determined the driving force for phase separation or the reason why different-sized bumps are formed, these results indicate that phase separation resulting in large bumps can damage vaccine. Overall, these results support our hypothesis that phase transformations such as crystallization and phase separation of the coating matrix damage encapsulated influenza vaccine.
3.3. Phase transformation of influenza vaccine coatings on microneedles
So far, all experiments were carried out using vaccine coatings applied to Ti sheets to enable high-throughput. Because our primary interest is coatings on microneedles, we next examined the morphological changes seen on vaccine-coated microneedles. While the same vaccine formulation was applied and stored under the same conditions, coatings applied to Ti sheets contained 1 μg of vaccine and occupied an area on the order of 1 cm2 on a much larger surface, whereas coatings applied to microneedles contained 0.005–0.02 μg of vaccine per microneedle and occupied an area of approximately 3 × 10⁻³ cm2 per microneedle on a surface surrounded by edges.
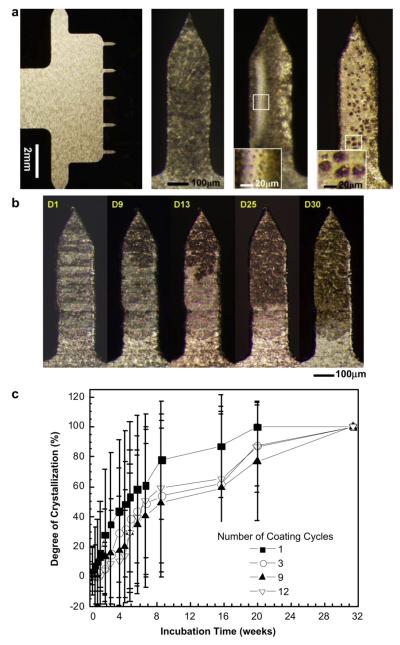
This study was carried out using microneedle arrays containing five microneedles in a single row, as shown in Fig. 6a(i). Each microneedle measured 700 μm in length and was coated using a dip-coating process that applied coatings only to the microneedles without contaminating the base structure. Dip-coating was repeated up to 12 times in order to make thicker coatings. After drying and storage, microneedles were observed by brightfield microscopy to have the same morphological changes observed on Ti sheets, including microneedle coatings with extensive crystallization (Fig. 6a(ii)), phase separation with small bumps (Fig. 6a(iii)) and phase separation with large bumps (Fig. 6a(iv)). As shown in Fig. 6b, the extent of crystallization of vaccine coatings on microneedles increased over time in a manner similar to crystallization on the Ti sheets (see Fig. 2a). It should be noted that crystallization on microneedles was initiated close to microneedle tips (Fig. 6b) and edges (Fig. S5), probably due to high surface energy.
Fig. 6.
Crystallization on vaccine-coated microneedles. (a) Representative optical micrographs showing (i) a five-needle microneedle array at low magnification and individual microneedles exhibiting (ii) crystallization, (iii) phase separation with small bumps and (iv) phase separation with large bumps. Microneedles measure 750 μm in length and 200 μm in width. The insets in images (iii) and (iv) show small bumps (<15 μm) and large bumps (>15 μm), respectively. (b) Representative optical micrographs of vaccine-coated microneedles showing the evolution of crystallization on the same microneedle as a function of storage time for one month. In this case, the nucleation and growth of crystals initiated close to the needle tip. (c) Time-course of crystallization observed on vaccine-coated microneedles. Average crystallization behavior observed after coating using four different dip-coating cycles is shown (n = 20–30 for each group, mean ± SD). The degree of crystallization was determined as described in Fig. 2.
To quantify the time-dependant crystallization progress, vaccine-coated microneedles were prepared with different coating thicknesses using four different dip-coating cycles and the degree of crystallization on these microneedles was measured for 32 weeks (Fig. 6c). As seen on the Ti sheets, coatings on microneedles also showed biphasic crystallization kinetics with a rapid increase in the degree of crystallization during the initial 8 weeks followed by a slower rate of crystallization thereafter, which ultimately lead to almost complete crystallization.
3.3.1. Crystallization kinetics on microneedles
The average crystallization rate during the first 5 weeks was measured to be 1.4, 1.0, 0.8, and 0.6%/day for microneedles coated with 1, 3, 9, and 12 dip-coating cycles, respectively. This rate is 3–5 times slower than that seen on the Ti sheet (Fig. 2b). The observed dependence on the number of dip-coating cycles indicates that thinner coatings (i.e., fewer dip-coating cycles) crystallize faster than thicker coatings. Coated microneedles were 50% crystallized within 5–9 weeks (depending on the number of dip-coatings), which is about 3 times slower than the crystallization rate on the Ti plate (Two-way ANOVA P < 0.0005). This shows that, although coatings on microneedles experience the same kinds of phase transformation as samples on Ti sheets, the different geometry of microneedles delays crystallization.
3.4. Influenza vaccination using microneedles
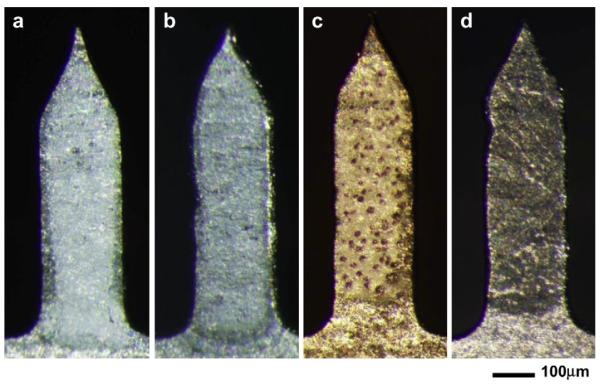
Our in vitro experiments showed that crystallization and phase separation of the vaccine coating decreased vaccine stability as measured by loss of HA activity. To validate these in vitro findings, we performed in vivo experiments using mice immunized with four different kinds of microneedles: placebo microneedles coated with vaccine-free formulation that served as a negative control (Fig. 7a), microneedles freshly-coated with PR8 vaccine that served as a positive control (Fig. 7b), microneedles coated with PR8 vaccine in a matrix that was crystallized after 4 months storage (Fig. 7c) and microneedles coated with PR8 vaccine in a matrix that was phase-separated with large bumps after 4 months storage (Fig. 7d). Because phase transformation of microneedle coatings was heterogeneous, individual microneedles were identified by microscopic inspection as crystallized or phase-separated for use in this study.
Fig. 7.
Representative images of the four types of coated microneedles used for in vivo mouse immunization studies. (a) Coating w/o vaccine: microneedles coated with coating solution lacking vaccine. (b) Freshly-coated: microneedles coated and dried one day before vaccination. (c) Phase-separated: vaccine-coated microneedles showing phase separation after 4 months of storage. (d) Crystallized: vaccine-coated microneedles showing crystallization after 4 months of storage.
3.4.1. Immunogenicity of vaccine-coated microneedles
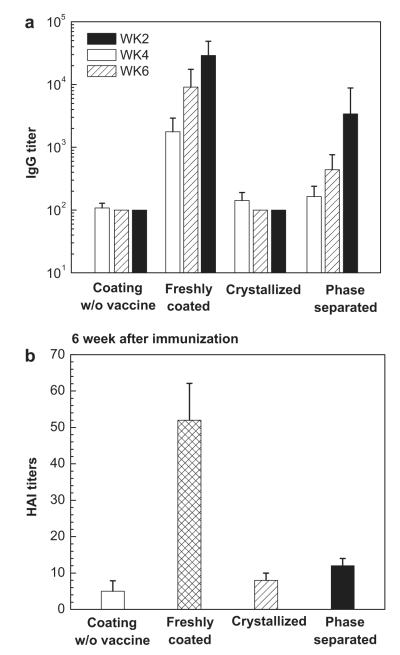
Each group of mice was vaccinated with microneedles containing coated 0.1 μg of inactivated PR8 virus. Virus-specific IgG antibody responses were measured in sera collected on the 2nd, 4th, and 6th week following immunization. As Fig. 8a shows, no significant level of antibody response was observed in the negative control group, as expected. The positive control group vaccinated with freshly-coated vaccine generated strong antibody responses, also as expected. Notably, mice vaccinated with crystallized microneedles showed no significant increases in antibody responses at any time point after vaccination (Two-way ANOVA, P < 0.0005), indicating a loss of vaccine immunogenicity associated with crystallization. Mice vaccinated with phase-separated microneedles appeared to have a delayed response with increasing antibody titers over time, but the difference between the phase-separated and negative control groups was not significantly different (two-way ANOVA, P = 0.64), indicating a loss of immunogenicity associated with phase separation with large bumps.
Fig. 8.
Antibody responses after immunization by coated microneedles. (a) Total serum anti-PR8 IgG titers determined by ELISA and (b) influenza-specific hemagglutination inhibition (HAI) titers assayed from sera of mice vaccinated by microneedles with 0.1 μg of influenza vaccine (n = 12 mice per group, mean ± SD). IgG titers were measured in sera collected on the 2nd, 4th, and 6th weeks after vaccination and HAI titers were measured from mice bled on the 6th week following vaccination. Groups of mice are described in Fig. 7.
Hemagglutination inhibition (HAI) titers correlate with protection and are therefore often a better measure of immunogenicity than virus-specific IgG titers. HAI titers were measured from sera collected on the 6th week after immunization, as shown in Fig. 8b. In agreement with the IgG titers measured in Fig. 8a, mice vaccinated with freshly-coated microneedles exhibited the highest HAI titers, which were about 3e4 times higher than the crystallized and phase-separated microneedle groups (Student’s t-test, P < 0.005), which were not significantly different from the negative control group (Student’s t-test, P > 0.05).
3.4.2. Post-vaccination protection against lethal viral challenge
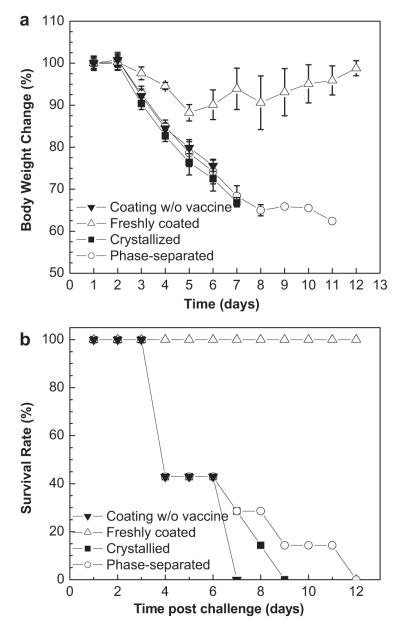
To examine protective efficacy, mice immunized with the four different kinds of microneedles were challenged with 10 × LD50 of mouse-adapted PR8 virus 10 weeks after immunization. Fig. 9 shows that mice vaccinated with freshly-coated microneedles survived challenge with only ~ 10% body weight loss. In contrast, all of mice vaccinated with negative control, crystallized and phase-separated microneedles rapidly lost body weight followed by death within 7, 9 or 12 days after challenge, respectively. This shows that crystallized and phase-separated vaccine coatings did provide protection against lethal challenge, although survival time was slightly longer than mice vaccinated with the placebo.
Fig. 9.
Protection of immunized mice against lethal virus challenge. At week 7 after vaccination, groups of mice were intranasally challenged with 10 × LD50 of mouse-adapted PR8 virus. (a) Body weight changes and (b) survival rates were monitored and recorded daily for 12 days (mean ± SD).
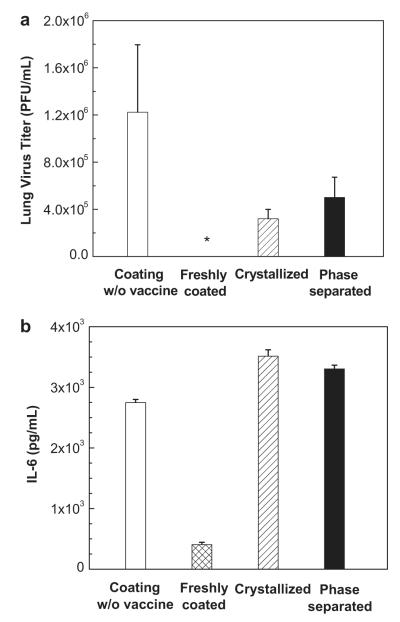
Lung viral titers were measured to assess the efficacy of vaccination to clear virus from the lung four days after challenge. As shown in Fig. 10a, the negative control group exhibited high viral titers indicating severe infection of the lung, whereas the mice vaccinated with freshly prepared microneedles had no detectable viral titers, consistent with good protective efficacy. Mice vaccinated with crystallized and phase-separated microneedles had detectable lung viral titers, which were higher than those in mice vaccinated with freshly-coated vaccine and lower than those in mice in the negative control group. This demonstrates an inferior protective efficacy of crystallized and phase-separated microneedles.
Fig. 10.
Lung viral replication and inflammatory cytokine measurements. (a) Lung viral titers as an indicator of protection by virus clearance from the lung. *: not detected. (b) Lung inflammatory cytokine (interleukine-6 (IL-6)) assay as an indicator of inflammation in the lung. Lungs from individual mice in each group (n = 4 each group) were collected on day 4 after challenge and extracted in media (mean ± SD). Lung viral titers were determined by plaque formation assay and IL-6 levels were analyzed by IL-6 cytokine ELISA.
Finally, inflammatory cytokines (IL-6) in the lung were assayed four days after challenge. As shown in Fig. 10b, mice in the freshly-coated microneedle group had the lowest levels of IL-6, indicating little inflammation in the lung. In contrast, high levels of IL-6 were detected in the lungs of mice in both the crystallized and phase-separated groups, which were similar to the high levels of inflammation seen in the negative control group.
3.4.3. Cellular and antibody secreting cell responses
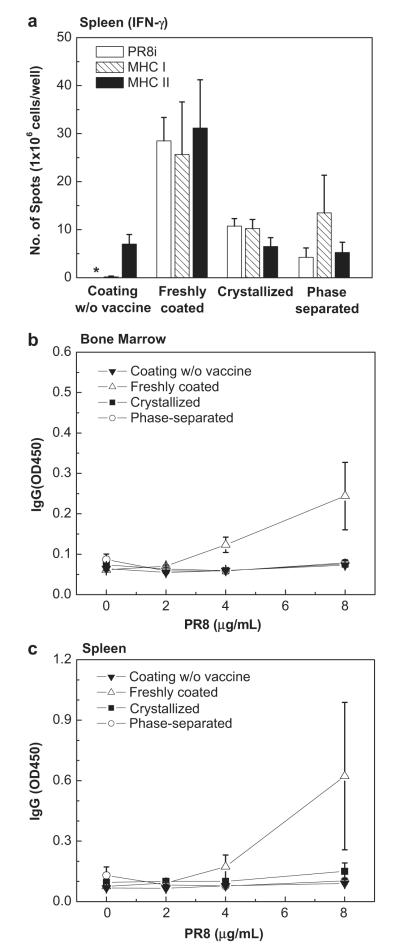
T cell responses were investigated using harvested spleen cells from challenged mice. As shown by cytokine levels reported in Fig. 11a, the freshly-coated microneedle group produced the highest levels of PR8-specific, MHC-I specific, and MHC-II specific IFN-γ secreting splenocytes, while the crystallized and phase-separated microneedle groups exhibited much lower cytokine responses (Two-way ANOVA, P = 0). Antibody secreting cell (ASC) responses in both the bone marrow, where long-lived plasma cells reside, and the spleen were also examined in vitro after 6 days of culture. As shown in Fig. 11b and c, the freshly-coated microneedle group produced the highest levels of antibodies specific to PR8 antigens. No significant level of antibody production was induced in the crystallized and phase-separated microneedle groups compared to the negative control group (Two-way ANOVA, P > 0.05). These results indicate that crystallized and phase-separated microneedles could not induce B cells to differentiate into APCs upon infection.
Fig. 11.
Cellular immune responses measured post-challenge. (a) IFN-γ ELISPOT. IFN-γ secreting cell spots after stimulation with inactivated PR8 virus, PR8 hemagglutinin-specific MHC-I and MHC-II peptides. *: not detected. (b–c) In vitro antibody secreting cell responses (ASC). Antibody levels secreted into culture supernatants of bone marrow (b) and spleen cells (c). Bone marrow and spleen samples were collected from individual mice (n = 4 each group) at day 4 post-challenge. Single cell suspensions were prepared and cultured on plates coated with inactivated PR8 virus as an in vitro antigenic stimulator (mean ± SD).
4. Discussion
We investigated the long-term stability of influenza vaccine-coated microneedles. Consistent with the approach taken by others as well, we used a microneedle coating formulation containing sugar to increase encapsulated biomolecule stability [15,17,21–23]. Because the sugar matrix provides structural support for the embedded influenza vaccine, we expect that its underlying morphology affects the stability and immunogenicity of the vaccine. Indeed, this study showed that changes in the physical state of the coating in the form of crystallization and phase separation strongly influenced long-term vaccine stability both in vitro and in vivo.
This study showed a strong correlation between loss of vaccine stability and structural changes to the microneedle coating. Vaccine stability was assessed by vaccine activity, as measured by HA assay; virus particle structural integrity, as measured by TEM; and vaccine immunogenicity, as measured by in vivo antibody and protection studies. Structural changes into the microneedle coating were seen as loss of the amorphous phase, as measured by structural analysis using XRD, and phase separation, as seen through microscopy.
The results showed that HA activity of the vaccine decreased with increasing trehalose crystallization and phase separation. Using TEM analysis, we found that crystallized coating contained virus particles exhibiting deformation of the spherical structure of the viral envelope and damage to the typical antigenic glycoprotein spikes. In contrast, no significant morphological change was observed in the vaccine embedded in the amorphous trehalose matrix. We therefore believe that the loss of viral HA activity can be explained by denaturation of antigenic proteins and rupture of lipid envelope due to mechanical damage caused by crystals as well as vaccine separation from the trehalose crystal matrix during crystallization [33,34,42,43].
In the case of phase separation, samples with extensive phase separation in the form of large bumps lost approximately half of their functional HA activity, whereas samples with lesser phase separation in the form of small bumps had no significant activity loss. During phase separation, regions with different composition are formed, presumably some that are rich in trehalose and some that have less trehalose. Compositional changes during phase separation are associated with diffusion of matrix components, where trehalose can diffuse much more easily than virus particles. Because the influenza virus particles have an estimated molecular mass of 2 × 10⁸ Da [44], we can estimate that the diffusivity (D) of trehalose molecule (342 Da) is more than 750 times larger than that of the virus (D∝m−1/2, m: mass [45]), which does not account for steric hindrance effects of the matrix that would probably selectively slow virus diffusion even more. Therefore, the diffusion distance (d) of a trehalose molecule is more than an order of magnitude greater than that of the virus (, t: time). Given this large difference between trehalose’s ability to redistribute during phase separation and that of the virus particles, we hypothesize that virus particles are increasingly exposed to trehalose-deficient environments as phase separation increases (see Supplemental Fig. S6 for a schematic diagram representing this phase separation-induced activity loss hypothesis). Loss of up to half, but not all, of HA activity during phase separation is consistent with this heterogeneous mechanism. A previous study also reported that significant compositional changes in the sugar matrix due to phase separation induced protein inactivation [46].
While the interplay between phase separation and crystallization is not fully understood, in this study we observed single-phase, amorphous samples transitioning (i) directly to a crystalline state after a lag time of days to weeks and (ii) to an amorphous, phase-separated state, after a lag time of days to weeks, that later transitioned to a crystalline state, after remaining in the phase-separated state for days to weeks before crystallization (see Supplemental Fig. S7 for a schematic diagram summarizing these observations).
The morphological changes seen in vaccine coatings on Ti sheets were also observed on coated microneedles, which validate our use of Ti sheets as a high-throughput assay for microneedle coatings. Interestingly, vaccine coatings on microneedles showed greater stability than those on the Ti sheets. On microneedles, crystallization initiated near the tips and edges of the microneedles, which can be explained by a decreased nucleation energy barrier due to the surface free energy increase. This indicates that the surface energy of microneedles should be considered an important design parameter when stabilizing microneedle coatings.
To better understand the crystallization process, the isothermal crystallization kinetics of the vaccine coatings were analyzed using the classical Avrami equation:
| (1) |
where XT is defined as the fraction of the coating that has crystallized, K is the crystallization rate constant, and n is the Avrami index, which characterizes the mode of crystal nucleation and growth [47,48]. XT was determined by using the crystallization data plotted in Fig. 2b (2nd batch) and 6c (3 coating cycles).
Following common practice, K and n were determined by linear regression of the linear portion of a double logarithmic plot using the equation:
| (2) |
As shown in Supplementary Fig. S8, the Avrami index for coatings on the Ti sheet progressively decreased as incubation time increased, initially having a value of n = 3.8, then n = 1.8 and finally n = 0.8. In the case of microneedles, after an initial lag phase, n dropped from 2.8 to 1 on the 25th day of incubation. The relatively high Avrami index values at early time points suggest three-dimensional spherical growth of crystals with nucleation as a rate-limiting factor. The Avrami index values close to unity at later time points suggests one- or two-dimensional growth of crystals with an athermal nucleation process, possibly constrained in their growth patterns by a large number of existing crystals. While detailed mechanistic interpretation of Avrami index values is notoriously difficult, this analysis shows that both the crystallization rate and n decrease with time, indicating a change in the mode of crystal growth on both the Ti sheet and microneedles. A significant lag time was found, however, only for crystallization in the microneedle coatings, suggesting greater stability of amorphous coatings on microneedles. Moreover, comparing the initial Avrami index value of 2.8 for coatings on microneedles with the values of 3.8 and 1.8 on the Ti sheets suggest possibly different crystallization mechanisms.
Additional experiments carried out in vivo showed that mice vaccinated using microneedles with either crystallized or phase-separated coatings induced weaker antibody responses (IgG and HAI titers) compared to the freshly prepared microneedles. Mice vaccinated with crystallized and phase-separated coatings also experienced rapid body weight loss followed by death within 12 days after challenge with 0% survival rate. On the other hand, the freshly-coated microneedle group had a 100% survival rate. The highest levels of the lung inflammation marker IL-6 were measured in mice from the crystallized and phase-separated groups. Furthermore, the low levels of PR8-specific, MHC-I specific, and MHC-II specific IFN-γ secreting splenocytes and ASC responses both in bone marrow and spleen are further indicators of low vaccine efficacy.
The above in vitro and in vivo studies emphasize the importance of maintaining physical stability of microneedle coatings to achieve long-term vaccine stability. Our data show that while there can be lag times and phase separation initially, complete crystallization was always the final result. Differential scanning calorimetry (DSC) analysis of a one-day-old coating showed that the glass transition temperature (Tg) was 5 °C (Fig. S9), which is well below room temperature at which the samples were stored. This low Tg could be an explanation for the crystallization observed in our current coating formation. It is likely that in order to develop long-term stable vaccine coatings, the matrix will need to have a Tg above the storage temperature to prevent crystallization, which may be accomplished by developing new drying procedures and/or modifying the coating formulation.
5. Conclusions
The stability of influenza vaccine coatings on microneedles has been studied over a time period of many weeks. This work showed that crystallization and phase separation of the vaccine coating damages the vaccine and can render it completely non-immunogenic, as determined through in vitro and in vivo experiments. The results suggest that inhibition of the phase changes in the vaccine coating film is needed for the development of long-term stable vaccine-coated microneedles. Although our study has been limited to influenza vaccine, this research is expected to contribute to the general development of long-term stable microneedles coated with other vaccines and biotherapeutics too.
Supplementary Material
Acknowledgments
This project was primarily carried out at the Institute of Bioengineering & Bioscience and the Center for Drug Design, Development, and Delivery at the Georgia Institute of Technology. Animal studies and associated analytic work were carried out at Emory University. This work was financially supported by NIH grants EB006369 (M.R.P.), AI0680003 (R.W.C.) AI093772 (S.M.K.) and AI087782 (S.M.K.), and a Georgia Research Alliance Program grant GRA-VAC09-A (S.M.K). The authors acknowledge Donna Bondy for her dedication to the administrative aspects of this research and James Norman for his assistance with statistical analyses. M.R.P. serves as a consultant to companies, is a founding share-holder of companies and is an inventor on patents licensed to companies developing microneedle-based products. This possible conflict of interest has been disclosed and is being managed by Georgia Tech and Emory University.
Footnotes
Appendix. Supplementary material Supplementary material associated with this article can be found, in the online version, at doi:10.1016/j.biomaterials.2012.01.054.
References
- [1].Harper SA, Fukuda K, Uyeki TM, Cox NJ, Bridges CB. Prevention and control of influenza: recommendations of the advisory committee on immunization practices (ACIP) MMWR Recomm Rep. 2004;53:1–40. [PubMed] [Google Scholar]
- [2].Kenney RT, Frech SA, Muenz LR, Villar CP, Glenn GM. Dose sparing with intradermal injection of influenza vaccine. N Engl J Med. 2004;351:2295–301. doi: 10.1056/NEJMoa043540. [DOI] [PubMed] [Google Scholar]
- [3].Arnou R, Icardi G, De Decker M, Ambrozaitis A, Kazek MP, Weber F, et al. Intradermal influenza vaccine for older adults: a randomized controlled multicenter phase III study. Vaccine. 2009;27:7304–12. doi: 10.1016/j.vaccine.2009.10.033. [DOI] [PubMed] [Google Scholar]
- [4].Howard A, Mercer P, Nataraj HC, Kang BC. Bevel-down superior to bevel-up in intradermal skin testing. Ann Allergy Asthma Immunol. 1997;78:594–6. doi: 10.1016/s1081-1206(10)63222-x. [DOI] [PubMed] [Google Scholar]
- [5].Laurent PE, Bonnet S, Alchas P, Regolini P, Mikszta JA, Pettis R, et al. Evaluation of the clinical performance of a new intradermal vaccine administration technique and associated delivery system. Vaccine. 2007;25:8833–42. doi: 10.1016/j.vaccine.2007.10.020. [DOI] [PubMed] [Google Scholar]
- [6].Kim YC, Jarrahian C, Zehrung D, Mitragotri S, Prausnitz MR. Delivery systems for intradermal vaccination. Curr Top Microbiol Immunol. 2012;351:77–112. doi: 10.1007/82_2011_123. [DOI] [PMC free article] [PubMed] [Google Scholar]
- [7].Prausnitz MR, Mikszta JA, Cormier M, Andrianov AK. Microneedle-based vaccines. Curr Top Microbiol Immunol. 2009;333:369–93. doi: 10.1007/978-3-540-92165-3_18. [DOI] [PMC free article] [PubMed] [Google Scholar]
- [8].Zhu Q, Zarnitsyn VG, Ye L, Wen Z, Gao Y, Pan L, et al. Immunization by vaccine-coated microneedle arrays protects against lethal influenza virus challenge. Proc Natl Acad Sci U S A. 2009;106:7968–73. doi: 10.1073/pnas.0812652106. [DOI] [PMC free article] [PubMed] [Google Scholar]
- [9].Corbett HJ, Fernando GJ, Chen X, Frazer IH, Kendall MA. Skin vaccination against cervical cancer associated human papillomavirus with a novel microprojection array in a mouse model. PLoS One. 2010;5:e13460. doi: 10.1371/journal.pone.0013460. [DOI] [PMC free article] [PubMed] [Google Scholar]
- [10].Fernando GJ, Chen X, Prow TW, Crichton ML, Fairmaid EJ, Roberts MS, et al. Potent immunity to low doses of influenza vaccine by probabilistic guided micro-targeted skin delivery in a mouse model. PLoS One. 2010;5:e10266. doi: 10.1371/journal.pone.0010266. [DOI] [PMC free article] [PubMed] [Google Scholar]
- [11].Kim YC, Quan FS, Yoo DG, Compans RW, Kang SM, Prausnitz MR. Enhanced memory responses to seasonal H1N1 influenza vaccination of the skin with the use of vaccine-coated microneedles. J Infect Dis. 2010;201:190–8. doi: 10.1086/649228. [DOI] [PMC free article] [PubMed] [Google Scholar]
- [12].Koutsonanos DG, del Pilar Martin M, Zarnitsyn VG, Jacob J, Prausnitz MR, Compans RW, et al. Serological memory and long-term protection to novel H1N1 influenza virus after skin vaccination. J Infect Dis. 2011;204:582–91. doi: 10.1093/infdis/jir094. [DOI] [PMC free article] [PubMed] [Google Scholar]
- [13].Hiraishi Y, Nandakumar S, Choi SO, Lee JW, Kim YC, Posey JE, et al. Bacillus calmette-guérin vaccination using a microneedle patch. Vaccine. 2011;29:2626–36. doi: 10.1016/j.vaccine.2011.01.042. [DOI] [PMC free article] [PubMed] [Google Scholar]
- [14].Kim YC, Quan FS, Compans RW, Kang SM, Prausnitz MR. Stability kinetics of influenza vaccine coated onto microneedles during drying and storage. Pharm Res. 2011;28:135–44. doi: 10.1007/s11095-010-0134-6. [DOI] [PMC free article] [PubMed] [Google Scholar]
- [15].Chen X, Fernando GJ, Crichton ML, Flaim C, Yukiko SR, Fairmaid EJ, et al. Improving the reach of vaccines to low-resource regions, with a needle-free vaccine delivery device and long-term thermostabilization. J Control Release. 2011;152:349–55. doi: 10.1016/j.jconrel.2011.02.026. [DOI] [PubMed] [Google Scholar]
- [16].Daddona PE, Matriano JA, Mandema J, Maa YF. Parathyroid hormone (1-34)-coated microneedle patch system: clinical pharmacokinetics and pharmaco-dynamics for treatment of osteoporosis. Pharm Res. 2011;28:159–65. doi: 10.1007/s11095-010-0192-9. [DOI] [PubMed] [Google Scholar]
- [17].Ameri M, Daddona PE, Maa YF. Demonstrated solid-state stability of parathyroid hormone PTH(1-34) coated on a novel transdermal microprojection delivery system. Pharm Res. 2009;26:2454–63. doi: 10.1007/s11095-009-9960-9. [DOI] [PubMed] [Google Scholar]
- [18].Gill HS, Prausnitz MR. Coated microneedles for transdermal delivery. J Control Release. 2007;117:227–37. doi: 10.1016/j.jconrel.2006.10.017. [DOI] [PMC free article] [PubMed] [Google Scholar]
- [19].Gill HS, Prausnitz MR. Coating formulations for microneedles. Pharm Res. 2007;24:1369–80. doi: 10.1007/s11095-007-9286-4. [DOI] [PubMed] [Google Scholar]
- [20].Chen X, Prow TW, Crichton ML, Jenkins DW, Roberts MS, Frazer IH, et al. Dry-coated microprojection array patches for targeted delivery of immunotherapeutics to the skin. J Control Release. 2009;139:212–20. doi: 10.1016/j.jconrel.2009.06.029. [DOI] [PubMed] [Google Scholar]
- [21].Kim YC, Quan FS, Compans RW, Kang SM, Prausnitz MR. Formulation and coating of microneedles with inactivated influenza virus to improve vaccine stability and immunogenicity. J Control Release. 2010;142:187–95. doi: 10.1016/j.jconrel.2009.10.013. [DOI] [PMC free article] [PubMed] [Google Scholar]
- [22].Ameri M, Fan SC, Maa YF. Parathyroid hormone PTH(1-34) formulation that enables uniform coating on a novel transdermal microprojection delivery system. Pharm Res. 2010;27:303–13. doi: 10.1007/s11095-009-0019-8. [DOI] [PubMed] [Google Scholar]
- [23].Quan FS, Kim YC, Yoo DG, Compans RW, Prausnitz MR, Kang SM. Stabilization of influenza vaccine enhances protection by microneedle delivery in the mouse skin. PLoS One. 2009;4:e7152. doi: 10.1371/journal.pone.0007152. [DOI] [PMC free article] [PubMed] [Google Scholar]
- [24].Crowe JH, Hoekstra FA, Crowe LM. Anhydrobiosis. Annu Rev Physiol. 1992;54:579–99. doi: 10.1146/annurev.ph.54.030192.003051. [DOI] [PubMed] [Google Scholar]
- [25].Maa YF, Ameri M, Shu C, Payne LG, Chen D. Influenza vaccine powder formulation development: spray-freeze-drying and stability evaluation. J Pharm Sci. 2004;93:1912–23. doi: 10.1002/jps.20104. [DOI] [PubMed] [Google Scholar]
- [26].Amorij JP, Meulenaar J, Hinrichs WL, Stegmann T, Huckriede A, Coenen F, et al. Rational design of an influenza subunit vaccine powder with sugar glass technology: preventing conformational changes of haemagglutinin during freezing and freeze-drying. Vaccine. 2007;25:6447–57. doi: 10.1016/j.vaccine.2007.06.054. [DOI] [PubMed] [Google Scholar]
- [27].Alcock R, Cottingham MG, Rollier CS, Furze J, De Costa SD, Hanlon M, et al. Long-term thermostabilization of live poxviral and adenoviral vaccine vectors at supraphysiological temperatures in carbohydrate glass. Sci Transl Med. 2010;2:19ra12. doi: 10.1126/scitranslmed.3000490. [DOI] [PubMed] [Google Scholar]
- [28].Hancock BC, Zografi G. Characteristics and significance of the amorphous state in pharmaceutical systems. J Pharm Sci. 1997;86:1–12. doi: 10.1021/js9601896. [DOI] [PubMed] [Google Scholar]
- [29].Craig DQ, Royall PG, Kett VL, Hopton ML. The relevance of the amorphous state to pharmaceutical dosage forms: glassy drugs and freeze dried systems. Int J Pharm. 1999;179:179–207. doi: 10.1016/s0378-5173(98)00338-x. [DOI] [PubMed] [Google Scholar]
- [30].Sato T, Okada A, Sekiguchi K, Tsuda Y. Difference in physico-pharmaceutical properties between crystalline and noncrystalline 9,3″-diacetylmidecamycin. Chem Pharm Bull. 1981;29:2675–82. [Google Scholar]
- [31].Fukuoka E, Makita M, Yamamura S. Some physicochemical properties of glassy indomethacin. Chem Pharm Bull. 1986;34:4314–21. doi: 10.1248/cpb.34.4314. [DOI] [PubMed] [Google Scholar]
- [32].Librizzi F, Vitrano E, Cordone L. Dehydration and crystallization of trehalose and sucrose glasses containing carbonmonoxy-myoglobin. Biophys J. 1999;76:2727–34. doi: 10.1016/S0006-3495(99)77425-4. [DOI] [PMC free article] [PubMed] [Google Scholar]
- [33].Mazzobre MF, Hough G, Buera MP. Phase transition and functionality of enzymes and yeasts in dehydrated matrices. Food Sci Tech Int. 2003;9:163–72. [Google Scholar]
- [34].Buera P, Schebor C, Elizalde B. Effects of carbohydrate crystallization on stability of dehydrated foods and ingredient formulations. J Food Eng. 2005;67:157–65. [Google Scholar]
- [35].Quan FS, Compans RW, Nguyen HH, Kang SM. Induction of heterosubtypic immunity to influenza virus by intranasal immunization. J Virol. 2008;82:1350–9. doi: 10.1128/JVI.01615-07. [DOI] [PMC free article] [PubMed] [Google Scholar]
- [36].Quan FS, Yoo DG, Song JM, Clements JD, Compans RW, Kang SM. Kinetics of immune responses to influenza virus-like particles and dose-dependence of protection with a single vaccination. J Virol. 2009;83:4489–97. doi: 10.1128/JVI.02035-08. [DOI] [PMC free article] [PubMed] [Google Scholar]
- [37].Quan FS, Huang C, Compans RW, Kang SM. Virus-like particle vaccine induces protective immunity against homologous and heterologous strains of influenza virus. J Virol. 2007;81:3514–24. doi: 10.1128/JVI.02052-06. [DOI] [PMC free article] [PubMed] [Google Scholar]
- [38].Cullity BD. Elements of x-ray diffraction. 2nd ed Addison-Wesley; Massachusetts: 1978. pp. 99–106. [Google Scholar]
- [39].Pawar RR, Deshpande VT. The anisotropy of the thermal expansion of α-titanium. Acta Cryst. 1968;A24:316–7. [Google Scholar]
- [40].Taga T, Senma M, Osaki K. The crystal and molecular structure of trehalose dihydrate. Acta Cryst. 1972;B28:3258–63. [Google Scholar]
- [41].Nagase H, Ogawa N, Endo T, Shiro M, Ueda H, Sakurai M. Crystal structure of an anhydrous form of trehalose: structure of water channels of trehalose polymorphism. J Phys Chem B. 2008;112:9105–11. doi: 10.1021/jp800936z. [DOI] [PubMed] [Google Scholar]
- [42].Cardona S, Schebor C, Buera MP, Karel M, Chirife J. Thermal stability of invertase in reduced-moisture amorphous matrices in relation to glassy state and trehalose crystallization. J Food Sci. 1997;62:105–12. [Google Scholar]
- [43].Santagapita PR, Buera MP. Trehalose-water-salt interactions related to the stability of β-galactosidase in supercooled media. Food Biophys. 2008;3:87–93. [Google Scholar]
- [44].Ruigrok RW, Andree PJ, Hooft van Huysduynen RA, Mellema JE. Characterization of three highly purified influenza virus strains by electron microscopy. J Gen Virol. 1984;65:799–802. doi: 10.1099/0022-1317-65-4-799. [DOI] [PubMed] [Google Scholar]
- [45].Tu KN, Mayer JW, Feldman LC. Electronic thin film science for electrical engineers and materials scientists. Macmillan Publishing Company; New York: 1992. pp. 46–74. [Google Scholar]
- [46].Sun WQ, Davidson P. Protein inactivation in amorphous sucrose and trehalose matrices: effects of phase separation and crystallization. Biochim Biophys Acta. 1998;1425:235–44. doi: 10.1016/s0304-4165(98)00076-2. [DOI] [PubMed] [Google Scholar]
- [47].Avrami M. Kinetics of phase change. I general theory. J Chem Phys. 1939;7:1103–12. [Google Scholar]
- [48].Avrami M. Kinetics of phase change. II transformation-time relations for random distribution of nuclei. J Chem Phys. 1940;8:212–24. [Google Scholar]
Associated Data
This section collects any data citations, data availability statements, or supplementary materials included in this article.


