Abstract
Background
Foot deformity associated with diabetes mellitus (DM) and peripheral neuropathy (PN) contributes to joint instability, ulceration and amputation. This study reports the intrarater and inter-rater measurement precision and least significant change (LSC) of radiological measures of foot deformity in subjects with DM, PN, and foot related complications.
Materials/Methods
Cuboid height, Meary’s angle, calcaneal pitch and hindfoot-forefoot angle were measured from plain-film radiographs on fifteen subjects with DM, PN and foot related complications. A foot and ankle fellowship trained orthopedic surgeon with 23 years of experience (rater 1) measured radiographs twice. A foot and ankle fellowship trained orthopedic surgeon with 2 years of experience (rater 2) and a radiologist in residency training (rater 3) measured radiographs once. Root mean square standard deviation and LSC were calculated to determine measurement precision and the smallest change considered biologically real, not the result of chance.
Results
Intrarater measurement precision was: 0.9 mm for cuboid height, 3 degrees for Meary’s angle, and 2 degrees for calcaneal pitch and hindfoot-forefoot angle. Inter-rater measurement precision for rater 1 vs 2 and 1 vs 3 were: 1.7 and 1.6 mm for cuboid height, 4 degrees for Meary’s angle, 2 degrees for calcaneal pitch, and 3 degrees for the hindfoot-forefoot angle. The LSC was less than or equal to: 4.7 mm for cuboid, 12 degrees for Meary’s angle, 8 degrees for calcaneal pitch, and 9 degrees for hindfoot-forefoot angle.
Conclusions
Cuboid height, calcaneal pitch, and hindfoot-forefoot angle measures can be completed with relatively good measurement precision.
Keywords: Calcaneal pitch, Cuboid height, Meary’s line, Dorsoplantar talocalcaneal bisector to the 2nd metatarsal angle
INTRODUCTION
Neuropathic Charcot arthropathy (NCA) is a late stage complication of diabetes mellitus (DM). Although the disease process is not well understood, it is believed that, in the presence of peripheral neuropathy (PN), an unrecognized or underappreciated trauma occurs to the foot.8 An inflammatory process begins which results in osteolysis, progressive joint destruction and bony fractures. The foot often deforms, increasing the risk of joint instability, soft tissue ulceration, and ultimately lower extremity amputation.7,8,10
Current understanding of the NCA process is that deformity progresses only during the acute phase of NCA.5 We have mounting clinical evidence that, in some individuals, foot alignment continues to worsen even after the acute NCA process becomes quiescent. Precise (reliable) measures of foot alignment are critical for research exploring the natural history and risk factors related to the development, progression, and treatment outcomes of NCA. Radiographic evidence of worsening foot alignment in the absence of the acute inflammatory phase could lead to early intervention, (that is, conservative bracing or surgical fixation) to prevent limb threatening complications from severe deformity and joint instability.
Measurement of foot alignment is not new. Standard measures have been developed and tested by numerous researchers.6,9,11 To our knowledge, little work has been done to determine the smallest change in foot alignment measurements considered biologically real and not the result of chance in individuals with DM, PN, and foot related complications. The purposes of this study are to report the intrarater and inter-rater measurement precision and least significant change (LSC) of radiological measures of foot alignment in subjects with DM, PN, and foot related complications.
MATERIALS AND METHODS
We performed a retrospective study of 15 subjects (6 men, 9 women, age=51 ± 9 years, BMI=34 ± 5 kg/m2, duration of DM=17 ± 9 years) with DM and PN. All subjects received 3 standard view radiographs (lateral, dorsoplantar, and oblique) as part of standard care for DM-related foot complications. Deformity was located in the hindfoot and midfoot (n=2), midfoot (n=6), midfoot and forefoot (n=3), and forefoot (n=3). One subject had no obvious deformity at the time of imaging. Radiographs could be weightbearing (5 subjects) or non-weightbearing (10 subjects). Subjects were excluded from the study if: 1) either one of the lateral or dorsoplantar radiographs were missing or of poor quality, and 2) if there were one or more foot amputations extending more proximal than the metatarsal head.
Peripheral Neuropathy Assessment
In all subjects, PN was assessed using previously described and reliable methods.3 All subjects were unable to feel the 5.07 (10 gram) Semmes-Weinstein monofilament in at least one of 7 locations on the plantar aspect of the foot.
Radiographic Measurements
Radiographs were imported into iSite PACS software for measurement (Philips Healthcare Informatics, Foster City, CA). With this software, measurements of length can be made to the nearest 0.1 mm and angles to the nearest 1 degree increment. All measurements used required identification of key bony landmarks. In cases where an essential bony landmark was missing (e.g. amputated 5th metatarsal head), raters were instructed to use the residual bone to complete the measurements.
Three measures of sagittal plane alignment were taken from the lateral radiograph: cuboid height (mm), Meary’s angle (degrees), and calcaneal pitch (degrees). (Figure 1) Cuboid height was measured as the perpendicular distance from the plantar aspect of the cuboid to a line drawn from the plantar surface of the calcaneal tuberosity to the plantar aspect of the 5th metatarsal head.9,11,12 Meary’s angle (talo-first metatarsal angle) was measured as the angle between the line originating from the center of the body of the talus, bisecting the talar neck and head, and the line through the longitudinal axis of 1st metatarsal. Positive angles indicated the apex of the angle was directed dorsally while negative values indicated that the apex was directed plantarly.9,11,12
Figure 1.

Lateral radiograph measures A) cuboid height, B) Meary’s angle and c) calcaneal pitch
Calcaneal pitch was measured as the angle between a line extending from the plantar aspect of the calcaneus to the plantar surface of the 5th metatarsal head and the line extending from the most plantar portion of the calcaneal tuberosity to the most plantar portion of the anterior calcaneus.9,11,12
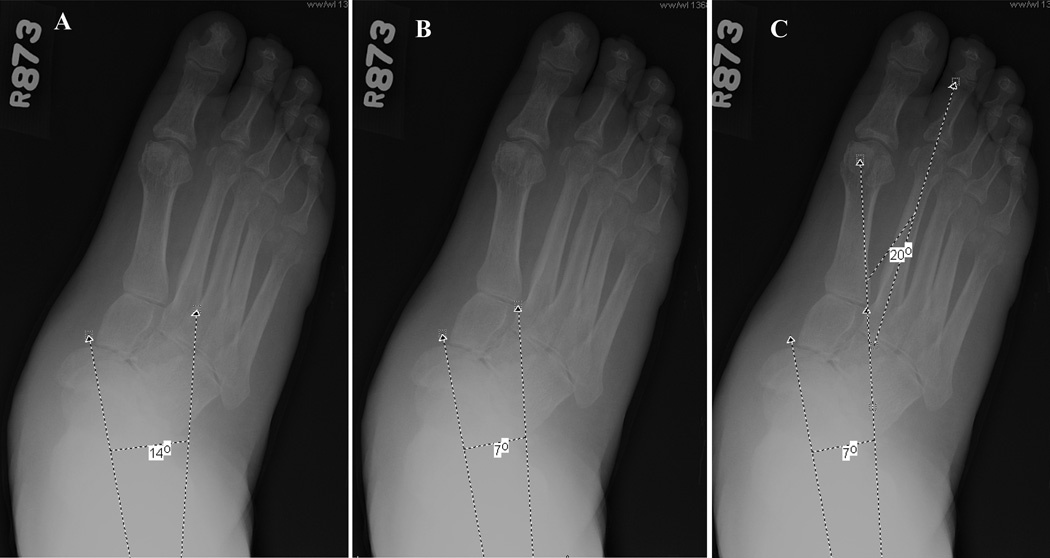
One measurement was taken from the dorsoplantar radiograph to measure transverse plane alignment: the hindfoot-forefoot angle (degrees). There are 3 steps to derive this measure: 1) we measured the talocalcaneal angle, which is the angle formed between the line that bisects the talar neck and head and the line parallel to the lateral cortex of the calcaneus, 2) we bisected the talocalcaneal angle, 3) we measured the hindfoot-forefoot angle, which is the angle between a line parallel to the bisector of the talocalcaneal angle and a line through the longitudinal axis of the 2nd metatarsal.6 (Figure 2)
Figure 2.
Dorsoplantar radiograph measure, hindfoot-forefoot angle: A) Talocalcaneal angle-line bisectng the talar neck and head and the line along the lateral cortex of the calcaneus, B) Bisection of this angle, C) Angle between the longitudinal axis of the 2nd metatarsal and the bisection of the talocalcaneal angle
A foot and ankle fellowship trained orthopedic surgeon with 23 years of experience (rater 1) completed all radiographic measurements twice, with a minimal interval between ratings of 1 month. A foot and ankle fellowship trained orthopedic surgeon with 2 years of experience (rater 2) and a radiologist in residency training (rater 3) measured the same radiographs once. All raters were blinded to each others’ ratings. Rater 1 was considered the expert and his measurements were considered the gold standard. Rater 2 and 3 completed a 45 minute, on line tutorial developed by Rater 1, which demonstrated how to use the iSite software, manipulate the measurement tools, and complete the measurement techniques. Additionally, rater 3 attended a 2 hour session with rater 1 that provided the opportunity to observe and discuss the measurement techniques on several test radiographs. Radiographs measured during the 45 minute on line tutorial and the 2 hour in person tutorial were not used in this project.
Statistical Analysis
Root-mean-square standard deviation (RMS-SD) was calculated to determine measurement precision. RMS-SD provides an indication of how much the measures from rater 2 and 3 varied from rater 1 and how much rater 1 varied over time.2,4 The standard deviation of the difference (SD Diff) between measurements was calculated to assist in comparing our measurements to previously published data.9 Least significant change (LSC) was also calculated. LSC represents the magnitude of change in a measurement needed to be 95% certain a true biological change has occurred and that the change did not occur because of chance.1 RMS-SD and LSC were calculated for: 1) Rater 1: comparing rating at time 1 vs rating at time 2, 2) Rater 1’s measures compared to rater 2, 3) Rater 1’s measures compared to rater 3, and 4) Combined raters 1, 2, and 3 (the values for the three raters combined would be used when subjects’ initial and follow up radiographs were being measured by different raters).
RESULTS
Radiographic Measures
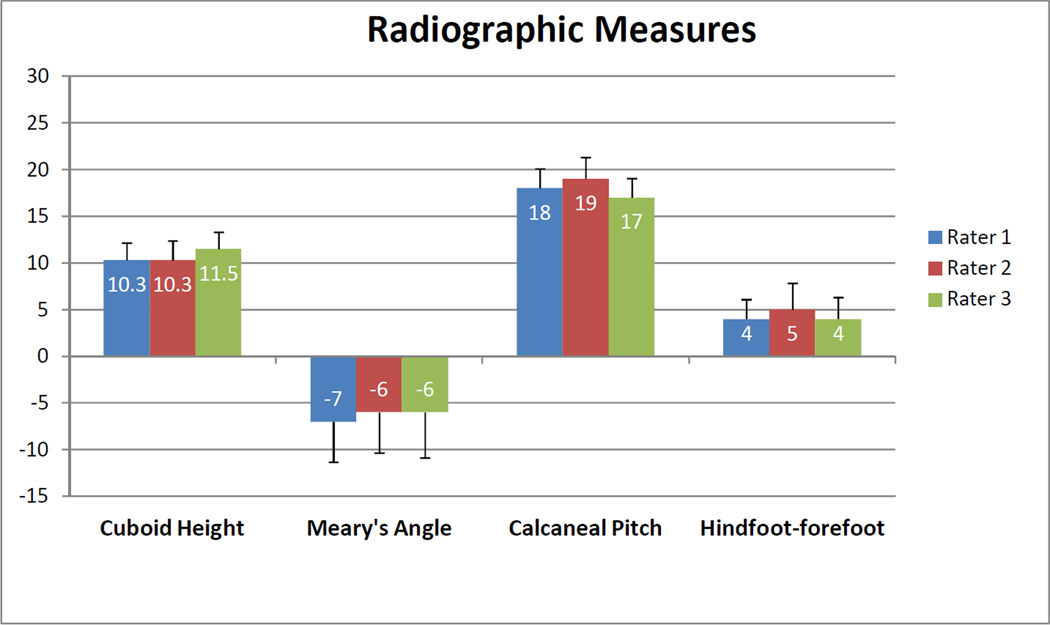
The average cuboid heights (primarily from non-weightbearing radiographs) for the NCA subjects were within the range of 10.3 to 11.5 mm. Meary’s angle was 6 to 7 degrees with the apex of the angle directed plantarly. Calcaneal pitch was 17 to 18 degrees directed dorsally and the hindfoot–forefoot angle was 4 to 5 degrees. (Figure 3)
Figure 3.
Average radiographic measures with standard error bars of cuboid height, Meary’s angle, calcaneal pitch, and hindfoot-forefoot angle for the 3 raters.
Measurement Properties
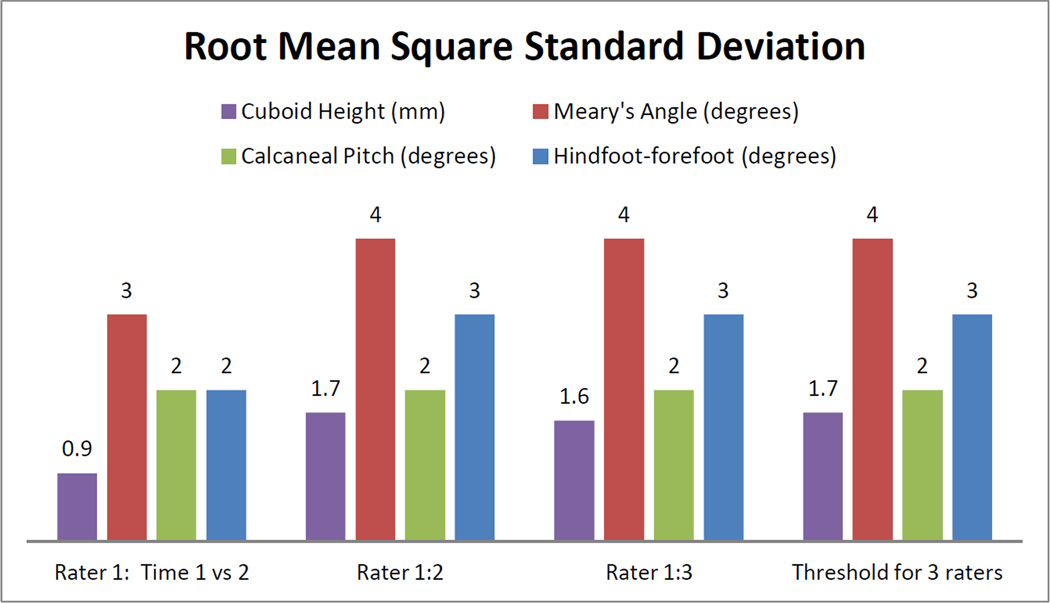
Measurement precision (RMS-SD) was best for rater 1 (time 1 vs time 2) for all measurements. (Figure 4) Across rater comparisons, the distance measure precision of cuboid height ranged from 1.6 to 1.7 mm. The angular measure with the best precision (smallest RMS-SD) was calcaneal pitch (2 degrees), followed by hindfoot-forefoot (3 degrees), and Meary’s angle (4 degrees). The measurement precision for all 3 raters combined was 1.7 mm for cuboid height, 4 degrees for Meary’s angle, 2 degrees for calcaneal pitch, and 3 degrees for hindfoot-forefoot.
Figure 4.
Root mean square standard deviation for radiological measures comparing Rater 1 (time 1 vs time 2), rater 1 to rater 2 (rater1:2), rater 1 to rater 3 (rater 1:3), and the threshold value for all 3 raters.
The SD Diff for intra and inter-rater precision were; 1) Cuboid height= 2.4 to 5 mm, 2) Meary’s angle=10 to 12 degrees, 3) Calcaneal pitch=4 to 6 degrees, and 4) Hindfoot-forefoot angle=6 to 10 degrees. (Table 1)
Table 1.
Standard deviation of the difference between measurements
| Measurement | Rater 1 (Time 1 vs. Time 2) |
Rater 1 vs 2 | Rater 1 vs 3 |
|---|---|---|---|
| Cuboid Height (mm) | 2.4 | 5 | 3.8 |
| Meary’s Angle (degrees) | 10 | 12 | 12 |
| Calcaneal Pitch (degrees) | 4 | 6 | 6 |
| Hindfoot-forefoot Angle (degrees) | 6 | 8 | 10 |
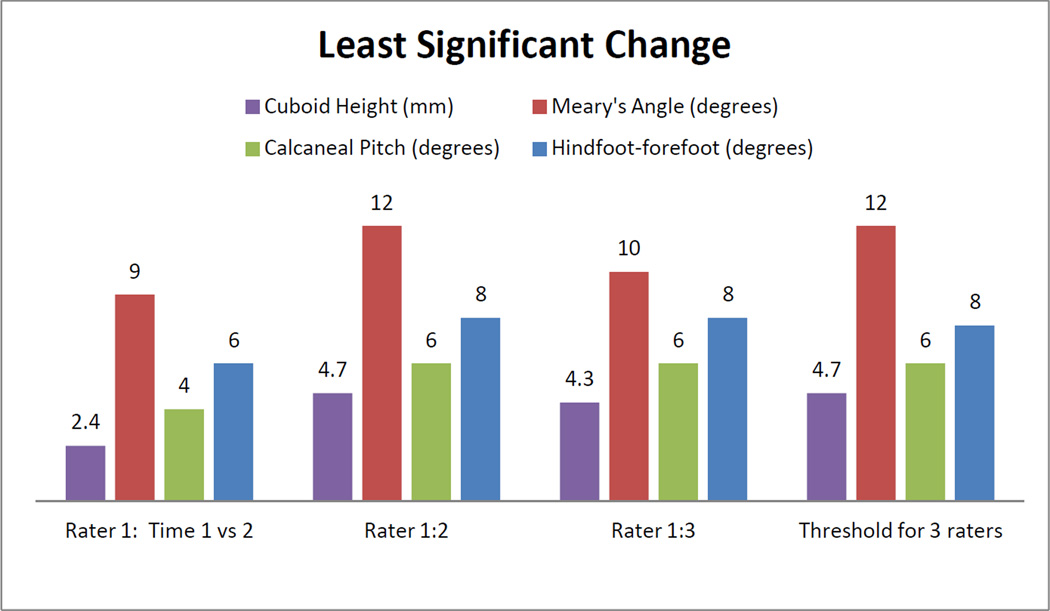
The smallest change in cuboid height that would be considered biologically true (LSC), not a result of chance, was 2.4 mm, 4.7 mm and 4.3 mm for raters 1, 2 and 3 or 4.7 mm for combined raters. The LSCs for Meary’s angle were between 9 and 12 degrees, while calcaneal pitch were between 4 and 6 degrees and hindfoot-forefoot angle were between 6 and 8 degrees. (Figure 5)
Figure 5.
Least significant change for radiological measures comparing Rater 1 (time 1 vs time 2), rater 1 to rater 2 (rater1:2), rater 1 to rater 3 (rater 1:3), and the threshold value for all 3 raters.
DISCUSSION
In this study, we applied traditional measures of radiographic alignment to a group of subjects with NCA related deformity. We found that in patients with severe foot deformities, cuboid height, calcaneal pitch, and hindfoot-forefoot angle could be measured with excellent precision, small error, and that the measure could be clinically useful in monitoring disease progression.
The cuboid height measurement was simple to perform, with landmarks that are visible and rarely obscured by the NCA deformity process, and had the best precision. Schon et al measured cuboid height in a large group of individuals with midtarsal foot deformities and reported intrarater and inter-rater standard deviations of differences were 10 mm.9 These large standard deviations are likely attributable to inclusion of individuals with lateral column midfoot deformities as indicated by the reported cuboid height averages being as low as −4 degrees. Our average of 10 mm for cuboid height indicates relative sparing of the lateral column deformity in our NCA subjects. Greater deformity and bone destruction would increase the difficulty of determining the landmarks needed for precise measurement.
In our study, Meary’s angle had the worst measurement precision, which is in agreement with the findings of Schon et al.7 Meary’s angle requires extending a bisecting line through the head and neck of the talus and placing another line parallel through the shaft of the 1st metatarsal. The head of the talus is often involved in the deformity process, making this measurement important in monitoring disease and treatment progression. However, if the talus is deformed, the measurement becomes difficult to perform and in one case, the deformity was so severe that the measurement could not be completed. Additionally, poor radiograph quality often impacts the ability to visualize the talus.
Calcaneal pitch, like cuboid height, uses bony landmarks that are often preserved in NCA deformities and easily identified on a lateral view radiograph. As a result, the measurement precision of calcaneal pitch was excellent. Our findings are similar to those of Schon et al (SD Diff= 4 to 7 degrees) despite Schon’s more involved subject pool (calcaneal pitch average as low as −8 degrees compared to our average of 17 to 19 degrees).9 In our experience, even in the presence of large angular deformities of the calcaneus, the structure of the bone often remains intact and readily identified.
The hindfoot-forefoot angle has not been commonly included in measurement studies. We believe the measure to be an excellent indicator of deformity of the forefoot relative to the hindfoot in the transverse plane. We consider our precision for this measurement to be good and the LSC to be clinically useful. The most challenging component of the hindfoot-forefoot angle measurement was determining the landmarks for the talocalcaneal angle which are often impacted by poor radiograph quality in the hindfoot and involved in NCA deformity.
In this study we, like Schon et al, included weightbearing and non-weightbearing radiographs.9 There are unique clinical presentations in which weightbearing radiographs are not appropriate. For purposes of clinical utility and determining measurement precision we felt it most appropriate to measure all individuals regardless of radiographic weightbearing status. However, it is likely the magnitude of the deformities measured in this study would be larger if all radiographs had been weightbearing. Additionally, we believe that weightbearing films should be used when monitoring deformity over time.
Intrarater measurement precision was better than inter-rater measurement precision for all radiographic measures. This is neither a new nor surprising finding and supports study methods that employ a single rater when attempting to quantify measurement change over time. The online training session, and a short session of training with the expert rater for rater 3, provided adequate instruction and confidence that trained personnel can make precise radiographic measurements of foot alignment. Our current sample size prevented definitive analysis of rater improvement over time. Future research involving novice raters should determine optimal training duration and how measurement error changes with increasing experience.
A limitation of this study is the difficulty with finding landmarks in two-dimensional radiographs of three dimensional structures that have large bone and joint deformities and in some cases may be partially destroyed. We are exploring the use of volumetric quantitative computed tomography to provide better visualization of bony landmarks to assist in improving measurement precision. Another limitation of this study is that we are unable, at this time, to provide the clinician with a minimal change in measurement that would be considered clinically important and indicate the need for an aggressive treatment approach. We are addressing this limitation in our current research as we take repeated radiographic measures over a 2 year period of time and closely monitor long term clinical outcomes in individuals with NCA and those at risk of NCA.
Another potential limitation of this study is the inclusion of nonweightbearing and weightbearing radiographs. It is likely that the magnitude of deformity would be greater in weightbearing radiographs compared with nonweightbearing radiographs. We are currently collecting longitudinal alignment measures (all collected in weightbearing) to determine deformity magnitude in individuals with NCA. We do not believe alignment measure precision, the primary purpose of this study, is impacted by the weightbearing status of the radiograph. In addition, nonweightbearing radiographs are often a clinical reality. Many patients with NCA present with nonweightbearing radiographs that must be measured to provide a comparison to future radiographs. There are also many co-morbidities that prevent weightbearing radiographs in this group of patients. Precise measurements that can be applied to both nonweightbearing and weightbearing radiographs are essential.
We have determined that radiographic measures are precise and allow repetition of measurement with only small error. Measurements that are precise will allow us to study the natural history of NCA, explore factors that increase the risk of development and progression, and determine the timing and type of treatments that are most effective. Additionally, we believe that prevention of disability and amputation lies in early recognition of small changes in alignment that trigger timely joint stabilization through conservative and surgical interventions.
Acknowledgements
This publication was made possible by Grant Numbers R01 DK059224, R21 HD048972, R21 DK079457, K12 HD055931, K30 RR022251, UL1 RR 024992-01
Contributor Information
Mary K. Hastings, Email: hastingsmk@wustl.edu, Washington University School of Medicine, Program in Physical Therapy, St. Louis, MO, Mailing address: Washington University School of Medicine, Campus Box 8502, 4444 Forest Park Blvd., Room 1101, St. Louis, MO 63108-2212.
David R. Sinacore, Washington University School of Medicine, Program in Physical Therapy, St. Louis, MO.
Nicole Mercer-Bolton, Washington University School of Medicine, Department of Radiology, St. Louis, MO.
Jeremy McCormick, Washington University School of Medicine, Department of Orthopaedics, St. Louis, MO.
Charles F. Hildebolt, Electronic Radiology Laboratory, Mallinckrodt Institute of Radiology, Washington University School of Medicine, St. Louis, MO.
Fred W. Prior, Electronic Radiology Laboratory, Mallinckrodt Institute of Radiology, Washington University School of Medicine, St. Louis, MO.
Jeffrey E. Johnson, Washington University School of Medicine, Department of Orthopaedics, St. Louis, MO.
References
- 1.Bonnick SL. Bone densitometry in clinical practice: application and interpretation. Humana Press; 2003. [Google Scholar]
- 2.Commean PK, Kennedy JA, Bahow KA, et al. Volumetric Quantitative Computed Tomography Measurement Precision for Volumes and Densities of Tarsal and Metatarsal Bones. J. Clin. Densitom. 2010 doi: 10.1016/j.jocd.2011.05.006. [DOI] [PMC free article] [PubMed] [Google Scholar]
- 3.Diamond JE, Mueller MJ, Delitto A, Sinacore DR. Reliability of a diabetic foot evaluation. Phys Ther. 1989;69(10):797–802. doi: 10.1093/ptj/69.10.797. [DOI] [PubMed] [Google Scholar]
- 4.Gluer CC, Blake G, Lu Y, Blunt BA, Jergas M, Genant HK. Accurate Assessment of Precision Errors - How to Measure the Reproducibility of Bone Densitometry Techniques. Osteop Int. 1995;5(4):262–270. doi: 10.1007/BF01774016. [DOI] [PubMed] [Google Scholar]
- 5.Jeffcoate WJ, Game F, Cavanagh PR. The role of proinflammatory cytokines in the cause of neuropathic osteoarthropathy (acute Charcot foot) in diabetes. Lancet. 2005;366(10):2058–2061. doi: 10.1016/S0140-6736(05)67029-8. [DOI] [PubMed] [Google Scholar]
- 6.Johnson JE, Johnson KA. Dowel arthrodesis for degenerative arthritis of the tarsometatarsal (Lisfranc) joints. Foot Ankle. 1986;6(5):243–253. doi: 10.1177/107110078600600505. [DOI] [PubMed] [Google Scholar]
- 7.Pecoraro RE, Reiber GE, Burgess EM. Pathways to Diabetic Limb Amputation - Basis for Prevention. Diabetes Care. 1990;13(5):513–521. doi: 10.2337/diacare.13.5.513. [DOI] [PubMed] [Google Scholar]
- 8.Schon LC, Easley ME, Weinfeld SB. Charcot neuroarthropathy of the foot and ankle. Clin Orthop. 1998;349:116–131. doi: 10.1097/00003086-199804000-00015. [DOI] [PubMed] [Google Scholar]
- 9.Schon LC, Weinfeld SB, Horton GA, Resch S. Radiographic and clinical classification of acquired midtarsus deformities. Foot Ankle Int. 1998;19(6):394–404. doi: 10.1177/107110079801900610. [DOI] [PubMed] [Google Scholar]
- 10.Sinacore DR. Severe sensory neuropathy need not precede Charcot arthropathies of the foot or ankle: Implications for the rehab specialist. Physiother Theory Pract. 2001;17:39–50. [Google Scholar]
- 11.Steel MW, III, Johnson KA, DeWitz MA, Ilstrup DM. Radiographic measurements of the normal adult foot. Foot Ankle Int. 1980;1(3):151–158. doi: 10.1177/107110078000100304. [DOI] [PubMed] [Google Scholar]
- 12.Younger AS, Sawatzky B, Dryden P. Radiographic assessment of adult flatfoot. Foot Ankle Int. 2005;26(10):820–825. doi: 10.1177/107110070502601006. [DOI] [PubMed] [Google Scholar]


