

Abstract
Phosphofructokinase (Pfk1, EC 2.7.1.11) plays a key regulatory role in the glycolytic pathway. The combination of X-ray crystallographic and biochemical data has provided an understanding of the different conformational changes that occur between the active and inhibited states of the bacterial enzyme, and of the role of the two bacterial effectors. Eukaryotic phosphofructokinases exhibit a far more sophisticated regulatory mechanism, they are more complex structures regulated by a large number of effectors (around 20).
Saccharomyces cerevisiae Pfk1 is an 835 kDa hetero-octamer which shows cooperative binding for fructose-6-phosphate (F6P) and non-cooperative binding for ATP. The 3D structure of the F6P-bound state was obtained by cryo-electron microscopy to 1.1 nm resolution. This electron microscopy structure, in combination with molecular replacement using the bacterial enzyme has helped provide initial phases to solve the X-ray structure of the F6P-bound state 12S yeast truncated-tetramer.
Biochemical and small-angle X-ray scattering (SAXS) studies had indicated that Pfk1 underwent a large conformational change upon Mg-ATP binding. We have calculated a reconstruction using reference-based 3D projection alignment methods from 0° images acquired from frozen-hydrated preparations of the enzyme in the presence of Mg-ATP. The ATP-bound structure is more extended or open, and the calculated radius of gyration of 7.33 nm (7.0 nm for F6P) is in good agreement with the SAXS data. There is a substantial decrease in the rotational angle between the top and bottom tetramers. Interestingly, all these changes have arisen from a reorientation of the α- and β-subunits in the dimers. The interface region between the α- and β-subunits is now approximately half the size of the one in the F6P-bound structure. This is the first time that the 3D structure of a eukaryotic Pfk1 has been visualized in its T-state (inhibited-state).
Keywords: glycolytic enzymes, 3D reconstruction, X-ray, Radon transforms, point mode, T-state, inhibited state, yeast, eukaryotic enzyme
Introduction
Phosphofructokinase (Pfk1, EC 2.7.1.11) is a key regulatory enzyme of glycolysis. It catalyzes the formation of fructose 1,6-bisphosphate from fructose 6-phosphate (F6P) and adenosine triphosphate (ATP). Prokaryotic Pfk1s are tetramers composed of identical subunits with a molecular weight of 35 kDa per subunit (Blangy, 1968). Eukaryotic Pfk1s -- at the genetic, kinetic and structural level -- are more complex enzymes. They form tetrameric (mammalian and Rhodotorula glutinis) or octameric (most yeasts) structures and have subunits of molecular weights in the range of 80–110 kDa. Most phosphofructokinases are allosteric enzymes regulated by several effectors. While the bacterial enzyme has only two known effectors -- adenosine diphosphate (ADP) as activator and phosphoenolpyruvate (PEP) as inhibitor, the regulation of eukaryotic Pfk1s is much more intricate, the enzyme activity being affected by at least 20 different compounds (Sols, 1981). A process of gene duplication and fusion of the bacterial gene gave rise to a “double-size” eukaryotic enzyme with twice the number of active sites (Poorman, et al., 1984; Heinisch, 1986). The nucleotide regulatory site in eukaryotes can bind ADP and AMP (adenosine monophosphate) as activators and ATP as inhibitor. A single mutation in the ATP catalytic site located in the C-terminal domain of the molecule precludes ATP from binding at this location, thus losing a catalytic site. This has allowed the F6P catalytic site located in the C-terminal domain of the molecule to evolve into a regulatory site for sugar effectors (Poorman, et al., 1984; Heinisch, 1986).
Phosphofructokinase has been studied for many years as a model enzyme for Monod-Wyman-Changeux allosteric kinetic behavior. The conformational changes observed in different states by the Evans’ group have led to an understanding of the catalytic and regulatory mechanisms for the bacterial enzyme (Evans and Hudson, 1979; Evans, et al., 1986; Shirakihara and Evans, 1988; Rypniewski and Evans, 1989). The bacterial tetramer can be considered as a dimer of dimers. The subunits are composed of two domains; F6P and ATP bind to the small and large domains, respectivelyd. The catalytic sites are localized in the interface between dimers, while the effector site is located at the interface between the subunits of a dimer (Evans, 1992). From the inhibited (T-state), the molecule undergoes a conformational change (one of the two dimers is rotated by 7° with respect to the other) allowing the two substrates (F6P and ATP) to come together. While a wealth of information -- structural and biochemical -- is available for the bacterial Pfk1, the mechanism in eukaryotes is still not well understood.
The kinetic properties of phosphofructokinase from Saccharomyces cerevisiae, a hetero-octamer composed of two different subunits (α and β) in a β2α4β2 configuration, have been extensively characterized (Kopperschläger, et al., 1977; Plietz, et al., 1978; Tijane, et al., 1979). Like its prokaryotic counterpart, the yeast Pfk1 shows a cooperative binding for F6P and a non-cooperative binding for ATP (Reuter, et al., 1979). S. cerevisiae Pfk1 (21S sedimentation coefficient) is sensitive to proteolysis by both endogenous and exogenous proteases, showing different proteolytic patterns in the presence of substrates and effectors (Taucher, et al., 1975; Kopperschläger, et al., 1993). In the presence of F6P, both, the α- and β-subunits lose 200 residues from the N-terminus, giving rise to a stable octameric subcomplex of 17S sedimentation coefficient (composed of α′- and β′-subunits). However, in the presence of ATP, the α-subunit loses an additional 10 kDa fragment from the C-terminus, which is required for octamerization. Thus, the octamer is degraded to two truncated tetramers of 12S sedimentation coefficient (composed of α″- and β′-subunits). Presently, it is believed that a large conformational change occurs when ATP is bound to the structure at saturating concentration. Small angle X-ray scattering (SAXS) experiments have shown that the radius of gyration (RG) changes from RG = 7.0nm in the presence of F6P to RG = 7.3 nm in the presence of ATP (Laurent, et al., 1984).
The first 3D structure of S. cerevisiae Pfk-1 in the presence of F6P obtained by cryo-electron microscopy revealed the shape of the subunits and their mutual arrangement in the octamer (Ruiz, et al., 2001). In addition, it proved the homogeneity of the preparations, the stability of the molecules at the low concentrations used for the electron microscopy studies and the tendency of Pfk1 to lie in all orientations in the carbon surface. Our high-resolution studies evidenced that nature used the bacterial tetramer as the structural building block to construct the higher eukaryotic enzymes and allowed the localization of the putative F6P catalytic binding sites (Ruiz, et al., 2003). The radius of gyration calculated from the 3D reconstruction was in good agreement with the value obtained from SAXS experiments in the presence of F6P (Plietz, et al., 1978; Laurent, et al., 1984). Since this 3D reconstruction was carried out without imposing any symmetry, we were able to visualize an asymmetry between the top and bottom tetramers, while the dimers within each tetramer were highly symmetrical. Attempts to explain this asymmetry as arising from a technical artifact were unsuccessful, which suggests that the asymmetry is an intrinsic feature of the molecule. Moreover, this electron microscopy structure, in combination with molecular replacement provided the initial phases to solve the X-ray structure of the 12S yeast truncated tetramer in the presence of F6P (Mechin, 2002; Mechin, et al., 2002).
The ultimate goal of our research is to establish a working model for the catalytic and regulatory processes of Pfk1 in eukaryotes. Presently, we have calculated a 3D reconstruction from frozen-hydrated preparations of the enzyme in the presence of Mg-ATP and compared it with our 3D reconstruction of the enzyme in the presence of F6P. Our results show that the enzyme undergoes a large conformational change from the R-state (F6P-bound state) to the T-state (ATP-bound state), which correlates well with the SAXS experiments described above. In addition, the asymmetry observed initially in the F6P-bound state is also present in the ATP-bound state, which strengthens the hypothesis of its in vivo significance. This work represents a major step towards gaining a better understanding of the structure/function relationship in phosphofructokinases of eukaryotic organisms.
Materials and methods
Enzyme purification
Pfk1 from Saccharomyces cerevisiae was purified from a multicopy mutant according to Hofmann and Kopperschläger (1982) with minor modifications (Ruiz, et al., 2003).
Electron microscopy
A small aliquot of the enzyme suspension was diluted to 5mg/ml in a sodium phosphate buffer (pH 7.2) complemented with 1 mM ATP and 3 mM MgSO4, and run through a micro-Bio-Spin P30 column (BioRad) previously equilibrated with the same buffer. The protein was diluted to 20 μg/ml with the same buffer in the presence of a 25 μg/ml polydisperse sample of Tobacco Mosaic Virus (TMV) and applied to 400 mesh copper holey grids coated with a thin carbon film. The grids were blotted and frozen in liquid ethane cooled at liquid nitrogen temperature in a 4°C environment to minimize evaporation.
The grids were observed on a CM120 FEI electron microscope equipped with a LaB6 cathode operated in point mode (Ruiz, et al., 2003; Ruiz and Radermacher, 2006). Negatives were recorded at an accelerating voltage of 100 kV and a nominal magnification of 60 kX, under low dose conditions, on S0–163 Kodak film (electron dose ~ 1000 e−/nm2). 0° tilt images were collected at different defoci (1–3.5 μm) to insure a good coverage of the Fourier space.
Image processing
Negatives were scanned on a Zeiss SCAI flat bed scanner (7 μm raster size). The images were binned two times (0.24 nm/pixel). Selected particles were windowed into square images (48×48 nm2) and normalized with the average density of the individual images. All the image processing was carried out using SPIDER (version 5.0, with modifications, (Frank, et al., 1996; Radermacher and Ruiz, 2006). The contrast transfer function (CTF) for each single particle image was corrected by flipping the sign of the transfer function using a smooth function without affecting the amplitude (Radermacher, et al., 2001).
Image processing was carried out by reference-based 3D projection alignment methods (Ruiz, et al., 2003; Radermacher and Ruiz, 2006) using Radon transform algorithms (Radermacher, 1994; Radermacher, 1997). The strategy is divided into three steps: an initial rough alignment of the CTF corrected projections to an existing volume, an intermediate low-resolution alignment and a final high-resolution alignment. Rough alignments of the projections to the reference volume were performed on images reduced 2 times more (pixel size 0.48 nm). First, the projections were translationally and rotationally aligned to a reference volume (F6P volume from S. cerevisiae,(Ruiz, et al., 2003). To minimize biasing the alignment with the reference, the initial search was carried out over the entire angular space (30° angular increments with a strongly low-pass filtered reference (7 nm)). The aligned projections were used to generate a new volume that served as reference for the subsequent alignment. Multiple iterations of translational/rotational alignment were carried out until the orientation of the projections was stable to 0 pixel of translational shift and ± 2° of angular shift. Subsequently, the alignment parameters were properly applied to the non-reduced images and a new set of refinement iterations was started using the 0.24 nm/pixel images. During these refinements, the reference volumes were low-pass filtered to 115% of the resolution and high-pass filtered to 1/2 of the particle diameter. The resolution for the alignment steps was determined by Fourier shell correlation (Saxton and Baumeister, 1982; van Heel, et al., 1982). The refinement process was stopped when the orientation of the projections was stable to 0 pixel of translational shift and ± 1° of angular shift (Ruiz, et al., 2003).
Volumes in different biochemical states were compared by displaying them as transparent surfaces in Chimera (Pettersen, et al., 2004). For the comparison between the two octamers in the presence of F6P and ATP, the two volumes were first aligned in Spider using reference-based 3D projection alignment methods (Ruiz, et al., 2003; Radermacher and Ruiz, 2006). Three orthogonal projections were computed from the test volume (ATP-bound state) and rotationally/translationally aligned to the reference volume (F6P-bound state) using Radon transform algorithms (Radermacher, 1994; Radermacher, 1997; Radermacher, 2001). The final shifts in X, Y and Z directions were calculated as the average of the values obtained for each of the projections, and the angular parameters were taken from the alignment of the (0,0) projection. To compare smaller subdomains of the volumes (tetramers, dimers), mask volumes were created having a value of 1 in the area of interest and 0 everywhere else. The mask volumes were low-pass filtered to avoid introducing edge artifacts. The ATP and F6P volumes were multiplied by the corresponding mask volume to create volumes of the smaller subdomains. The alignment method is the same described above for the octamer using one of the smaller subcomponent’s volumes (e.g. tetramers, dimers) as a reference.
Results
A 3D reconstruction of phosphofructokinase from Saccharomyces cerevisiae in the presence of Mg-ATP was calculated from 14,500 0° tilt images extracted from negatives collected at different defoci from vitreous ice preparations (Fig. 1a). The periodogram (Radermacher, et al., 2001; Ruiz, et al., 2003) shows the quality of the data (with rings beyond 0.9 nm, Fig. 1b). 61 negatives with defoci ranging between 1.0 and 3.5 μm were used to achieve a full coverage of Fourier space.
Figure 1.
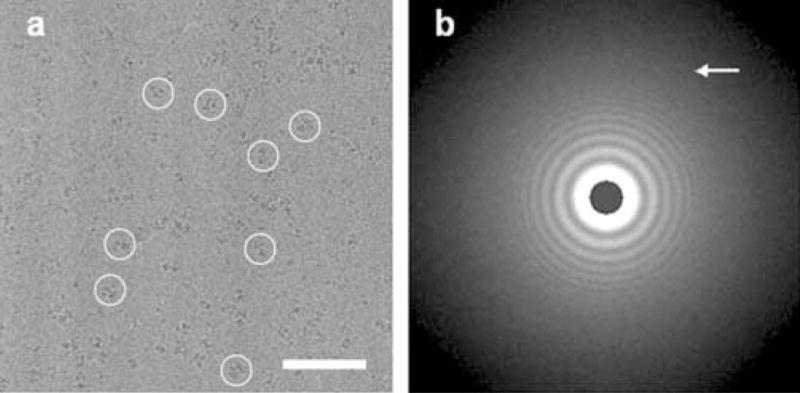
a) Area of a micrograph from a vitreous ice preparation. Circles show Pfk1 molecules. Scale bar 100 nm. b) Average periodogram calculated from the whole micrograph showing data to 0.8–0.9 nm resolution. The edge of the periodogram corresponds to 1/0.48nm−1. The arrow points to the last visible ring in the periodogram (Radermacher, et al., 2001; Ruiz, et al., 2003).
The 3D reconstruction was calculated using reference based 3D projection alignment methods and only 0° tilt images (Ruiz, et al., 2003; Radermacher, et al., 2006). The 2D projections of the enzyme in the ATP-bound state (T-state) were initially aligned to a strongly low-pass filtered (7 nm) volume of the enzyme in the F6P-bound state (Ruiz, et al., 2003) in broad angular steps (30°) to define a similar orientation for the new volume and to achieve a good centration of the projections. Previously, we had observed that this is the optimum method to center the projections; given the characteristic shape of the yeast Pfk1, different views of the molecule vary in size and appearance. Attempts to center the projections using a low-pass filtered blob or a rotational average of the projections always gave lower quality results and in some cases miscentrations. Once the projections were centered and roughly oriented in space, a new volume was calculated from the T-state projections and used as reference for further refinements. After 23 rounds, the refinement process was stopped and a final 3D reconstruction was calculated (Fig. 2). The alignment progress was followed by checking the translational/rotational shifts for each projection and by calculating the resolution of each newly created volume. The final resolution of the structure is 1.3 nm using a 0.3 Fourier shell correlation cut-off (Rosenthal and Henderson, 2003) and 1.2 nm using the 5 times the noise Fourier shell correlation criterion (Fig. 3). The complete angular coverage was corroborated by the data in the last X-slice of the 3D Radon transform, which showed that every radial line was filled by contributions from more than one projection. A plot of the final angular distribution of the particle orientations shows that all projecting directions are well covered and that most of the projections represent a fully occupied single axis tilt series around the long axis of the particle (supplemental material). The threshold value chosen for the surface representation was obtained using the steepest contour criterion (Verschoor, et al., 1984), under these conditions the molecule encompassed 110% of the molecular weight of Pfk1.
Figure 2.
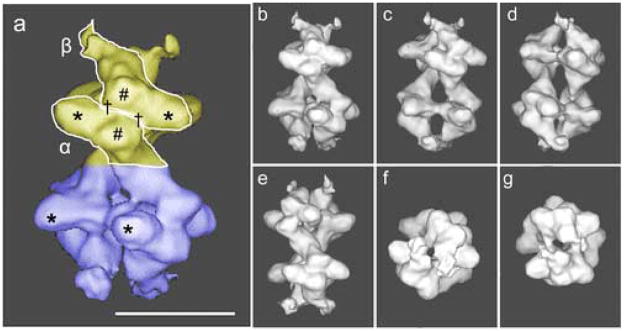
a) Surface representation of the 3D reconstruction calculated from 14500 0°-projections in random orientations encompassing 110% of the molecule mass. The top-tetramer is shown in yellow and the bottom-tetramer in blue. The L-shaped α- and β-subunits are shown. The small-subdomains of both α- and β-subunits are labeled with (#), the large subdomains with (*) and two the catalytic-sites per αβ-dimer with (†). Scale bar 10 nm. b) same as (a) front-view or 0°-rotation, c) side-view 36°-rotation, d) side-view 72°-rotation, e) side-view 144°-rotation, f) bottom-view, 90°-rotation, g) top-view, 90°-rotation.
Figure 3.

Fourier shell correlation curve (solid line) and five times noise correlation curve (dashed line). The resolution is 1.3 nm with the 0.3 criterion (Rosenthal and Henderson, 2003).
The overall appearance of the yeast Pfk1 in the T-state or in the R-state is very similar. The molecule can be described as a dimer of tetramers; the top (Fig. 2a, yellow) and the bottom (Fig. 2a, blue) tetramers being joined by a thin connection. The L-shape of the subunits described previously is more evident in this state than in the R-state. In the presence of ATP, the molecule is approximately 24.5 nm long and 16.2 nm wide. At the distal ends of the molecule, it is easy to see that the tip of the L (β-subunit) has lifted outwards (Fig. 2). Some of the regions of Pfk1 seem to be more flexible in the T-state than in the R-state, since the external densities mentioned above (Fig. 2) are sensitive to the threshold value used in the surface representation. Those at the top of the molecule (Fig. 2, β-subunit yellow tetramer) start to disconnect from the molecule as the threshold is increased, while those at the bottom (Fig. 2, β-subunit blue tetramer) remain connected. The radius of gyration (RG) for the 3D structure calculated using the command “cg 3” in Spider shows a significant increase in RG in the T-state (RG = 7.33 nm). In addition, a large change has occurred in the relative orientation of the two tetramers in the octamer. The angle between the top and bottom tetramers was calculated to be 75° in the R-state and 46° in the T-state (Fig. 4).
Figure 4.

Surface representations of the structure of Pfk1 in the presence of F6P (a) and ATP (b). The two views of each state are related by the noted rotation around the long axis of the molecule, which gives the best fit between the top and bottom tetramers. The large-subdomains of both α- and β-subunits are labeled with (*). Scale bar 10 nm.
We have analyzed the conformational changes by comparing the volumes in both states, after they had been optimally aligned. A comparison of the whole octameric structure proved to be a futile effort, as was expected, since the angle between the two tetramers in the two states had suffered a large change (29°, Fig. 5). However, figure 5 clearly shows that Pfk1 is larger in the T-state; the subunits have rearranged towards the outside of the molecule resulting in a more open central channel at the distal ends (Fig. 2a). The next logical step in the comparison was to isolate smaller domains of the molecule to carry out the analysis. Therefore, we cut each volume into two tetramers and carried out the necessary alignments. Before analyzing the tetramers in different states, we studied the differences between the tetramers in the same state (Fig. 6). Previously, we had observed that the molecule was not symmetrical (Ruiz, et al., 2003); all the efforts to attribute this asymmetry to an experimental artifact had been unsatisfactory. Thus, we concluded that the two tetramers in the R-state were not identical (Figs. 4 and 6a). In the top tetramer, the small subdomain of one subunit has stronger interactions with the middle of the large subdomain (* in all figures) of the other subunit and there is almost no interaction between the two small subdomains, while in the bottom tetramer the interactions between the small subdomains of the two subunits are stronger. A similar asymmetry between the tetramers can be observed in the T-state (Figs. 4 and 6b). The top tetramer in the T-state shows similar subunit interactions as the bottom tetramer of the R-state, while in the bottom tetramer of the T-state the subunits interact mainly through the small subdomains. These differences become more evident when the tetramers in the different states are superimposed, once they have been properly aligned (Fig. 7). Since the tetramers are not identical, we have compared each of the tetramers in the T-state (top in Fig. 7a,c and bottom in Fig. 7b,d) with each of the tetramers in the R-state (top in Fig. 7a,b and bottom in Fig. 7c,d). Figure 7 displays the side views of the molecule in the left panels and the front views on the right panels. All the differences in the interactions between the small and large subdomains described above can be seen in the front views for the top tetramer in the R-state (Fig. 7a,b) and for the bottom tetramer in the R-state (Fig. 7c,d). In addition, the side views indicate that the dimers have also rearranged with respect to each other --almost in a rocking motion -- since the fit is always better for subdomains diagonally opposed (Fig. 7; white areas). The worst fit is observed at the distal ends of the molecules; this indicates that the subunits not only have slid past each other to create strong interactions between the small subdomains but that the end of the external L-shaped molecules acquired a different conformation moving away from the molecule. We attempted to subdivide the molecule into smaller subcomponents (dimers and monomers) without success, since the boundaries of the subunits are not clearly defined (data not shown). A more detailed understanding of the conformational changes that each of the subunits have undergone will only be possible when the final X-ray model of the truncated tetramer (Mechin, 2002; Mechin, et al., 2002) is available and can be fitted into the different states.
Figure 5.

Superposition of the structures of Pfk1 in the presence of F6P and in the presence of ATP after alignment of the whole octamer (Chimera representation). The two views (a and b) are related by a 90° rotation around the long axis of the molecule. F6P-bound state (solid yellow), ATP-bound state (transparent blue). The region where the two surfaces coincide is shown in white. The large-subdomains of both α- and β-subunits are labeled with (*). Scale bar 10 nm.
Figure 6.
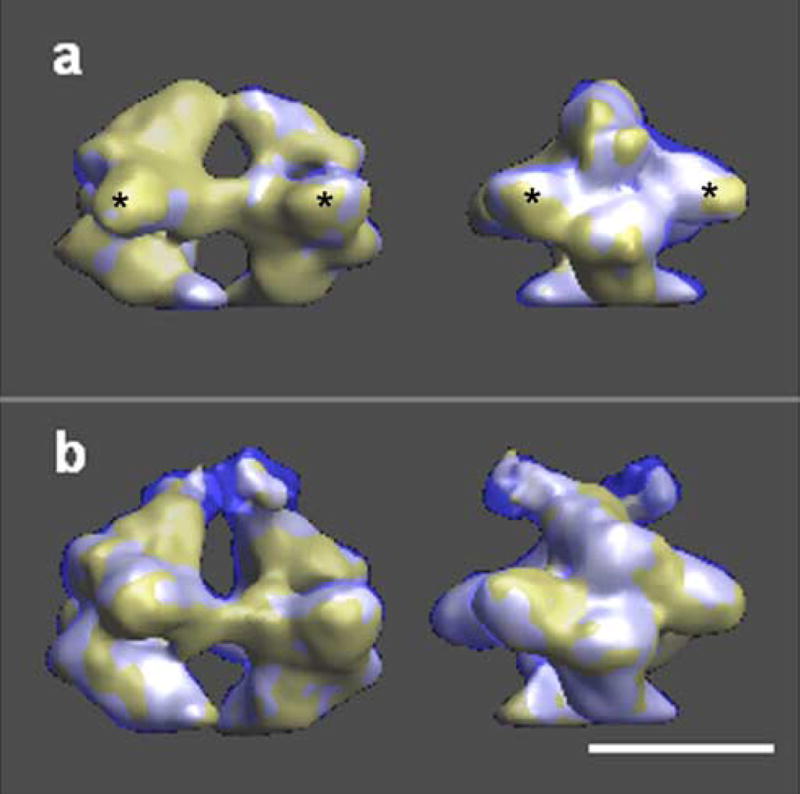
Superposition of the two tetramers of the structures of Pfk1 in the presence of F6P (a) and in the presence of ATP (b) after tetramer alignment (Chimera representation). The two views of each row are related by a 90° rotation around the long axis of the molecule (left panel (side view) and right panel (front view)). Each tetramer is represented in a different color (solid yellow --top tetramer and transparent blue --bottom tetramer). The region where the two surfaces coincide is shown in white. The large-subdomains of both α- and β-subunits are labeled with (*). Scale bar 10 nm.
Figure 7.

Superposition of the structures of Pfk1 in the presence of F6P and in the presence of ATP after alignment to the top tetramer of the F6P-bound state (a and b) and to the bottom tetramer of the F6P-bound state (c and d). The top tetramer of the ATP-bound state is shown in a and c while the bottom tetramer of the ATP-bound state is shown in b and d. The two views of each row are related by a 90° rotation around the long axis of the molecule. F6P-bound state (solid yellow), ATP-bound state (transparent blue). The region where the two surfaces coincide is shown in white. The large-subdomains of both α- and β-subunits are labeled with (*). Scale bar 10 nm
Discussion
We present here the structure of Pfk1 from S. cerevisiae (β2α4β2) in the T-state, generated by incubating the enzyme with saturating amounts of Mg-ATP. The 3D reconstruction at 1.2 nm resolution was calculated from 14,500 projections extracted from 0° tilt images of the specimen in vitreous ice. The octameric enzyme saturated with F6P (R-state) is 21.5 nm long and 15.2 nm wide -- calculated from the cryo-electron microscopy structure (Ruiz, et al., 2003), which is in good agreement with the values obtained from the X-ray model of the double-truncated tetramer in the same state (19 nm long and 15.0 nm wide, (Mechin, 2002). The differences in length can be easily explained since the truncated tetramers lack 190 residues of the N-terminal domains of both, the α- and the β-subunits, and 80 additional residues from the C-terminal domain of the α-subunit. The last 80 residues of the α-subunit are important for octamerization and are located at the core of the octameric structure. Thus, there are 160 residues per α-subunit dimer that need to be accommodated in between the two truncated tetramers, which could account for the 2.5 nm difference in length. In the ATP-bound state, the molecule is 24.5 nm long and 16.2 nm wide; Pfk1 seems to have swollen as predicted by Laurent et al. (1984). The calculated radius of gyration (RG) has also increased, RG = 7.33 nm, compared with RG = 7.0 nm obtained for the R-state (Ruiz, et al., 2003). Both values are in perfect agreement with those obtained from SAXS experiments (Laurent, et al., 1984). In addition, the large change observed between the relative orientations of the top and bottom tetramers in the structures (75° rotation between tetramers in the R-state and 46° rotation in the T-state) might explain the peak-shifts observed in the SAXS curves of the enzyme in the T-state.
The preliminary X-ray model of the double-truncated tetramer (Mechin, 2002; Mechin, et al., 2002) has confirmed the subunit arrangement proposed by Kricke et al. (1999), where the α-subunits constitute the core of the molecule and the β-subunits are located at the exterior. The catalytic surface (shown in all front views) is formed by the N-terminal domains of the α- and β-subunits arranged in an antiparallel fashion -- as was suggested by fitting the E. coli tetramer into the cryo-electron microscopy structure (Ruiz, et al., 2003). The change in the angle between the tetramers in the T-state might force a conformational change in the C-terminal domain of the α-subunit, involved in octamerization. This will expose the proteolytic site and facilitate the cleavage of the 80 end residues by chymotrypsin -- forming the α″ form of the α-subunit. The observed conformational change is in good agreement with the results obtained from limited proteolysis experiments that showed additional degradation of the α-subunit to α″ occurring solely in the presence of ATP and not F6P (Kopperschläger, et al., 1993).
A large amount of data supports that there is a difference between the two tetramers of the S. cerevisiae Pfk1. The asymmetry has been observed in the X-ray model of the double-truncated tetramer in the R-state (Mechin, 2002), in the electron microscopy 3D reconstruction of the octamer in the R-state (Ruiz, et al., 2001; Ruiz, et al., 2003) and in the present study in the T-state. The asymmetry was dismissed by Mechin as a possible crystallization artifact in the X-ray studies, while our earlier attempts to prove it artifactual in the electron microscopy studies were unsuccessful. Thus, we should start considering that the asymmetry between the tetramers is an inherent characteristic of the yeast Pfk1 that possesses biological significance. The number of substrate molecules bound to the octameric enzyme under saturating conditions is inconclusive, with one group claiming twice as many as the other (4 ATP and 4 F6P (Laurent, et al., 1978; Laurent, et al., 1979) versus 8 ATP and 8 F6P (Nissler, et al., 1977a; Nissler, et al., 1977b)). We know from the X-ray model of the double-truncated tetramer that the eukaryotic ATP inhibitor site has evolved from the bacterial ADP effector site, thus creating 8 possible effector sites for the ATP molecule. The total number of ATP molecules bound per octamer under saturating conditions, at both the catalytic and regulatory sites, is another subject of contention (8 ATP (Laurent, et al., 1978) versus 16 ATP (Nissler, et al., 1977b)). It is also known that the catalytic site of the C-terminal domain of the eukaryotic subunits has been mutated, providing an effector site for sugar compounds (8/octamer). However, only 4 fructose 2,6-bisphosphate molecules were found bound to the octamer (Kessler, et al., 1982). In addition, only 4 AMP molecules bind to the octamer, although there are 8 sites available in the enzyme (Laurent, et al., 1978). We should not discard the possibility that, even though there are 8 possible catalytic sites for each substrate and 16 possible regulatory sites (8 for nucleotides and 8 for sugar compounds), only half of them are occupied under saturating conditions. The observed asymmetry in the octameric structure tends to support this idea.
The F6P binding sites (Fig 2A, catalytic-sites shown by †) are located very close to the site where the N-terminal domains of the α- and β-subunits make strong contacts, in a position slightly closer to the small subdomain (Mechin, 2002; Ruiz, et al., 2003). The ATP binding sites are in the large subdomain of the opposite subunit. In E. coli, the dimers undergo a 7° rotation from the T-state to the R-state to bring ATP and F6P together to facilitate catalysis. Analyzing the catalytic surfaces of the 3D reconstructions of the yeast Pfk1 in the R-state, we observe that those located in the top tetramer make similar contacts as in their E. coli counterpart, while in the bottom tetramer, the interactions close to the F6P binding sites have weakened, thus not making catalysis a favorable event (Fig. 4). In the T-state, the catalytic surface interactions have changed; the top tetramer exhibiting similar weak interactions between the small and large subdomains (shown by * in figures) of the α- and β-subunits, while the subunits of the bottom tetramer interact mainly through the small subdomains (Fig. 4). In the latter case the F6P binding sites might have moved too far for the F6P molecules to interact with the ATP-γ-phosphates, thus impeding catalysis and giving rise to the inhibited state. The effector site in the E. coli Pfk1 is not located in the catalytic surface but in the intersubunit surface within a dimer. In the baker’s yeast Pfk1, this corresponds to the surface created by the interaction between the C- and N-terminal regions of the same subunit (α or β). The binding of ATP to the effector site can disrupt or modify the interactions between the two domains of the subunits, allowing the C-terminal of the β-subunit to extend outward from the molecule, and the C-terminal of the α-subunit to adopt a different conformation, which results in the change in the angle between the tetramers observed in the electron microscopy 3D reconstructions (Fig. 4).
Our earlier study revealed the structure of a eukaryotic phosphofructokinase in the active R-state. Here we present the conformational changes that occur when the enzyme assumes the inhibited T-state. While the structures of the intermediate states are the topic of further research, the knowledge of the conformation of the eukaryotic Pfk1 in the two major states is a large step forward in the understanding of the catalytic function and regulation of this complicated enzyme.
Supplementary Material
Supplemental figure 1. Angular coverage of the projection space. The azimuthal coordinate corresponds to the rotation of the molecule around its long axis, the radial coordinate to the cosine of the tilt angle around a space fixed axis parallel to the short axis of the molecule. The plot shows that all projecting directions are well covered. Especially the good coverage at the periphery of the circle shows that the majority of the projections combine to a fully occupied single axis tilt series.
Acknowledgments
We would like to thank Todd Clason, Shaun Benjamin, Jürgen Kirchberger and Anke Edelmann for interesting discussions and critical reading of the manuscript. This work was supported by NIH R01 grant GM069551 (to T.R.) and a Fulbright Postdoctoral Fellowship (to M.B.); and has benefited from image analysis developments supported by NIH R01 grant GM068650 (to M.R.)
Footnotes
Publisher's Disclaimer: This is a PDF file of an unedited manuscript that has been accepted for publication. As a service to our customers we are providing this early version of the manuscript. The manuscript will undergo copyediting, typesetting, and review of the resulting proof before it is published in its final citable form. Please note that during the production process errors may be discovered which could affect the content, and all legal disclaimers that apply to the journal pertain.
Contributor Information
Montserrat Bárcena, University of Vermont, College of Medicine. Dept. of Molecular Physiology and Biophysics, Burlington, VT 05405. USA.
Michael Radermacher, University of Vermont, College of Medicine. Dept. of Molecular Physiology and Biophysics, Burlington, VT 05405. USA.
Jörg Bär, Institut für Biochemie, Medizinische Facultät, Universität Leipzig, Johannisallee 30, D-04103 Leipzig, Germany.
Gerhard Kopperschläger, Institut für Biochemie, Medizinische Facultät, Universität Leipzig, Johannisallee 30, D-04103 Leipzig, Germany.
Teresa Ruiz, University of Vermont, College of Medicine. Dept. of Molecular Physiology and Biophysics, Burlington, VT 05405. USA.
References
- Blangy D. Phosphofructokinase from E. coli: Evidence for a tetrameric structure of the enzyme. FEBS Letters. 1968;2:109–111. doi: 10.1016/0014-5793(68)80115-2. [DOI] [PubMed] [Google Scholar]
- Evans PR. Regulation of proteins by ligands. Houston; Texas: 1992. Activity and allosteric regulation in bacterial phosphofructokinase; pp. 39–54. [Google Scholar]
- Evans PR, Farrants GW, Lawrence MC. Crystallographic structure of allosterically inhibited phosphofructokinase at 7 A resolution. Journal of Molecular Biology. 1986;191:713–20. doi: 10.1016/0022-2836(86)90455-9. [DOI] [PubMed] [Google Scholar]
- Evans PR, Hudson PJ. Structure and control of phosphofructokinase from Bacillus stearothermophilus. Nature. 1979;279:500–4. doi: 10.1038/279500a0. [DOI] [PubMed] [Google Scholar]
- Frank J, Radermacher M, Penczek P, Zhu J, Li Y, Ladjadj M, Leith A. SPIDER and WEB: processing and visualization of images in 3D electron microscopy and related fields. Journal of Structural Biology. 1996;116:190–9. doi: 10.1006/jsbi.1996.0030. [DOI] [PubMed] [Google Scholar]
- Heinisch J. Isolation and characterization of the two structural genes coding for phosphofructokinase in yeast. Molecular & General Genetics. 1986;202:75–82. doi: 10.1007/BF00330520. [DOI] [PubMed] [Google Scholar]
- Kessler R, Nissler K, Schellenberger W, Hofmann E. Fructose-2,6-bisphosphate increases the binding affinity of yeast phosphofructokinase to AMP. Biochemical & Biophysical Research Communications. 1982;107:506–10. doi: 10.1016/0006-291x(82)91520-0. [DOI] [PubMed] [Google Scholar]
- Kopperschläger G, Bär J, Nissler K, Hofmann E. Physicochemical parameters and subunit composition of yeast phosphofructokinase. European Journal of Biochemistry. 1977;81:317–25. doi: 10.1111/j.1432-1033.1977.tb11954.x. [DOI] [PubMed] [Google Scholar]
- Kopperschläger G, Bär J, Stellwagen E. Limited proteolysis of yeast phosphofructokinase. Sequence locations of cleavage sites created by the actions of different proteinases. European Journal of Biochemistry. 1993;217:527–33. doi: 10.1111/j.1432-1033.1993.tb18273.x. [DOI] [PubMed] [Google Scholar]
- Laurent M, Chaffotte AF, Tenu JP, Roucous C, Seydoux FJ. Binding of nucleotides AMP and ATP to yeast phosphofructokinase:evidence for distinct catalytic and regulatory subunits. Biochemical & Biophysical Research Communications. 1978;80:646–52. doi: 10.1016/0006-291x(78)91617-0. [DOI] [PubMed] [Google Scholar]
- Laurent M, Seydoux FJ, Dessen P. Allosteric regulation of yeast phosphofructokinase. Correlation between equilibrium binding, spectroscopic and kinetic data. Journal of Biological Chemistry. 1979;254:7515–20. [PubMed] [Google Scholar]
- Laurent M, Tijane MN, Roucous C, Seydoux FJ, Tardieu A. Solution X-ray scattering studies of the yeast phosphofructokinase allosteric transition. Characterization of an ATP-induced conformation distinct in quaternary structure from the R and T states of the enzyme. Journal of Biological Chemistry. 1984;259:3124–6. [PubMed] [Google Scholar]
- Mechin I. PhD Thesis. Dept. Biochemistry, Leipzig University; 2002. Crystal Structure of Fructose-6-Phosphate Liganded R-State 6-Phosphofructo-1-Kinase from Saccharomyces cerevisiae at 2.9 Å Resolution. [Google Scholar]
- Mechin I, Kopperschlager G, Rypniewski WR. Crystal structure of yeast phosphofructokinase. Acta Crystallographica A. 2002;58(Supplement):C107. [Google Scholar]
- Nissler K, Kessler R, Schellenberger W, Hofmann E. Binding of fructose-6-phosphate to phosphofructokinase from yeast. Biochemical & Biophysical Research Communications. 1977a;79:973–8. doi: 10.1016/0006-291x(77)91205-0. [DOI] [PubMed] [Google Scholar]
- Nissler K, Schellenberger W, Hofmann E. Binding of MgATP to yeast phosphofructokinase. Acta Biologica et Medica Germanica. 1977b;36:1027–33. [PubMed] [Google Scholar]
- Pettersen EF, Goddard TD, Huang CC, Couch GS, Greenblatt DM, Meng EC, Ferrin TE. UCSF Chimera - A Visualization System for Exploratory Research and Analysis. Journal of Computational Chemistry. 2004;25:1605–1612. doi: 10.1002/jcc.20084. [DOI] [PubMed] [Google Scholar]
- Plietz P, Damaschun G, Kopperschläger G, Müller JJ. Small-angle x-ray scattering studies on the quaternary structure of phosphofructokinase from baker’s yeast. FEBS Letters. 1978;91:230–2. doi: 10.1016/0014-5793(78)81179-x. [DOI] [PubMed] [Google Scholar]
- Poorman RA, Randolph A, Kemp RG, Heinrikson RL. Evolution of phosphofructokinase--gene duplication and creation of new effector sites. Nature. 1984;309:467–9. doi: 10.1038/309467a0. [DOI] [PubMed] [Google Scholar]
- Radermacher M. Three-dimensional reconstruction from random projections: orientational alignment via Radon transforms. Ultramicroscopy. 1994;53:121–36. doi: 10.1016/0304-3991(94)90003-5. [DOI] [PubMed] [Google Scholar]
- Radermacher M. Radon transform techniques for alignment and 3D reconstruction from random projections. Scanning Microscopy. 1997;11:171–177. [Google Scholar]
- Radermacher M. Appendix: Simultaneous Rotational and Translational Alignment. Journal of Structural Biology. 2001;135:35–37. [Google Scholar]
- Radermacher M, Ruiz T. Three-dimensional reconstruction of single particles in electron microscopy image processing. Methods Mol Biol. 2006;319:427–61. doi: 10.1007/978-1-59259-993-6_20. [DOI] [PubMed] [Google Scholar]
- Radermacher M, Ruiz T, Clason T, Benjamin S, Brandt U, Zickermann V. The three-dimensional structure of complex I from Yarrowia lipolytica: a highly dynamic enzyme. J Struct Biol. 2006;154:269–79. doi: 10.1016/j.jsb.2006.02.011. [DOI] [PMC free article] [PubMed] [Google Scholar]
- Radermacher M, Ruiz T, Wieczorek H, Grüber G. The structure of the V1-ATPase determined by Three-Dimensional Electron Microscopy of single particles. Journal of structural biology. 2001;135:26–37. doi: 10.1006/jsbi.2001.4395. [DOI] [PubMed] [Google Scholar]
- Reuter R, Eschrich K, Schellenberger W, Hofmann E. Kinetic modelling of yeast phosphofructokinase. Acta Biologica et Medica Germanica. 1979;38:1067–79. [PubMed] [Google Scholar]
- Rosenthal PB, Henderson R. Optimal determination of particle orientation, absolute hand, and contrast loss in single-particle electron cryomicroscopy. J Mol Biol. 2003;333:721–45. doi: 10.1016/j.jmb.2003.07.013. [DOI] [PubMed] [Google Scholar]
- Ruiz T, Kopperschläger G, Radermacher M. The first three-dimensional structure of phosphofructokinase from Saccharomyces cerevisiae determined by electron microscopy of single particles. Journal of Structural Biology. 2001;136:167–80. doi: 10.1006/jsbi.2002.4440. [DOI] [PubMed] [Google Scholar]
- Ruiz T, Mechin I, Bär J, Rypniewski W, Kopperschläger G, Radermacher M. The 10.8̊ structure of Saccharomyces cerevisiae phosphofructokinase determined by cryoelectron microscopy: localization of the putative fructose 6-phosphate binding sites. J Struct Biol. 2003;143:124–34. doi: 10.1016/s1047-8477(03)00140-0. [DOI] [PubMed] [Google Scholar]
- Ruiz T, Radermacher M. Three-dimensional analysis of single particles by electron microscopy: sample preparation and data acquisition. Methods Mol Biol. 2006;319:403–25. doi: 10.1007/978-1-59259-993-6_19. [DOI] [PubMed] [Google Scholar]
- Rypniewski WR, Evans PR. Crystal structure of unliganded phosphofructokinase from Escherichia coli. Journal of Molecular Biology. 1989;207:805–21. doi: 10.1016/0022-2836(89)90246-5. [DOI] [PubMed] [Google Scholar]
- Saxton WO, Baumeister W. The correlation averaging of a regularly arranged bacterial cell envelope protein. Journal of Microscopy. 1982;127:127–138. doi: 10.1111/j.1365-2818.1982.tb00405.x. [DOI] [PubMed] [Google Scholar]
- Shirakihara Y, Evans PR. Crystal structure of the complex of phosphofructokinase from Escherichia coli with its reaction products. Journal of Molecular Biology. 1988;204:973–94. doi: 10.1016/0022-2836(88)90056-3. [DOI] [PubMed] [Google Scholar]
- Sols A. Multimodulation of enzyme activity. Current Topics in Cellular Regulation. 1981;19:77–101. doi: 10.1016/b978-0-12-152819-5.50020-8. [DOI] [PubMed] [Google Scholar]
- Taucher M, Kopperschläger G, Hofmann E. Limited proteolysis of yeast phosphofructokinase by subtilisin. Alterations in enzyme activity, subunit composition, and hydrodynamic properties. European Journal of Biochemistry. 1975;59:319–25. doi: 10.1111/j.1432-1033.1975.tb02458.x. [DOI] [PubMed] [Google Scholar]
- Tijane MN, Seydoux FJ, Hill M, Roucous C, Laurent M. Octameric structure of yeast phosphofructokinase as determined by crosslinking with disuccinimidyl beta-hydromuconate. FEBS Letters. 1979;105:249–53. doi: 10.1016/0014-5793(79)80622-5. [DOI] [PubMed] [Google Scholar]
- van Heel M, Keegstra W, Schutter W, Bruggen EJFv. Arthropod hemocyanin structures studied by image analysis. In: J WE, editor. Life Chemistry Reports, Suppl. 1, The structure and Function of Invertebrate Respiratory Proteins. Embo Workshop; 1982. pp. 69–73. [Google Scholar]
- Verschoor A, Frank J, Radermacher M, Wagenknecht T, Boublik M. Three-dimensional reconstruction of the 30 S ribosomal subunit from randomly oriented particles. J Mol Biol. 1984;178:677–98. doi: 10.1016/0022-2836(84)90245-6. [DOI] [PubMed] [Google Scholar]
Associated Data
This section collects any data citations, data availability statements, or supplementary materials included in this article.
Supplementary Materials
Supplemental figure 1. Angular coverage of the projection space. The azimuthal coordinate corresponds to the rotation of the molecule around its long axis, the radial coordinate to the cosine of the tilt angle around a space fixed axis parallel to the short axis of the molecule. The plot shows that all projecting directions are well covered. Especially the good coverage at the periphery of the circle shows that the majority of the projections combine to a fully occupied single axis tilt series.