

Abstract
Cilia-generated fluid flow in an ‘organ of asymmetry’ is critical for establishing the left–right body axis in several vertebrate embryos. However, the cell biology underlying how motile cilia produce coordinated flow and asymmetric signals is not well defined. In the zebrafish organ of asymmetry—called Kupffer’s vesicle (KV)—ciliated cells are asymmetrically positioned along the anterior–posterior axis such that more cilia are placed in the anterior region. We previously demonstrated that Rho kinase 2b (Rock2b) is required for anteroposterior asymmetry and fluid flow in KV, but it remained unclear how the distribution of ciliated cells becomes asymmetric during KV development. Here, we identify a morphogenetic process we refer to as ‘KV remodeling’ that transforms initial symmetry in KV architecture into anteroposterior asymmetry. Live imaging of KV cells revealed region-specific cell shape changes that mediate tight packing of ciliated cells into the anterior pole. Mathematical modeling indicated that different interfacial tensions in anterior and posterior KV cells are involved in KV remodeling. Interfering with non-muscle myosin II (referred to as Myosin II) activity, which modulates cellular interfacial tensions and is regulated by Rock proteins, disrupted KV cell shape changes and the anteroposterior distribution of KV cilia. Similar defects were observed in Rock2b depleted embryos. Furthermore, inhibiting Myosin II at specific stages of KV development perturbed asymmetric flow and left–right asymmetry. These results indicate that regional cell shape changes control the development of anteroposterior asymmetry in KV, which is necessary to generate coordinated asymmetric fluid flow and left–right patterning of the embryo.
Keywords: Left–right asymmetry, Kupffer’s vesicle, Cilia, Myosin II, Cell shape changes, Zebrafish
Introduction
Embryonic development depends on proper alignment of the dorsal–ventral (DV), anterior–posterior (AP) and left–right (LR) body axes. Failure to orient the LR axis can cause a broad spectrum of congenital syndromes, often involving cardiac malformations (Kathiriya and Srivastava, 2000; Ramsdell, 2005; Sutherland and Ware, 2009). Monociliated epithelial cells in the mouse ventral node produce an asymmetric fluid flow that is critical for LR specification (Nonaka et al., 1998). Asymmetric flow directs asymmetric expression of a Nodal signaling cascade in left lateral plate mesoderm (LMP) to influence laterality of visceral organs (Shiratori and Hamada, 2006). An analogous ciliated epithelial structure, which we refer to as the ‘organ of asymmetry’, has been described in frog, rabbit, medaka and zebrafish embryos (Essner et al., 2005; Kramer-Zucker et al., 2005; Okada et al., 2005; Schweickert et al., 2007), suggesting cilia-generated flow plays a conserved role in embryonic axis alignment. However, mechanisms involved in the formation of the organ of asymmetry are not well understood.
The zebrafish organ of asymmetry, called Kupffer’s vesicle (KV) (Essner et al., 2005; Kramer-Zucker et al., 2005), provides a good model to study morphogenesis of the ciliated epithelium that creates asymmetric flow. KV forms from precursors called dorsal forerunner cells (Cooper and D’Amico, 1996; Melby et al., 1996) that become polarized epithelial cells and form a rosette-like structure at 1–2 somite stage (Amack et al., 2007; Oteiza et al., 2008). The fluid-filled KV lumen then expands and a single motile cilium elongates from the apical surface of each cell protruding into the lumen. KV cilia beat in a coordinated fashion to generate a directional fluid flow that is necessary to bias left-sided expression the Nodal-related gene southpaw (spaw) in LPM (Essner et al., 2005; Kramer-Zucker et al., 2005) at 10–12 SS (Long et al., 2003). In zebrafish, frog and mouse embryos, planar cell polarity (PCP) signaling controls posterior cilium positioning that is necessary to generate asymmetric flow (Antic et al., 2010; Borovina et al., 2010; Hashimoto et al., 2010; Okada et al., 2005; Song et al., 2010). In addition, the distribution of cilia in zebrafish KV is asymmetric along the AP axis (Kreiling et al., 2007; Okabe et al., 2008; Wang et al., 2011). More ciliated cells are located in the anterior region, correlating with strong leftward flow in the anterior pole and weaker rightward flow at the posterior end (Kramer-Zucker et al., 2005; Kreiling et al., 2007; Okabe et al., 2008; Wang et al., 2011). Previously, we identified the Rho kinase (Rock) protein Rock2b as a regulator of this AP asymmetric cellular architecture of KV (Wang et al., 2011). Depletion of Rock2b disrupted the asymmetric distribution of KV ciliated cells, altered KV cell morphology and eliminated asymmetric flow. While these results provided the first evidence that the AP positioning of ciliated cells in KV plays an important role in orienting the LR axis, the mechanisms involved in establishing AP asymmetry during KV development remained unclear.
In this study, we investigated how ciliated cells become asymmetrically distributed along the AP axis in KV. Live imaging revealed regional cell shape changes during KV morphogenesis that remodel an initially symmetric KV into an AP asymmetric organ. During remodeling, KV cells in the anterior region develop elongated columnar morphologies to mediate tight packing of ciliated cells. Results from mathematical simulations of KV development and experimental perturbations of Myosin II activity in KV indicate these regional cell shape changes control KV architecture, generation of coordinated asymmetric flow and orientation of the LR body axis.
Materials and methods
Zebrafish
Wild-type AB and transgenic Tg(sox17:GFP) (Sakaguchi et al., 2006) zebrafish (Danio rerio) were obtained from the Zebrafish International Resource Center (ZIRC). The Tg(dusp6:memGFP)pt19 transgenic strain has been previously described (Wang et al., 2011) and was generated by Michael Tsang’s group (University of Pittsburgh). Embryos were collected and cultured as described (Westerfield, 1995) and staged according to (Kimmel et al., 1995).
Fluorescent immunohistochemistry
For whole-mount fluorescent immunostaining, embryos were fixed in Dents (80% methanol, 20% dimethylsulfoxide) (Myosin II antibody) or in 4% paraformaldehyde (other antibodies) overnight at 4 degrees and then processed as previously described by (Gao et al). Primary antibodies included mouse anti-acetylated Tubulin (1:400, Sigma), mouse anti-ZO1 (1:200, Invitrogen), rabbit anti-aPKC (1:200, Santa Cruz), rabbit anti-Myosin II (1:500, Sigma), rabbit anti-pMLC (1:100, Cell Signaling), rabbit anti-α-GPF (1:200, Molecular Probes), and rabbit anti-phospho-Histone H3 (1:200, Santa Cruz). For visualizing F-actin, phalloidin labeled with Alexa Fluor 488 or rhodamine (1:200, Invitrogen) was added with the secondary antibodies. Terminal deoxynucleotidyl transferase dUTP nick end labeling (TUNEL) staining (Roche In Situ Cell Death Detection Kit, Fluorescein) was used to detect apoptotic cells during KV development. Whole embryos were mounted in 1% low melting agarose and imaged using a 63 × water-dipping objective on a Zeiss Axio Imager M1 microscope, or samples were mounted on MatTek dish (MatTek Corp.) and visualized using a 40 × objective on a Perkin-Elmer UltraVIEW Vox spinning disk confocal microscope. KV cilia number, length and AP distribution was analyzed using Z-projections of the entire KV generated using ImageJ software (NIH). KV was bisected into anterior and posterior regions by first drawing a line extending from the notochord and then drawing a second line was drawn perpendicular to the first line at the midpoint to along the AP axis. For statistical analyses, P values were calculated using the Student’s t-test.
Live imaging and analysis of cell shapes
Live Tg(dusp6:memGFP) embryos were dechorionated and immobilized in 1% low melting agarose in a MatTek dish. GFP+ KV cells were imaged using a Perkin-Elmer UltraVIEW Vox spinning disk confocal microscope and Volocity software. For time-lapse experiments, images were taken every 2 min. For cell shape analysis, the length-to-width ratio (LWR) was calculated for KV cells at the mid-focal plane (the plane with the largest KV lumen diameter). Total cell length and cell apical width were measured using ImageJ software. To determine the length we drew and measured a line between the midpoint of the apical surface and the furthest basal surface, and the apical width was determined as the longest line along the apical surface. Similar to analysis of cilia position, KV was bisected into anterior and posterior regions by first drawing a line extending from the notochord and then drawing a second line was drawn perpendicular to the first line at the midpoint to along the AP axis. All cells in the anterior and posterior regions were analyzed, except cells bisected by the line were not included. P values were calculated using the Student’s t-test.
Mechanical modeling of KV development
See supplemental text for description of the mechanical model.
Embryo injections
To overexpress Mypt1, we obtained full-length pCR-BluntII-Topo-mypt1 from Open Biosystems and transferred the mypt1 cDNA insert into a pCS2 vector. The mMessage mMachine kit (Ambion) was used to synthesize capped mRNA from the pCS2-mypt1 plasmid. 200 pg of mRNA was injected into embryos at 1-cell stage. To knockdown Rock2b, a previously characterized rock2b RNA splice-blocking MO (5′-GCACACACTCACTCACCAGCTGCAC-3′) (Wang et al., 2011) and a standard negative control MO (5′-CCTCTTACCTCAGTTACAATTTATA-3′) were obtained from Gene Tools, LLC. Embryos were injected between the 1 to 4-cell stages with 0.4 ng rock2b MO or 4.4 ng control MO.
Blebbistatin treatment
(−/−) Blebbistatin (Sigma) was dissolved in DMSO and diluted to a working concentration of 35 μM in embryo water. For analyses of KV cell shape changes and fluid flow, embryos were soaked in blebbistatin or 1% DMSO (controls) from 1 SS to 8 SS. To remove the drug embryos were washed 3 times using embryos water. For brief treatments (Fig. 6D) the treatment time is indicated.
Fig. 6.
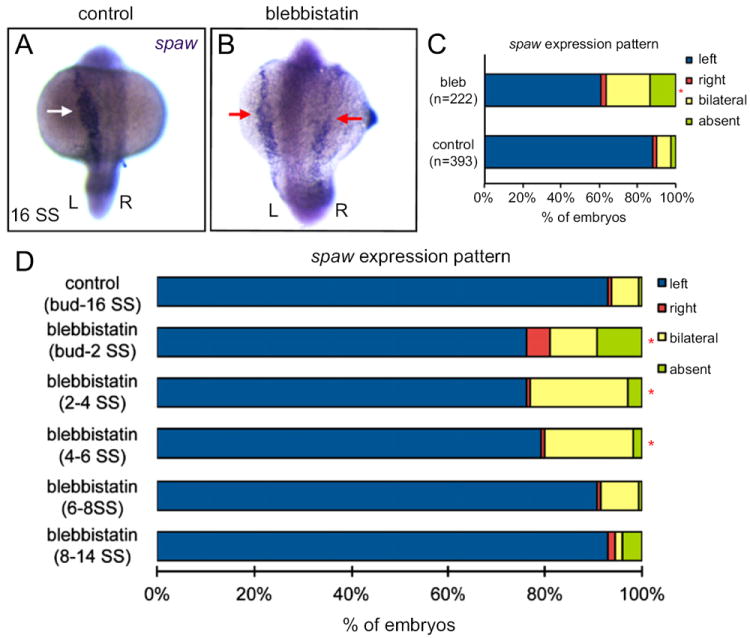
Blebbistatin treatment during early KV development stages disrupts LR patterning. (A and B) RNA in situ hybridizations show normal left-sided spaw expression (arrows) at 16 SS in a control embryo treated with DMSO (A) and bilaterally symmetric spaw expression in a blebbistatin treated embryo (B). (C) spaw expression was significantly altered in embryos treated with blebbistatin between 1–8 SS relative to DMSO controls. (D) Anlaysis of spaw expression in DMSO controls and embryos treated with blebbistatin during the stages indicated. n>100 embryos for all treatments. *Significantly different from controls (p<0.05).
RNA in situ hybridization
Antisense RNA probes were labeled with digoxygenenin (Roche DIG RNA labeling kit) to detect spaw expression via RNA in situ hybridization as described (Yu et al., 2011).
Fluid flow and cilia motility in KV
Beating cilia and fluid flow inside KV was imaged and analyzed as described (Wang et al., 2011). Movement of fluorescent beads (Polysciences, Inc.) injected into KV was first recorded at 4 SS. Individual embryos were then incubated until 8 SS, when fluid flow was imaged for a second time. Axiovision (Zeiss) software was used to generate movies and track individual beads.
Results
Remodeling of Kupffer’s vesicle establishes an AP asymmetric distribution of cilia
To characterize the development of AP asymmetry in KV, fluorescent immunostaining with anti-acetylated tubulin antibodies was used to visualize KV cilia in wild-type embryos at several developmental time points. During early stages of KV morphogenesis, including the 2 somite stage (SS) and 4 SS, cilia were symmetrically distributed between the anterior and posterior regions of KV (Fig. 1A, B, and E). However, at 6 SS the cilia distribution was asymmetric, with significantly more cilia positioned in the anterior region (Fig. 1C and E), which is consistent with previous reports of KV cilia analyzed at this stage (Kreiling et al., 2007; Okabe et al., 2008; Wang et al., 2011). We refer to this transition from symmetry to AP asymmetry between 4–6 SS as ‘KV remodeling’. AP asymmetry in KV was maintained through 12 SS (Fig. 1D and E).
Fig. 1.
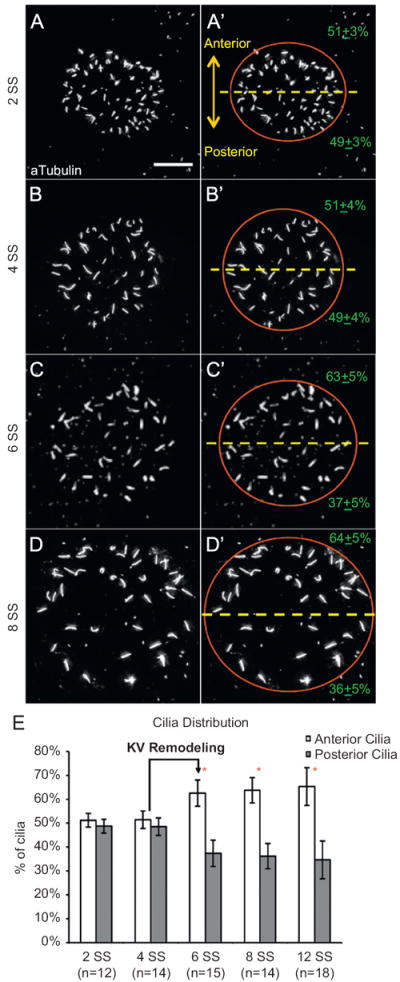
Distribution of motile cilia becomes asymmetric along the anterior–posterior (AP) axis during Kupffer’s vesicle development. (A–D) Immunostaining of cilia in Kupffer’s vesicle (KV) with acetylated Tubulin antibodies at different somite stages (SS). (A′–D′) Red circle approximates the KV lumen boundary. The dashed yellow line bisects KV into anterior and posterior regions. All images are oriented with anterior at the top and posterior at the bottom. KV cilia were equally distributed between the anterior and posterior regions at 2 SS (A, A′) and 4 SS (B, B′). In contrast, However at 6 SS (C, C′) and 8 SS (D, D′), cilia were asymmetrically distributed. The average cilia distribution is presented±one standard deviation (in green). Scale bar=10 μm. (E) The percentage of cilia in anterior and posterior regions of KV at different stages of development. Error bars=one standard deviation. n=number of embryos analyzed. *Significant difference between anterior and posterior (p<0.0001).
The process of KV remodeling could include the addition or subtraction of ciliated KV cells and/or cellular rearrangements that pack more cells into the anterior pole. Consistent with previous results (Oteiza et al., 2008), we found considerable variability in the number of KV cilia in wild-type embryos, but did not observe statistically significant changes in the average number of cilia during KV development (Fig. S1A). In addition, we did not detect proliferating KV cells using phospho-Histone H3 antibody staining or apoptotic KV cells by TUNEL staining during KV remodeling stages (Fig. S1B). These results suggested KV remodeling involves the rearrangement of cells during KV morphogenesis.
Live imaging reveals regional cell shape changes during KV development
To observe the behavior of KV cells during remodeling we performed live time-lapse imaging of Tg(dusp6:memGFP) embryos that express plasma membrane-localized GFP in KV cells (Wang et al., 2011). Imaging the middle focal plane of KV in wild-type embryos from 2 SS to 8 SS showed dynamic KV cells that moved towards the posterior end of the embryo (Movie S1). As the lumen expanded, KV cells underwent shape changes that appeared different in the anterior and posterior regions of KV (Movie S1).
Supplementary material related to this article can be found online at http://dx.doi.org/10.1016/j.ydbio.2012.07.019.
KV cell shape changes were further characterized by imaging KV in live Tg(dusp6:memGFP) embryos at specific stages of development. Cell morphology was described by measuring apical width and total length to calculate a length-to-width ratio (LWR) as previously reported (Wang et al., 2011). Optical cross-sections through the middle of KV showed that cells in the anterior and posterior halves of KV had similar columnar-like morphologies and LWRs at 2 SS (Fig. 2A and E). At 4 SS (Fig. 2B and E) and 6 SS (Fig. 2C and E), anterior cells appeared elongated, whereas cells in the posterior pole showed increased apical surfaces and reduced length. The LWRs became significantly different between anterior and posterior cells at 6 SS (Fig. 2E). At 8 SS (Fig. 2D and E), anterior cells showed elongated columnar shapes, while posterior cells were more cuboidal. These analyses show KV cells undergo region-specific shape changes that transform an initially symmetric cellular architecture into an organ with striking morphological differences along the AP axis. Together with our analysis of cilia distribution (Fig. 1), these results suggest KV remodeling is mediated by cell shape changes that facilitate tight packing of more ciliated cells into the anterior region to establish an AP asymmetric cilia distribution.
Fig. 2.
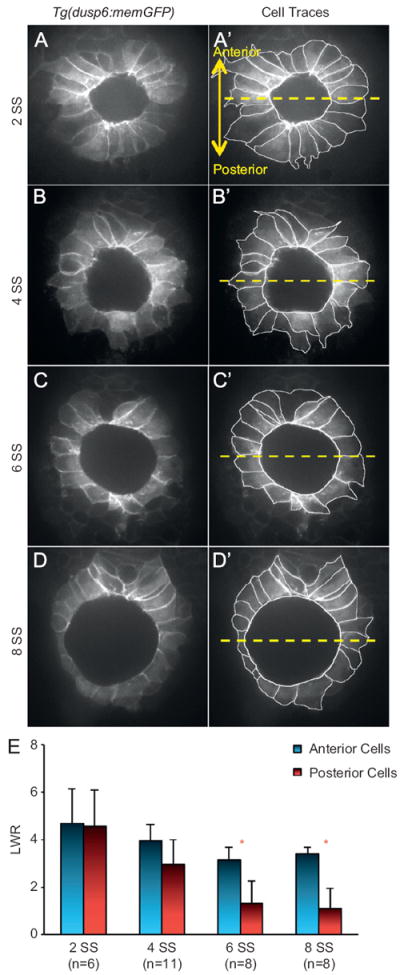
Ciliated KV cells undergo region-specific cell shape changes during morphogenesis. (A–D) Optical cross-sections through the middle focal plane of KV cells expressing membrane-localized GFP in wild-type Tg(dusp6:memGFP) embryos at different stages of development. (A′–D′) KV cell boundaries were outlined to highlight cell shapes. The dashed yellow line bisects KV into anterior and posterior regions. All images are oriented with anterior at the top and posterior at the bottom. (E) Length-to-width ratio (LWR) of anterior and posterior cells at different stages of development. Error bars=one standard deviation. n=number of embryos analyzed. * Significant difference between anterior and posterior (p<0.01).
Mathematical modeling of KV cell shape changes
To investigate potential mechanisms involved in regional KV cell shape changes, we developed a simple mechanical model of KV remodeling. Our model, which is similar to those used to predict surface tension in early embryonic zebrafish explants (Manning et al., 2010), Drosophila imaginal disks (Hilgenfeldt et al., 2008) and Drosophila retinas (Hilgenfeldt et al., 2008; Kafer et al., 2007), makes predictions for cell morphologies in tissues based on a small number of mechanical parameters. One important parameter is the “interfacial energy” that acts along cell edges. This energy increases as active cortical tension increases (Brodland, 2004; Evans and Yeung, 1989; Tinevez et al., 2009) and decreases as the number of adhesive molecules per unit area increases (Foty and Steinberg, 2005; Graner, 1993). Another parameter is the cell area. While previous models have assumed that cell areas remain constant or experience an elastic restoring force, it is clear from the confocal imaging data (Fig. 2) that cross-sectional areas of the lumen and KV cells change significantly between 2 SS to 8 SS. Therefore, we used experimental data to constrain cell and lumen areas, as well as the topology of KV cells (i.e. which cell neighbors which cell), as they change with time. Thus, the only free model parameters were the interfacial tensions.
We hypothesize that the regional KV cell shape changes we observed in wild-type embryos—lengthening of the anterior cells along the apical-basal axis and widening of posterior cells along the lateral axis—could be generated by differences in tensions along lateral interfaces between KV cells. To test this, we assigned different values to the lateral tensions of anterior (TA) and posterior (TP) KV cells and used the program Surface Evolver (Brakke, 1992) to find the mechanically stable states of cell structures based on our model. Snapshots (Fig. 3A–C) from a simulation (Movie S2) illustrate the evolution of cell shapes in KV as the lumen grows and the interfacial tensions change; the color indicates the magnitude of the tension on each interface. For these particular values of TA=0.25 and TP=3, Fig. 3D shows the evolution of the average anterior and posterior LWR. The final anterior LWR is significantly larger than the posterior LWR, by a factor of approximately three. This predicted ratio (Fig. 3D) and the KV cell morphologies (Fig. 3C) are quite similar to what we observed in wild-type embryos (Fig. 2D and E). To investigate the robustness of this model, we varied TA and TP over a range of values and calculated the final value for the ratio between anterior and posterior LWR, denoted by color in Fig. 3E. The first observation is that there is a range of values for TP and TA, denoted by a white solid contour in Fig. 3E, where the LWRs are identical to that observed in KV to within experimental error. This region corresponds to structures where lateral interfacial tensions in anterior cells are down regulated and/or the lateral tensions in posterior cells are up regulated. We also studied individual cell shapes (see supplemental text), and found that cells in regions where TA is significantly lower and TP is only moderately higher (denoted by black horizontal lines in Fig. 3E) match experimentally observed shapes more closely than those where TP is significantly higher. In contrast, if the anterior and posterior lateral tensions are not significantly different from one another, the model predicts LWRs that are similar to one another such that the cells do not change in morphology (Fig. S2 and Movie S3). Thus, modulating interfacial tensions between KV cells in our mathematical model recapitulates our in vivo observations of cell shape changes during KV morphogenesis.
Fig. 3.
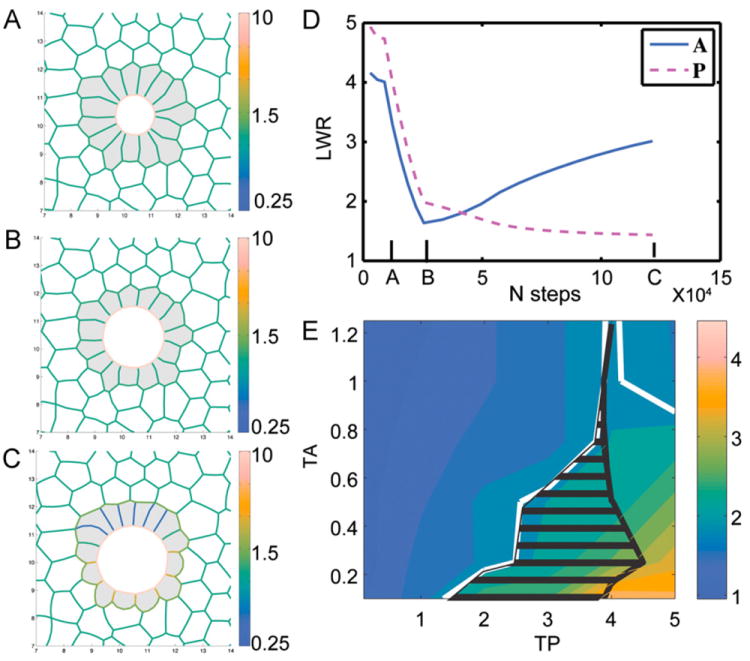
Mechanical model of KV remodeling. (A–C) Snapshots from a simulation of KV development (see Movie S2). KV cells are shaded gray and the color range indicates magnitude of interfacial tension between KV cells. (A) Initial mechanically stable structure, (B) stable structure with equal tension everywhere, area of lumen increased by factor of 3, and area of KV cells decreased by 25%, (C) stable structure with TA=0.25 and TP=3. For these parameters, final cell shapes and LWRs were very similar to those seen in normal KV development at 8 SS. (D) Evolution of average anterior LWR (blue) and posterior LWR (magenta) with the number of simulation steps. (E) Phase diagram of final anterior LWR/posterior LWR as a function of model parameters TA and TP. Solid white line indicates a contour at 2 (ratios above 2 are consistent with experimental observations) and black hatch marks indicate the region where cell shapes also match experimental observations (see Supplemental Text and Fig. S6).
Supplementary material related to this article can be found online at http://dx.doi.org/10.1016/j.ydbio.2012.07.019.
Interfering with non-muscle myosin II activity disrupts KV cell shape changes
To test the prediction that interfacial tension is involved in KV remodeling in vivo, we wanted to disrupt tension during KV development. We chose to down-regulate Myosin II activity, which controls cellular interfacial tensions by regulating cell contractility and cell adhesion via cadherin clustering (Shewan et al., 2005; Smutny et al., 2010). In addition, Myosin II activity is regulated by Rho kinases (Cole and Welsh, 2011; Tan et al., 1992), providing a potential link to Rock2b. Using anti-Myosin II antibodies, we observed Myosin II staining in KV cells at 4 SS and 8 SS (Fig. S3A and B). To test the function of Myosin II activity in KV, embryos were injected with synthetic mRNA encoding Mypt1 (also called Ppp1r12a), a regulatory subunit of myosin phosphatase that dephosphorylates (inactivates) MLC (Ito et al., 2004)(Fig. S3C). Previous studies have shown that zebrafish Mypt1 regulates cell movements and cell shapes and is inhibited by Rho/Rock-mediated phosphorylation (Gutzman and Sive, 2010; Huang et al., 2008; Weiser et al., 2009). Fluorescent immunostaining with antibodies that recognize phosphorylated myosin light chain (pMLC) revealed a reduction of pMLC at KV cell membranes in mypt1 mRNA injected embryos (Fig. S3H–K) relative to controls (Fig. S3D–G). When mypt1 mRNA was injected into Tg(dusp6:memGFP) embryos, live imaging revealed that although the KV organ formed, KV cells failed to undergo typical cell shape changes during morphogenesis. In contrast to the regional KV cell shape changes that occurred between 2–8 SS in control embryos (Fig. 4A–C), anterior and posterior KV cells in mypt1 mRNA injected embryos showed similar morphologies and LWRs at 8 SS (Fig. 4D–F). These in vivo results were similar to modeling simulations in which AP tensions were not significantly different (Fig. S2 and Movie S3) and suggested that reducing Myosin II activity disrupts KV remodeling.
Fig. 4.
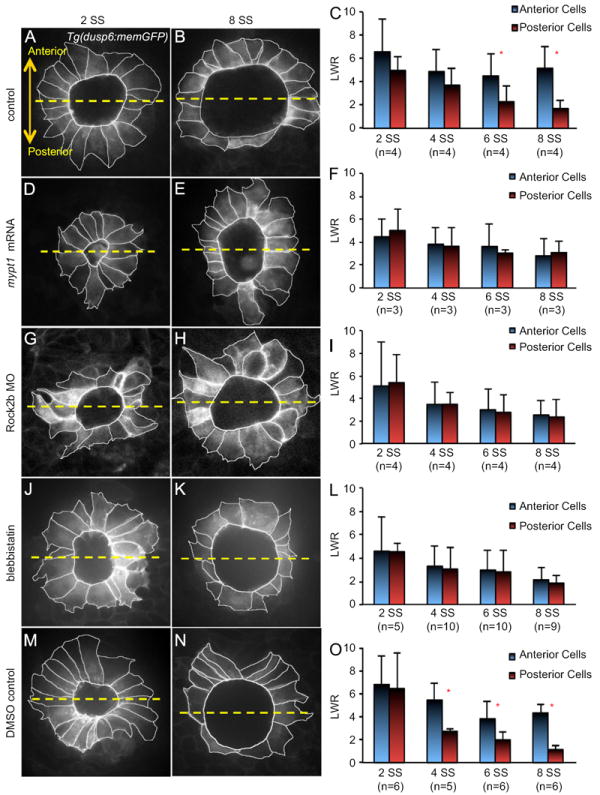
Interfering with Myosin II Activity via Mypt1 over-expression, Rock2b knockdown or blebbistatin treatment disrupts KV cell shape changes. (A, B, D, E, G, H, J, K, M and N) Images of outlined KV cells in Tg(dusp6:memGFP) embryos at 2 SS (A, D, G, J, and M) or 8 SS (B, E, H, K and N) treated with control MO (A and B), mypt1 mRNA (D and E) Rock2b MO (G and H), blebbistatin (J and K) or DMSO (M and N). The dashed yellow line bisects KV into anterior and posterior regions. Images are oriented with anterior at the top and posterior at the bottom. (C, F, I, L and O) Average length-to-width ratios (LWR) of anterior and posterior cells at different stages of KV morphogenesis in treated embryos. Error bars=one standard deviation. n=number of embryos analyzed. * Significant difference between anterior and posterior (p<0.01).
Rho kinases regulate Myosin II activity via phosphorylation by activating the regulatory myosin light chain (MLC) of Myosin II (Somlyo and Somlyo, 2000) and/or inactivating Mypt1 (Feng et al., 1999; Kimura et al., 1996) that inhibits Myosin II (Fig. S3C). We hypothesized Rock2b may regulate Myosin II activity to control cell shape changes during KV remodeling. To address this, we used previously characterized (Wang et al., 2011) antisense morpholino oligonucleotides (MO) to knockdown expression of Rock2b. Similar to our findings in mypt1 mRNA injected embryos, depletion of Rock2b reduced pMLC immunostaining in KV (Fig. S3L–O). Also similar to mypt1 mRNA injected embryos, Tg(dusp6:memGFP) embryos injected with Rock2b MO showed defects in KV cell shape changes between 2–8 SS (Fig. 4G–I). Abnormal morphology of KV cells at 8 SS (Fig. 4H) is consistent with our previous results at this stage (Wang et al., 2011). Our analysis of KV morphogenesis in Rock2b depleted embryos indicated Rock2b is required for MLC phosphorylation in KV and cell shape changes during KV remodeling.
To test the role of Myosin II activity in a temporal manner, embryos were treated specifically during KV morphogenesis stages with the small molecule blebbistatin, which inhibits the ATPase activity of Myosin II and disrupts Myosin II-dependent cellular processes (Kovacs et al., 2004; Straight et al., 2003). Treating Tg(dusp6:memGFP) embryos with 35uM blebbistatin diluted in DMSO from 1 SS to 8 SS disrupted KV cell shape changes (Fig. 4J–L), whereas KV cells in control embryos treated with DMSO alone behaved similar to wild-type (Fig. 4 M–O). Taken together, these results indicate Myosin II activity is necessary for cell shape changes that remodel KV into an asymmetric organ.
Inhibition of non-muscle myosin II disrupts KV cilia distribution and fluid flow
We next tested whether interfering with Myosin II-dependent KV cell shape changes affected KV cilia distribution and/or KV function. Fluorescent immunostaining was used to analyze cilia in blebbistatin treated embryos and DMSO treated controls. At 4 SS, KV cilia were symmetrically distributed in both blebbistatin and control embryos (Fig. 5A, C, D and F). At 8 SS, KV cilia showed an AP asymmetric distribution in controls (Fig. 5B and C), whereas the distribution remained symmetric in blebbistatin treated embryos (Fig. 5E and F). Similarly, Mypt1 over-expression disrupted AP asymmetry of KV cilia (Fig. S4A–C). Importantly, the number and length of KV cilia was not affected in embryos treated with blebbistatin (Fig. 5G and H) or mypt1 mRNA (Fig. S4D and E). In addition, inhibiting Myosin II activity with blebbistatin did not appear to alter KV cilia beating relative to controls (Movies S4 and S5) or induce gross defects in KV development, as indicated by normal KV size, apical-basal polarity and tight junction formation visualized by immunostaining of aPKC and ZO1 (Fig. S5A). Phalloidin staining revealed apical filamentous actin (F-actin) structures were present in both control and blebbistatin treated embryos, however some abnormalities were observed in the actin structures in blebbistatin embryos (arrows in Fig. S5B) that may reflect reduced contractility. These results indicate Myosin II activity is necessary for the process of KV remodeling that establishes an AP asymmetric distribution of KV cilia.
Fig. 5.
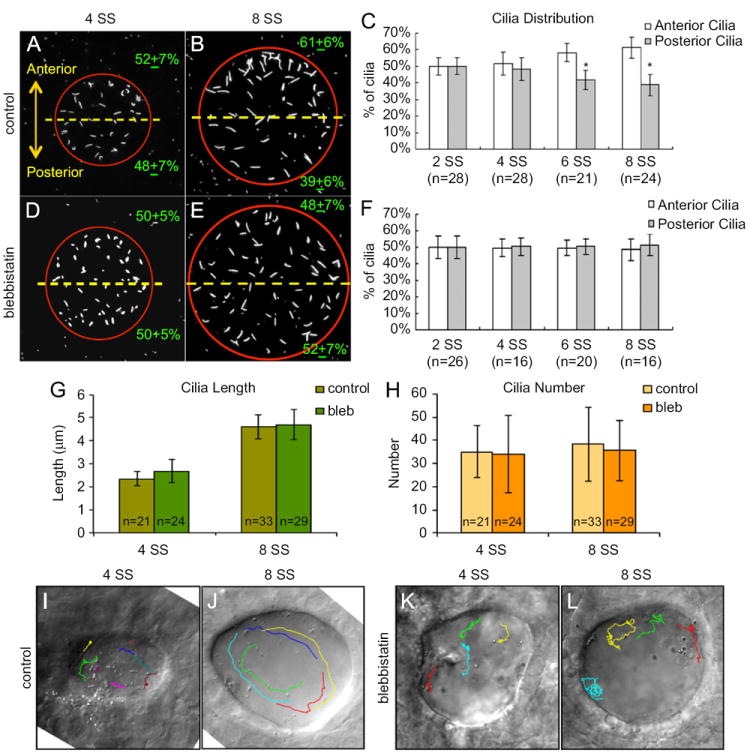
Blebbistatin disrupts asymmetric cilia distribution and directional fluid flow in KV. (A, B, D and E) Immnostaining of KV cilia in control DMSO treated (A and B) and blebbistatin treated (D and E) embryos at 4 SS and 8 SS. (C and F) Analysis of cilia distribution in DMSO control (C) and blebbistatin (F) treated embryos during KV development. Error bars=one standard deviation. n=number of embryos analyzed. *Significant difference between anterior and posterior (p<0.0001). (G and H) KV cilia length (G) and number (H) was similar in control and blebbistatin treated embryos at 4 SS and 8 SS. Error bars=one standard deviation. n=number of embryos analyzed. (I–L) Visualization of fluid flow by superimposing tracks of bead movement on an image of KV (see Movies S4-S7). Control DMSO treated embryos displayed uncoordinated flow at 4 SS (I), but strong counter-clockwise flow at 8 SS (J). In blebbistatin treated embryos, directional flow was not observed at 4 SS (K) or 8 SS (L).
Supplementary material related to this article can be found online at http://dx.doi.org/10.1016/j.ydbio.2012.07.019.
To analyze asymmetric fluid flow, fluorescent beads were injected into the KV lumen. Bead movement was captured using videomicroscopy and the paths of individual beads were tracked to assess flow. In control embryos at 4 SS, beads moved around inside KV, but there was no directional flow (Fig. 5I; Movie S6). Similarly, there were regional bead movements but no coordinated flow in blebbistatin treated embryos at 4 SS (Fig. 5K; Movie S7). The same embryos were imaged again 2 h later at 8 SS. At this stage, beads in control embryos showed strong directional counter-clockwise flow (Fig. 5J; Movie S8). In contrast, directional fluid flow was not observed in blebbistatin treated embryos, although regional flows still existed (Fig. 5L; Movie S9). Similar results were observed in multiple control (n=3/3) and blebbistatin treated (n=5/7) embryos, suggesting coordinated asymmetric flow develops in KV between 4 SS and 8 SS and requires Myosin II activity.
Supplementary material related to this article can be found online at http://dx.doi.org/10.1016/j.ydbio.2012.07.019.
Myosin II activity is required during early KV development stages for normal LR patterning
Cilia-generated flow in KV functions to orient LR patterning of the embryo by directing asymmetric spaw expression to the left LPM. We used RNA in situ hybridizations to monitor spaw expression and determine whether inhibition of Myosin II disrupts LR patterning. Consistent with defects in KV cellular architecture and fluid flow, blebbistatin treatment between 1–8 SS disrupted the laterality of spaw expression. DMSO treated control embryos showed predominantly left-sided spaw expression (Fig. 6A and C), whereas spaw was altered and often bilaterally symmetric in blebbistatin treated embryos (Fig. 6B and C). Similarly, injection of mypt1 mRNA disrupted spaw asymmetry, resulting in a high frequency of bilateral expression (Fig. S4F). This indicates Myosin II activity is necessary during early somite stages for normal LR patterning of the embryo.
To identify specific stages of development that require Myosin II activity for normal LR asymmetry, we treated embryos with short exposures to blebbistatin during KV development. After each treatment, blebbistatin was washed away and the embryos were allowed to develop until 16 SS, when they were fixed for spaw expression analysis. Blebbistatin treatments from tailbud stage to 2 SS, 2 SS to 4 SS or 4 SS to 6 SS disrupted spaw expression, often resulting in bilateral expression (Fig. 6D). In contrast, treating embryos between 6 SS and 14 SS had no significant affect on spaw laterality when compared to controls (Fig. 6D). It is important to note that blebbistatin treatments from tailbud stage to 2SS resulted in a high rate embryo lethality, which may reflect defects in gastrulation at this stage (Weiser et al., 2009; Yu et al., 2011) and complicate interpretation of spaw defects. However, treatments after tailbud stage—which did not cause lethality—demonstrated the importance of Myosin II activity during early KV development stages and revealed that Myosin II is dispensable after 6 SS for normal spaw expression. These results are consistent with a role for Myosin II mediating cell shape changes during KV remodeling prior to 6 SS that are critical for establishing asymmetric fluid flow and spaw asymmetry.
Discussion
Cilia-generated fluid flow plays an important role in LR patterning of several vertebrate embryos, but the cell biology underlying how cilia generate coordinated flow that is correctly oriented with the AP and DV axes is poorly understood. Here, we provide the first live imaging analysis of zebrafish KV development through 8 SS and the first mathematical modeling of KV morphogenesis to identify regional cell shape changes that facilitate the packing of more monociliated cells in the anterior pole of KV. This remodeling of KV architecture creates an asymmetric distribution of motile cilia along the AP axis. Mechanical modeling simulations implicated an AP gradient of cell–cell tension in KV cell shape changes. Consistent with this model, disrupting activity of a known regulator of cell tension, Myosin II, perturbed KV AP asymmetry, inhibited asymmetric fluid flow and altered LR axis specification in the embryo. PCP signaling has been shown to direct the AP asymmetric tilting of motile cilia in the organ of asymmetry that is necessary for generating asymmetric fluid flow. Our results indicate that the cellular architecture of the ciliated epithelium—mediated by Rock2b and Myosin II—is also critical for establishing asymmetric flow. We propose that both the position of the cilium on the cell (directed by core PCP signaling) and the position of ciliated cells relative to one another (mediated by a Rock-Myosin II pathway) are necessary for establishing coordinated cilia-driven fluid flow.
A new role for myosin II during vertebrate LR development
Myosins and Rho kinases appear to play multiple roles during LR development. In Drosophila, genetic screens revealed type I Myosins are involved in establishing organ LR asymmetry (Hozumi et al., 2006; Speder et al., 2006), via interactions with the actin cytoskeleton. In addition, Drosophila non-muscle Myosin II generates force necessary for asymmetric morphogenesis of the anterior midgut (Okumura et al., 2010). Myosin activity has also been implicated in heart looping in mouse mutants (Lu et al., 2008; Tullio et al., 1997), but mechanisms remain unclear. Pharmacological inhibitors revealed a role for Rho kinases in establishing LR asymmetry in the chick embryo (Wei et al., 2001). More recent experiments have shown that Rho kinase and Myosin II activity are required for asymmetric cell movements around the chick node (Gros et al., 2009). Similar to zebrafish Rock2b (Wang et al., 2011), Xenopus Rock2 is expressed in the ciliated organ of asymmetry and is necessary for normal LR asymmetry (Fakhro et al., 2011). Finally, analysis of copy number variants in patients with LR patterning defects identified the Rock2 locus (Fakhro et al., 2011). This suggests normal Rock2 activity is critical for establishing LR asymmetry in humans and provides a potential link between aberrant Rock signaling and congenital disease.
Our analyses of cilia-driven fluid flow in zebrafish suggests a Rock2b-Myosin II pathway controls a KV remodeling event that is necessary for initiation of coordinated asymmetric flow. We previously found that depletion of Rock2b disrupted asymmetric flow (Wang et al., 2011). In the present study, we imaged flow in the same wild-type embryo at 4 SS and then again at 8 SS and observed uncoordinated flow at 4 SS transition to strong coordinated flow at 8 SS (Fig. 5I–J). This indicates strong coordinated flow is initiated between 4–8 SS. This developmental timing correlates with KV remodeling between 4–6 SS, suggesting KV remodeling is necessary for establishing flow. However, cilia length also increases during these stages, such that flow initiation could depend on cilia elongation. Blebbistatin treatments provided an opportunity to separate cilia formation and KV remodeling. Blebbistatin disrupted KV remodeling, such that cilia remained equally distributed along AP axis (Fig. 5D–F), but did not alter cilia length, number (Fig. 5G–H) or motility (Movie S5). In blebbistatin treated embryos, coordinated flow did not develop between 4 SS and 8 SS (Fig. 5K–L). This suggests zebrafish Myosin II controls KV remodeling to position enough ciliated cells in the anterior region of KV to drive asymmetric fluid flow.
What mechanisms control KV remodeling?
The mathematical model described here (Fig. 3) makes predictions about the underlying mechanics of KV morphogenesis. It predicts that the cell shape changes during KV remodeling observed in vivo will occur if there is a significant reduction in the interfacial tension between anterior cells and/or a moderate increase in the tension between posterior cells. Our functional analyses in the embryo indicate KV cell shape changes depend on Myosin II activity, which mediates cell–cell interfacial tensions by regulating cell contractility and cell adhesion via clustering of the adhesion molecule E-cadherin (Shewan et al., 2005; Smutny et al., 2010). E-cadherin is a good candidate to regulate cell–cell adhesion during KV morphogenesis and has already been shown to be involved in adhesion of dorsal forerunner cells during earlier stages of development (Oteiza et al., 2010). However, fluorescent antibody staining of E-cadherin expression in KV did not reveal obvious qualitative differences between anterior and posterior cells in wild-type embryos (data not shown). A robust analysis of cell adhesion dynamics during KV morphogenesis will likely require imaging of E-cadherin:GFP fusion proteins in live embryos. In addition, while our model predicts differential cellular tensions are involved in KV remodeling, it could be that mechanical changes in cells adjacent to KV cells also contribute to KV morphological changes, and this is a direction for future research.
An additional benefit of the mathematical model is that it is useful for directing future tool development. The model indicates that cell interfacial tensions are critical for morphogenesis, but existing techniques to measure interfacial tensions such as laser ablation (Rauzi and Lenne, 2011) are currently limited to two-dimensional epithelial layers that are close to the surface of the embryo, and are therefore unsuitable for analyzing KV cells deep inside the embryo. However, interfaces with larger tensions exhibit smaller fluctuations, and therefore it may be possible to estimate differences in tensions based on live imaging of cell interfaces (Beysens et al., 2000). These measurements could be correlated with estimates for density of adhesion molecules and cytoskeletal components using GFP-labeled proteins.
Previous analyses have shown that ciliated cells are tightly packed into the dorsoanterior region of KV, while fewer cells with larger apical surfaces are found in ventroposterior regions. These regional differences are consistent with a model in which the 3-dimensional (3D) architecture of KV is important for generating strong local leftward flow in the anterior pole and slower return rightward flow in the posterior pole (Kramer-Zucker et al., 2005; Kreiling et al., 2007; Okabe et al., 2008; Wang et al., 2011). Due to current limitations in imaging and modeling KV in 3D, we chose to investigate how regional differences arise in KV by analyzing 2D cell shape dynamics during KV morphogenesis. Focusing on cells in the middle of the KV organ, we found that inhibiting Myosin II disrupted cell shape changes and fluid flow, indicating our 2D analysis has uncovered cell behaviors that are important for KV function. It is tempting to speculate that similar cell shape changes may be involved in forming the dorsal ‘roof’ and the ventral ‘floor’ of KV. However, other mechanisms may also contribute to the final 3D structure of KV. Future work will aim at developing imaging techniques and mathematical models to provide additional insight into the shaping of the KV organ.
In summary, using zebrafish KV as an experimental model and developing mathematical simulations, we have established a working model in which we propose a Rock2b-Myosin II pathway regulates cell–cell tension during KV remodeling to transform an initially symmetric group of cells into an asymmetric ciliated epithelium in the zebrafish organ of asymmetry (Fig. 7). We propose KV remodeling positions more ciliated cells in the anterior region of KV to generate coordinated directional fluid flow that triggers asymmetric spaw expression (Fig. 7). This model provides a new framework for uncovering additional molecules and mechanisms that regulate morphogenesis of the organ of asymmetry and thereby identify new candidate genes for congenital disease.
Fig. 7.
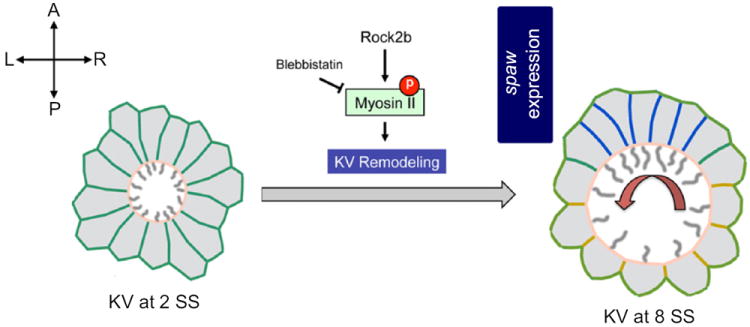
A working model for the regulation of cell shape changes during KV morphogenesis. We propose KV remodeling is an important step of KV development mediated by cell shape changes that are critical for positioning more motile cilia (gray lines) in the anterior region of the organ to drive leftward fluid flow (red arrow) across the anterior pole and trigger left-sided spaw expression in lateral plate mesoderm. Mechanical modeling predicts AP asymmetry in interfacial tension between KV cells (blue represents lower tension and yellow represents higher tension) is involved in these cell shape changes. Experimental evidence suggests Myosin II activity—a regulator of interfacial tension—is activated via phosphorylation (P) by Rock2b to control KV remodeling.
Supplementary Material
Acknowledgments
We thank Fiona Foley for excellent technical support and members of the Amack, Pruyne, Sirotkin, Krendel and Turner labs for helpful comments during this project. This work was funded by an AHA predoctoral fellowship (11PRE5730027) to G.W. and an NHLBI grant (R01HL095690) to J.D.A.
Footnotes
Appendix A. Supporting information
Supplementary data associated with this article can be found in the online version at http://dx.doi.org/10.1016/j.ydbio.2012.07.019.
References
- Amack JD, Wang X, Yost HJ. Two T-box genes play independent and cooperative roles to regulate morphogenesis of ciliated Kupffer’s vesicle in zebrafish. Dev Biol. 2007;310:196–210. doi: 10.1016/j.ydbio.2007.05.039. [DOI] [PubMed] [Google Scholar]
- Antic D, Stubbs JL, Suyama K, Kintner C, Scott MP, Axelrod JD. Planar cell polarity enables posterior localization of nodal cilia and left-right axis determination during mouse and Xenopus embryogenesis. PLoS One. 2010;5:e8999. doi: 10.1371/journal.pone.0008999. [DOI] [PMC free article] [PubMed] [Google Scholar]
- Beysens DA, Forgacs G, Glazier JA. Cell sorting is analogous to phase ordering in fluids. PNAS. 2000;97:9467–9471. doi: 10.1073/pnas.97.17.9467. [DOI] [PMC free article] [PubMed] [Google Scholar]
- Borovina A, Superina S, Voskas D, Ciruna B. Vangl2 directs the posterior tilting and asymmetric localization of motile primary cilia. Nat Cell Biol. 2010;12:407–412. doi: 10.1038/ncb2042. [DOI] [PubMed] [Google Scholar]
- Brakke K. The surface evolver. Exp Math. 1992;1:141–165. [Google Scholar]
- Brodland G. Computational modeling of cell sorting, tissue engulfment, and related phenomena: a review. Appl Mech Rev. 2004;57:47. [Google Scholar]
- Cole WC, Welsh DG. Role of myosin light chain kinase and myosin light chain phosphatase in the resistance arterial myogenic response to intravascular pressure. Arch Biochem Biophys. 2011;510:160–173. doi: 10.1016/j.abb.2011.02.024. [DOI] [PubMed] [Google Scholar]
- Cooper MS, D’Amico LA. A cluster of noninvoluting endocytic cells at the margin of the zebrafish blastoderm marks the site of embryonic shield formation. Dev Biol. 1996;180:184–198. doi: 10.1006/dbio.1996.0294. [DOI] [PubMed] [Google Scholar]
- Essner JJ, Amack JD, Nyholm MK, Harris EB, Yost HJ. Kupffer’s vesicle is a ciliated organ of asymmetry in the zebrafish embryo that initiates left-right development of the brain, heart and gut. Development. 2005;132:1247–1260. doi: 10.1242/dev.01663. [DOI] [PubMed] [Google Scholar]
- Evans E, Yeung A. Apparent viscosity and cortical tension of blood granulocytes determined by micropipet aspiration. Biophys J. 1989;56:151–160. doi: 10.1016/S0006-3495(89)82660-8. [DOI] [PMC free article] [PubMed] [Google Scholar]
- Fakhro KA, Choi M, Ware SM, Belmont JW, Towbin JA, Lifton RP, Khokha MK, Brueckner M. Rare copy number variations in congenital heart disease patients identify unique genes in left–right patterning. PNAS. 2011;108:2915–2920. doi: 10.1073/pnas.1019645108. [DOI] [PMC free article] [PubMed] [Google Scholar]
- Feng J, Ito M, Ichikawa K, Isaka N, Nishikawa M, Hartshorne DJ, Nakano T. Inhibitory phosphorylation site for Rho-associated kinase on smooth muscle myosin phosphatase. J Biol Chem. 1999;274:37385–37390. doi: 10.1074/jbc.274.52.37385. [DOI] [PubMed] [Google Scholar]
- Foty RA, Steinberg MS. The differential adhesion hypothesis: a direct evaluation. Dev Biol. 2005;278:255–263. doi: 10.1016/j.ydbio.2004.11.012. [DOI] [PubMed] [Google Scholar]
- Gao C, Wang G, Amack JD, Mitchell DR. Oda16/Wdr69 is essential for axonemal dynein assembly and ciliary motility during zebrafish embryogenesis. Dev Dyn. 2010;239:2190–2197. doi: 10.1002/dvdy.22355. [DOI] [PMC free article] [PubMed] [Google Scholar]
- Graner F. Can surface adhesion drive cell-rearrangement? part I: biological cell-sorting. J Theor Biol. 1993;164(4):455–476. [Google Scholar]
- Gros J, Feistel K, Viebahn C, Blum M, Tabin CJ. Cell movements at Hensen’s node establish left/right asymmetric gene expression in the chick. Science. 2009;324:941–944. doi: 10.1126/science.1172478. [DOI] [PMC free article] [PubMed] [Google Scholar]
- Gutzman JH, Sive H. Epithelial relaxation mediated by the myosin phosphatase regulator Mypt1 is required for brain ventricle lumen expansion and hindbrain morphogenesis. Development. 2010;137:795–804. doi: 10.1242/dev.042705. [DOI] [PMC free article] [PubMed] [Google Scholar]
- Hashimoto M, Shinohara K, Wang J, Ikeuchi S, Yoshiba S, Meno C, Nonaka S, Takada S, Hatta K, Wynshaw-Boris A, Hamada H. Planar polarization of node cells determines the rotational axis of node cilia. Nat Cell Biol. 2010;12:170–176. doi: 10.1038/ncb2020. [DOI] [PubMed] [Google Scholar]
- Hilgenfeldt S, Erisken S, Carthew RW. Physical modeling of cell geometric order in an epithelial tissue. PNAS. 2008;105:907–911. doi: 10.1073/pnas.0711077105. [DOI] [PMC free article] [PubMed] [Google Scholar]
- Hozumi S, Maeda R, Taniguchi K, Kanai M, Shirakabe S, Sasamura T, Speder P, Noselli S, Aigaki T, Murakami R, Matsuno K. An unconventional myosin in Drosophila reverses the default handedness in visceral organs. Nature. 2006;440:798–802. doi: 10.1038/nature04625. [DOI] [PubMed] [Google Scholar]
- Huang H, Ruan H, Aw MY, Hussain A, Guo L, Gao C, Qian F, Leung T, Song H, Kimelman D, Wen Z, Peng J. Mypt1-mediated spatial positioning of Bmp2-producing cells is essential for liver organogenesis. Development. 2008;135:3209–3218. doi: 10.1242/dev.024406. [DOI] [PMC free article] [PubMed] [Google Scholar]
- Ito M, Nakano T, Erdodi F, Hartshorne DJ. Myosin phosphatase: structure, regulation and function. Mol Cell Biochem. 2004;259:197–209. doi: 10.1023/b:mcbi.0000021373.14288.00. [DOI] [PubMed] [Google Scholar]
- Kafer J, Hayashi T, Maree AF, Carthew RW, Graner F. Cell adhesion and cortex contractility determine cell patterning in the Drosophila retina. PNAS. 2007;104:18549–18554. doi: 10.1073/pnas.0704235104. [DOI] [PMC free article] [PubMed] [Google Scholar]
- Kathiriya IS, Srivastava D. Left–right asymmetry and cardiac looping: implications for cardiac development and congenital heart disease. Am J Med Genet. 2000;97:271–279. doi: 10.1002/1096-8628(200024)97:4<271::aid-ajmg1277>3.0.co;2-o. [DOI] [PubMed] [Google Scholar]
- Kimmel CB, Ballard WW, Kimmel SR, Ullmann B, Schilling TF. Stages of embryonic development of the zebrafish. Dev Dyn. 1995;203:253–310. doi: 10.1002/aja.1002030302. [DOI] [PubMed] [Google Scholar]
- Kimura K, Ito M, Amano M, Chihara K, Fukata Y, Nakafuku M, Yamamori B, Feng J, Nakano T, Okawa K, Iwamatsu A, Kaibuchi K. Regulation of myosin phosphatase by Rho and Rho-associated kinase (Rho-kinase) Science. 1996;273:245–248. doi: 10.1126/science.273.5272.245. [DOI] [PubMed] [Google Scholar]
- Kovacs M, Toth J, Hetenyi C, Malnasi-Csizmadia A, Sellers JR. Mechanism of blebbistatin inhibition of myosin II. J Biol Chem. 2004;279:35557–35563. doi: 10.1074/jbc.M405319200. [DOI] [PubMed] [Google Scholar]
- Kramer-Zucker AG, Olale F, Haycraft CJ, Yoder BK, Schier AF, Drummond IA. Cilia-driven fluid flow in the zebrafish pronephros, brain and Kupffer’s vesicle is required for normal organogenesis. Development. 2005;132:1907–1921. doi: 10.1242/dev.01772. [DOI] [PubMed] [Google Scholar]
- Kreiling JA, Williams G, Creton R. Analysis of Kupffer’s vesicle in zebrafish embryos using a cave automated virtual environment. Dev Dyn. 2007;236:1963–1969. doi: 10.1002/dvdy.21191. [DOI] [PubMed] [Google Scholar]
- Long S, Ahmad N, Rebagliati M. The zebrafish nodal-related gene southpaw is required for visceral and diencephalic left–right asymmetry. Development. 2003;130:2303–2316. doi: 10.1242/dev.00436. [DOI] [PubMed] [Google Scholar]
- Lu W, Seeholzer SH, Han M, Arnold AS, Serrano M, Garita B, Philp NJ, Farthing C, Steele P, Chen J, Linask KK. Cellular nonmuscle myosins NMHC-IIA and NMHC-IIB and vertebrate heart looping. Dev Dyn. 2008;237:3577–3590. doi: 10.1002/dvdy.21645. [DOI] [PubMed] [Google Scholar]
- Manning ML, Foty RA, Steinberg MS, Schoetz EM. Coaction of intercellular adhesion and cortical tension specifies tissue surface tension. PNAS. 2010;107:12517. doi: 10.1073/pnas.1003743107. [DOI] [PMC free article] [PubMed] [Google Scholar]
- Melby AE, Warga RM, Kimmel CB. Specification of cell fates at the dorsal margin of the zebrafish gastrula. Development. 1996;122:2225–2237. doi: 10.1242/dev.122.7.2225. [DOI] [PubMed] [Google Scholar]
- Nonaka S, Tanaka Y, Okada Y, Takeda S, Harada A, Kanai Y, Kido M, Hirokawa N. Randomization of left–right asymmetry due to loss of nodal cilia generating leftward flow of extraembryonic fluid in mice lacking KIF3B motor protein. Cell. 1998;95:829–837. doi: 10.1016/s0092-8674(00)81705-5. [DOI] [PubMed] [Google Scholar]
- Okabe N, Xu B, Burdine RD. Fluid dynamics in zebrafish Kupffer’s vesicle. Dev Dyn. 2008;237:3602–3612. doi: 10.1002/dvdy.21730. [DOI] [PMC free article] [PubMed] [Google Scholar]
- Okada Y, Takeda S, Tanaka Y, Belmonte JC, Hirokawa N. Mechanism of nodal flow: a conserved symmetry breaking event in left–right axis determination. Cell. 2005;121:633–644. doi: 10.1016/j.cell.2005.04.008. [DOI] [PubMed] [Google Scholar]
- Okumura T, Fujiwara H, Taniguchi K, Kuroda J, Nakazawa N, Nakamura M, Hatori R, Ishio A, Maeda R, Matsuno K. Left–right asymmetric morphogenesis of the anterior midgut depends on the activation of a non-muscle myosin II in Drosophila. Dev Biol. 2010;344:693–706. doi: 10.1016/j.ydbio.2010.05.501. [DOI] [PubMed] [Google Scholar]
- Oteiza P, Koppen M, Concha ML, Heisenberg CP. Origin and shaping of the laterality organ in zebrafish. Development. 2008;135:2807–2813. doi: 10.1242/dev.022228. [DOI] [PubMed] [Google Scholar]
- Oteiza P, Koppen M, Krieg M, Pulgar E, Farias C, Melo C, Preibisch S, Muller D, Tada M, Hartel S, Heisenberg CP, Concha ML. Planar cell polarity signalling regulates cell adhesion properties in progenitors of the zebrafish laterality organ. Development. 2010;137:3459–3468. doi: 10.1242/dev.049981. [DOI] [PubMed] [Google Scholar]
- Ramsdell AF. Left–right asymmetry and congenital cardiac defects: getting to the heart of the matter in vertebrate left–right axis determination. Dev Biol. 2005;288:1–20. doi: 10.1016/j.ydbio.2005.07.038. [DOI] [PubMed] [Google Scholar]
- Rauzi M, Lenne PF. Cortical forces in cell shape changes and tissue morphogenesis. Curr Top Dev Biol. 2011;95:93–144. doi: 10.1016/B978-0-12-385065-2.00004-9. [DOI] [PubMed] [Google Scholar]
- Sakaguchi T, Kikuchi Y, Kuroiwa A, Takeda H, Stainier DY. The yolk syncytial layer regulates myocardial migration by influencing extracellular matrix assembly in zebrafish. Development. 2006;133:4063–4072. doi: 10.1242/dev.02581. [DOI] [PubMed] [Google Scholar]
- Schweickert A, Weber T, Beyer T, Vick P, Bogusch S, Feistel K, Blum M. Cilia-driven leftward flow determines laterality in Xenopus. Curr Biol. 2007;17:60–66. doi: 10.1016/j.cub.2006.10.067. [DOI] [PubMed] [Google Scholar]
- Shewan AM, Maddugoda M, Kraemer A, Stehbens SJ, Verma S, Kovacs EM, Yap AS. Myosin 2 is a key Rho kinase target necessary for the local concentration of E-cadherin at cell–cell contacts. Mol Biol Cell. 2005;16:4531–4542. doi: 10.1091/mbc.E05-04-0330. [DOI] [PMC free article] [PubMed] [Google Scholar]
- Shiratori H, Hamada H. The left–right axis in the mouse: from origin to morphology. Development. 2006;133:2095–2104. doi: 10.1242/dev.02384. [DOI] [PubMed] [Google Scholar]
- Smutny M, Cox HL, Leerberg JM, Kovacs EM, Conti MA, Ferguson C, Hamilton NA, Parton RG, Adelstein RS, Yap AS. Myosin II isoforms identify distinct functional modules that support integrity of the epithelial zonula adherens. Nat Cell Biol. 2010;12:696. doi: 10.1038/ncb2072. [DOI] [PMC free article] [PubMed] [Google Scholar]
- Somlyo AP, Somlyo AV. Signal transduction by G-proteins, rho-kinase and protein phosphatase to smooth muscle and non-muscle myosin II. J Physiol. 2000;522(2):177–185. doi: 10.1111/j.1469-7793.2000.t01-2-00177.x. [DOI] [PMC free article] [PubMed] [Google Scholar]
- Song H, Hu J, Chen W, Elliott G, Andre P, Gao B, Yang Y. Planar cell polarity breaks bilateral symmetry by controlling ciliary positioning. Nature. 2010;466:378–382. doi: 10.1038/nature09129. [DOI] [PMC free article] [PubMed] [Google Scholar]
- Speder P, Adam G, Noselli S. Type ID unconventional myosin controls left-right asymmetry in Drosophila. Nature. 2006;440:803–807. doi: 10.1038/nature04623. [DOI] [PubMed] [Google Scholar]
- Straight AF, Cheung A, Limouze J, Chen I, Westwood NJ, Sellers JR, Mitchison TJ. Dissecting temporal and spatial control of cytokinesis with a myosin II inhibitor. Science. 2003;299:1743–1747. doi: 10.1126/science.1081412. [DOI] [PubMed] [Google Scholar]
- Sutherland MJ, Ware SM. Disorders of left–right asymmetry: heterotaxy and situs inversus. Am J Med Genet C Semin Med Genet. 2009;151C:307–317. doi: 10.1002/ajmg.c.30228. [DOI] [PubMed] [Google Scholar]
- Tan JL, Ravid S, Spudich JA. Control of nonmuscle myosins by phosphorylation. Annu Rev Biochem. 1992;61:721–759. doi: 10.1146/annurev.bi.61.070192.003445. [DOI] [PubMed] [Google Scholar]
- Tinevez JY, Schulze U, Salbreux G, Roensch J, Joanny JF, Paluch E. Role of cortical tension in bleb growth. PNAS. 2009;106:18581–18586. doi: 10.1073/pnas.0903353106. [DOI] [PMC free article] [PubMed] [Google Scholar]
- Tullio AN, Accili D, Ferrans VJ, Yu ZX, Takeda K, Grinberg A, Westphal H, Preston YA, Adelstein RS. Nonmuscle myosin II-B is required for normal development of the mouse heart. PNAS. 1997;94:12407–12412. doi: 10.1073/pnas.94.23.12407. [DOI] [PMC free article] [PubMed] [Google Scholar]
- Wang G, Cadwallader AB, Jang DS, Tsang M, Yost HJ, Amack JD. The Rho kinase Rock2b establishes anteroposterior asymmetry of the ciliated Kupffer’s vesicle in zebrafish. Development. 2011;138:45–54. doi: 10.1242/dev.052985. [DOI] [PMC free article] [PubMed] [Google Scholar]
- Wei L, Roberts W, Wang L, Yamada M, Zhang S, Zhao Z, Rivkees SA, Schwartz RJ, Imanaka-Yoshida K. Rho kinases play an obligatory role in vertebrate embryonic organogenesis. Development. 2001;128:2953–2962. doi: 10.1242/dev.128.15.2953. [DOI] [PubMed] [Google Scholar]
- Weiser DC, Row RH, Kimelman D. Rho-regulated myosin phosphatase establishes the level of protrusive activity required for cell movements during zebrafish gastrulation. Development. 2009;136:2375–2384. doi: 10.1242/dev.034892. [DOI] [PMC free article] [PubMed] [Google Scholar]
- Westerfield M. The Zebrafish Book. University of Oregon Press; Eugene, OR: 1995. [Google Scholar]
- Yu JA, Foley FC, Amack JD, Turner CE. The cell adhesion-associated protein Git2 regulates morphogenetic movements during zebrafish embryonic development. Dev Biol. 2011;349:225–237. doi: 10.1016/j.ydbio.2010.10.027. [DOI] [PMC free article] [PubMed] [Google Scholar]
Associated Data
This section collects any data citations, data availability statements, or supplementary materials included in this article.