

Abstract
Sandhoff disease (SD) is a glycosphingolipid (GSL) storage disease that arises from an autosomal recessive mutation in the gene for the β-subunit of β-Hexosaminidase A (Hexb gene), which catabolizes ganglioside GM2 within lysosomes. Accumulation of GM2 and asialo-GM2 (GA2) occurs primarily in the CNS, leading to neurodegeneration and brain dysfunction. We analyzed the total lipids in the brains of SD mice, cats, and humans. GM2 and GA2 were mostly undetectable in the normal mouse, cat, and human brain. The lipid abnormalities in the SD cat brain were generally intermediate to those observed in the SD mouse and the SD human brains. GM2 comprised 38%, 67%, and 87% of the total brain ganglioside distribution in the SD mice, cats, and humans, respectively. The ratio of GA2 to GM2 was 0.93, 0.13, and 0.27 in the SD mice, cats, and humans, respectively, suggesting that the relative storage of GA2 is greater in the SD mouse than in the SD cat or human. Finally, the myelin-enriched lipids, cerebrosides and sulfatides, were significantly lower in the SD brains than in the control brains. This study is the first comparative analysis of brain lipids in mice, cats, and humans with SD and will be important for designing therapies for Sandhoff disease patients.
Keywords: Sandhoff Disease, β-Hexosaminidase, gangliosides, glycosphingolipids, GM2, GA2, cerebrosides, sulfatides, myelin
Introduction
Sandhoff disease (SD) is an incurable lysosomal storage disorder that arises from an autosomal recessive mutation, which causes abnormal accumulation of ganglioside GM2 leading to progressive neurodegeneration (1, 2). GM2 is catabolized by β-hexosaminidase A (HexA), which consists of an α and a β subunit encoded by the Hexa and Hexb genes, respectively, in complex with the GM2 activator protein. GM2 accumulation can result from inherited defects in either the hexosaminidase α or β subunit, or in the GM2 activator protein, leading to Tay-Sachs disease (B variant), Sandhoff disease (O variant), or GM2 activator deficiency (AB variant), respectively. SD patients have defects in the Hexb gene, and as a result, they lack activity of both β-hexosaminidase isozymes A (αβ) and B (ββ). Consequently, patients accumulate GM2 and its asialo derivative, GA2, and also oligosaccharides and other hexosaminidase substrates within lysosomes (1, 2). The onset of disease ranges from infancy to adulthood, and excessive CNS GM2 accumulation leads to progressive neurodegeneration, brain dysfunction, and ultimately death.
Although the biochemical defect in SD has been known for many years, there are presently no therapies. The development of mouse models of lysosomal storage disorders has provided the necessary tools for advancement in possible therapies and treatments. However, with some success in bone marrow transplantation, gene therapy, stem cell therapy, caloric restriction, non-steroidal anti-inflammatory drug therapy, and substrate reduction therapy in SD mice, there are still no treatments available for patients (3–12).
A possible disconnect from mouse studies to clinical treatments is the difference in the applicable brain size between mouse and human. The brain weight of the mouse is around 0.4 grams while an infantile human brain weighs around 400 grams, representing a 1000-fold difference in size (13–15). A naturally occurring, authentic model of SD in cats (fGM2Baker) has been previously characterized and could potentially serve as an intermediate model between mouse and man (16–19). Although the feline brain is closer in size and complexity to the human brain, it is not clear how the mouse and the cat animal models of SD compare to the human patient.
While the CNS GM2 accumulation has been reported for the mouse and cat models of SD and in the patient (11, 19–22), the comparative total lipid analysis has never been done. In particular, our objective was to analyze similar brain regions, at a similar phenotypic time-point, using the same methodology to compare the total lipid distribution between mice, cats, and humans with SD. Knowledge gained from this study could help provide the foundation to bridge the gap between the successes in mouse studies to treatment in patients.
Experimental Procedures
Mice
The SV/129 Hexb −/− (SD) mice were obtained from Dr. Richard Proia (NIH). These mice were derived by disruption of the murine Hexb gene and transferring this gene into the mouse genome through homologous recombination and embryonic stem cell technology as previously described (20). Hexb −/− mice were derived from crosses of Hexb +/− females with Hexb −/− males. Genotypes of mice were determined by measuring the specific activity of total hexosaminidase using a modification of the Galjaard procedure as previously described (23, 24). Hexb +/− and Hexb −/− mice were propagated in the Boston College Animal Facility and were housed in plastic cages with filter tops containing Sani-Chip bedding (P.J. Murphy Forest Products Corp., Montville, NJ, USA). Other conditions were as we recently described (12). The cortical brain region from normal and SD mice was collected around 4 months of age (humane end-point) and stored at −80°C. All animal experiments were carried out with ethical committee approval in accordance with the National Institutes of Health Guide for the Care and Use of Laboratory Animals and were approved by the Institutional Animal Care Committee.
Cats
The SD cats were obtained from the fGM2 Baker colony and have been previously described (17, 19). Sequence analysis determined that the causative mutation in this domestic shorthair SD cat resulted from a 25-base-pair inversion at the 3’ end of the Hexb gene (16). Affected cats have < 3% normal hexosaminidase activity in cerebral cortex and therefore represent an authentic model to study Sandhoff disease. Animals were euthanized by pentobarbital overdose according to recommendations of the AVMA Panel on Euthanasia, then transcardially perfused with heparinized, cold saline (0.9% NaCl) until jugular perfusate was clear. Cerebral cortex samples were collected from normal and SD cats around 5 months of age (humane end-point) and were frozen immediately in liquid nitrogen and stored at −80°C until use. All animal procedures were approved by the Auburn University Institutional Animal Care and Use Committee.
Human Samples
Age-matched normal and SD human cortex samples were obtained from the NICHD Brain and Tissue Bank for Developmental Disorders at the University of Maryland, Baltimore.
Lipid Isolation, Purification, and Quantitation
Total lipid extraction
The lipids were isolated from frontal lobe regions of the SD patients and the cats, and from the entire cortex of the SD mice. Total lipids were extracted with chloroform (CHCl3) and methanol (MeOH) 1:1 by volume and purified from the lyophilized brain tissue using modifications of previously described procedures (12, 25, 26).
Column Chromatography
Neutral and acidic lipids were separated using DEAE-Sephadex (A-25, Pharmacia Biotech, Upsala, Sweden) column chromatography as previously described (27). The total lipid extract, suspended in CHCl3:CH3OH:dH20, 30:60:8 by volume (solvent A), was applied to a DEAE-Sephadex column (1.2 mL bed volume) that had been equilibrated prior with solvent A. The column was washed twice with 20 mL solvent A and the entire neutral lipid fraction, consisting of the initial eluent plus washes, was collected. This fraction contained cholesterol, phosphatidylcholine, phosphatidylethanolamine and plasmologens, sphingomyelin, and neutral GSLs to include cerebrosides and asialo-GM2 (GA2). Next, acidic lipids were eluted from the column with 35 mL CHCl3:CH3OH: 0.8 M Na acetate, 30:60:8 by volume.
Ganglioside Purification
The acidic lipid fraction containing gangliosides was dried by rotary evaporation and then partitioned to separate the acidic lipids into the lower organic phase and the gangliosides into the upper aqueous phase as previously described (25, 28, 29). The amount of sialic acid in the ganglioside fraction was determined by the resorcinol assay and then the ganglioside fraction was further purified with base treatment and desalting, as previously described (24, 26).
Acidic phospholipid purification
After the ganglioside fraction (Folch upper phase) was transferred, the acidic phospholipid fraction (Folch lower phase) was evaporated under a stream of nitrogen and resuspended in 10 mL of CHCl3:CH3OH (1:1 by volume). This fraction contained fatty acids, cardiolipin, phosphatidylserine, phosphatidylinositol, and sulfatides.
Neutral lipid purification
Neutral lipids were dried by rotary evaporation and resuspended in 10 mL CHCl3:CH3OH (2:1 by volume). To further purify GA2, a 4 mL aliquot of the neutral lipid fraction was evaporated under a stream of nitrogen, base treated with 1 N NaOH, and Folch partitioned as described previously (26). The Folch lower phase containing GA2 was evaporated under a stream of nitrogen and resuspended in 5 mL CHCl3:CH3OH (2:1 by volume).
High-performance thin-layer chromatography
All lipids were analyzed qualitatively by high-performance thin-layer chromatograph (HPTLC) according to previously described methods (25–27, 30). To enhance precision, an internal standard (oleoyl alcohol) was added to the neutral and acidic lipid standards and samples as previously described (27). Purified lipid standards were either purchased from Matreya Inc. (Pleasant Gap, PA, USA), Sigma (St. Louis, MO, USA), or were a gift from Dr. Robert Yu (Medical College of Georgia, Augusta, GA, USA).
For gangliosides and GA2, the HPTLC plates were developed and visualized as previously described (26). For neutral and acidic phospholipids, the plates were developed to a height of either 4.5 cm or 6 cm, respectively with chloroform: methanol: acetic acid: formic acid: water (35:15:6:2:1 by volume), and then both were developed to the top with hexanes: diisopropyl ether: acetic acid (65:35:2 by volume) as previously described (27, 31). Neutral and acidic phospholipids were visualized by charring with 3% cupric acetate in 8% phosphoric acid solution, followed by heating in an oven at 165°C for 7 minutes. The percentage distribution and density of individual bands was determined as previously described (26). Briefly, the HPTLC plates were scanned on a Personal Densitometer SI with ImageQuant software (Molecular Dynamics) or on a ScanMaker 4800 with ScanWizard5 V7.00 software (Microtek). The total brain ganglioside distribution was normalized to 100% and the percentage distribution values were used to calculate sialic acid concentration of individual gangliosides as we previously described (32). The density value for GA2 was fit to a standard curve of known lipid concentration and used to calculate concentration. For the neutral and the acidic phospholipids, each lipid was normalized to an internal standard (oleyl alcohol) and its concentration was quantified using a standard curve of each respective lipid.
Statistical Analysis
All data were analyzed by the two-tailed Student’s t-Test to calculate statistical significance between the normal and the SD samples using Statview 5.0 software.
Results
Our objective was to compare the lipid distribution in the cerebral cortex of mice, cats, and humans with Sandhoff disease, using our established lipid isolation procedures. The comparative lipid analysis, to include gangliosides and neutral and acidic phospholipids, was done in age-matched normal and SD mice and cats at their respective humane end-points. Although the samples were not collected at “identical” time points in disease progression, they were collected at “similar” time points. Since the SD human samples were collected during autopsy from diseased patients, we elected to collect tissue from the SD mice and cats at a humane end-point to correlate our analysis with the human samples. The humane end point used for the mice was about 120 days (11). The SD cat samples were collected from mid to terminal disease stage under the guidance of Auburn University’s Institutional Animal Care and Use Committee. Disease progression in SD cats is stereotypical and is charted primarily by neuromuscular function. Disease onset begins at about 8 weeks with a slight head tremor, and the animal progressively loses ability to ambulate. Mid-disease is reached at about 12 weeks, when the animal has an unstable gait and falls occasionally. The humane endpoint occurs at approximately 20 weeks, when the animal can no longer walk or sit upright. Our study is the first to compare the total lipid distribution at a similar point in disease progression in mice, cats, and humans with Sandhoff disease.
The Hexb mutations in the mice and cats studied in this report generate similar levels of residual total hexosaminidase activity in brain, about 3% of normal levels in both models (9, 10, 19, 20). While the mouse mutation is a targeted disruption of the Hexb gene after the twelfth of fourteen exons, the cat mutation results in a premature termination codon in exon 14. While we are uncertain whether the artificial 4MUG substrate used for enzyme assays reflects the true enzymatic activity toward native gangliosides, we consider that the mouse and cat mutations are functionally equivalent. Consequently, differences in ganglioside storage profiles are more likely due to inter-species differences in ganglioside metabolism than to differences in residual enzyme activity.
Gangliosides
The total brain ganglioside concentration in mice, cats, and humans is shown in Table 1. In general, the total brain ganglioside concentrations in the normal animals are relatively similar among species. While all of the SD brains have significantly elevated total brain ganglioside concentrations compared to normal, the percent increase in total brain ganglioside concentration was greatest in the SD human (337%), followed by the SD cat (262%), and then the SD mouse (162%). The quantitative and qualitative distribution of individual gangliosides in the mice, cats, and human with SD is shown in Figure 1 and in Table 2. The most significant finding was that GM2 comprised 38%, 67%, and 87% of the total brain ganglioside distribution in the SD mice, cats, and human, respectively. While the percent distribution for GM1, GD1a, GT1a/LD1, GD1b, GT1b, and GQ1b in the SD mouse and the SD cat were significantly different than that of normal, these differences were not associated with significant changes in the concentration for each ganglioside. Although ganglioside GT1a/LDI was not detected in the normal cats, GT1a/LD1 was present in the SD cat. In addition, GQ1b concentration was significantly reduced in the SD cat compared to the normal cat. The concentration of all major gangliosides (GM1, GD1a, GD1b, GT1b, and GQ1b) was reduced in the SD patient compared to the normal human, and these results are consistent with previous findings (21, 22). In our analysis, we also observed an elevation in GD3 and GT1a/LD1 in the SD human.
Table 1.
Total Brain Ganglioside Concentration in Normal and Sandhoff Disease Mice, Cats, and Humansa
| Species | Age (months) | Nb | Ganglioside Content (μg sialic acid/100 mg dry weight) | % Increase | |
|---|---|---|---|---|---|
| Mouse | Normal | 4.0 ± 0.1 | 3 | 531 ± 9 | |
| Sandhoff | 4.0 ± 0.1 | 3 | 858 ± 30** | 162 | |
| Cat | Normal | 5.6 ± 0.8 | 3 | 499 ± 14 | |
| Sandhoff | 4.6 ± 0.3 | 4 | 1305 ± 122** | 262 | |
| Human | Normal | 28.3 ± 3.1 | 3 | 484 ± 26 | |
| Sandhoff | 23.8 ± 9.7 | 2 | 1629 ± 31 | 337 |
Values represent mean ± SEM, except for the Human Sandhoff samples, where values represent mean ± interquartile range.
N, the number of independent samples analyzed.
The asterisks indicate that the value is significantly different from the normal strain at P< 0.01 as determined by the two-tailed t-test.
Figure 1.

HPTLC analysis of cortical gangliosides in normal and Sandhoff disease mice (M), cats (C), and humans (H). The amount of ganglioside spotted per lane was equivalent to 1.5 μg sialic acid. The plate was developed in one ascending run with chloroform: methanol: 0.02% aqueous calcium chloride (55:45:10 by vol). Gangliosides were visualized with resorcinol-HCl spray.
Table 2.
Brain Ganglioside Distribution in Normal and Sandhoff Disease Mice, Cats, and Humansa
| Mouse |
Cat |
Human |
||||
|---|---|---|---|---|---|---|
| Ganglioside | Normal | Sandhoff | Normal | Sandhoff | Normal | Sandhoff |
| Nb | 3 | 3 | 3 | 4 | 3 | 2 |
| GM2 | ||||||
| Percentc | N.D.e | 38.1 ± 1.5 | N.D. | 67.3 ± 3.8 | 1.8 ± 0.4 | 87.1 ± 3.6 |
| Concentrationd | N.D. | 327.2 ± 23.7 | N.D. | 884.4 ± 116.8 | 8.6 ± 1.5 | 1418.7 ± 84.5 |
| GM1 | ||||||
| Percent | 11.4 ± 0.5 | 6.5 ± 0.3** | 20.4 ± 1.5 | 6.0 ± 0.8** | 20.2 ± 0.7 | 1.7 ± 1.5 |
| Concentration | 60.7 ± 3.5 | 55.6 ± 1.0 | 101.8 ± 8.3 | 76.2 ± 6.9 | 97.4 ± 3.7 | 26.8 ± 26.2 |
| GD3 | ||||||
| Percent | N.D. | N.D. | 2.4 ± 0.4 | trace | 1.8 ± 0.2 | 2.4 ± 2.9 |
| Concentration | N.D. | N.D | 11.8 ± 1.9 | trace | 8.8 ± 0.5 | 37.6 ± 46.4 |
| GD1a | ||||||
| Percent | 38.6 ± 0.5 | 23.4 ± 1.2** | 35.9 ± 3.9 | 13.3 ± 2.8** | 47.2 ± 0.7 | 3.3 ± 0.4 |
| Concentration | 205.3 ± 5.6 | 200.1 ± 9.0 | 179.2 ± 21.6 | 168.1 ± 28.3 | 228.7 ± 15.2 | 53.3 ± 7.0 |
| GT1a/LD1 | ||||||
| Percent | 3.0 ± 0.1 | 2.0 ± 0.1** | N.D. | 0.8 ± 0.1 | 1.4 ± 0.5 | 1.4 ± 0.1 |
| Concentration | 15.9 ± 0.9 | 16.7 ± 1.0 | N.D. | 11.4 ± 3.0 | 6.9 ± 2.7 | 21.6 ± 1.5 |
| GD1b | ||||||
| Percent | 10.5 ± 0.2 | 5.7 ± 0.2** | 16.0 ± 2.0 | 3.9 ± 0.4** | 10.0 ± 0.4 | 0.9 ± 0.4 |
| Concentration | 55.7 ± 1.8 | 48.7 ± 0.3 | 79.6 ± 9.6 | 51.0 ± 7.8 | 48.7 ± 4.2 | 13.1 ± 6.0 |
| GT1b | ||||||
| Percent | 29.1 ± 1.1 | 19.5 ± 1.0** | 22.3 ± 2.5 | 7.8 ± 0.5** | 16.2 ± 0.4 | 2.0 ± 0.2 |
| Concentration | 154.7 ± 5.0 | 167.6 ± 9.0 | 110.8 ± 12.3 | 102.0 ± 13.6 | 78.2 ± 3.2 | 32.7 ± 4.9 |
| GQ1b | ||||||
| Percent | 7.4 ± 0.2 | 4.9 ± 0.6* | 3.1 ± 0.6 | 0.6 ± 0.1** | 1.5 ± 0.2 | N.D. |
| Concentration | 39.1 ± 0.8 | 42.0 ± 5.0 | 15.4 ± 2.8 | 8.5 ± 1.9** | 7.0 ± 0.8 | N.D. |
Values represent mean + SEM, except for the Human Sandhoff samples, where values represent mean + interquartile range.
N, the number of independent samples analyzed.
Percent distribution determined from densitometric scanning of HPTLC as shown in Fig 1.
Concentration expressed as μg sialic acid/100 mg dry weight.
N.D., not detectable.
The asterisks indicate that the value is significantly different from the normal strain at P< 0.05
P< 0.01 as determined by the two-tailed t-test.
While GA2 was undetectable in the normal brains, GA2 accumulated in the SD brains (Table 3). Since GA2 is derived from GM2 through the action of a sialidase, we looked at the ratio of GA2 to GM2 (μmol/100 mg dry weight) (Figure 2). The ratio of GA2 to GM2 was 0.93, 0.13, and 0.27 in the SD mice, cats, and humans, respectively. Interestingly, the ratio of GA2 to GM2 was greatest in the SD mouse while this ratio was significantly less in the SD cat and human.
Table 3.
GM2 and GA2 Concentration in Normal and Sandhoff Disease Mice, Cats, and Humansa
| Species | Nb | GM2 Concentration (μmol/100 mg dry weight) | GA2 Concentration (μmol/100 mg dry weight) | |
|---|---|---|---|---|
| Mouse | Normal | 3 | N.D.c | N.D. |
| Sandhoff | 3 | 4.73 ± 0.34 | 4.33 ± 0.06 | |
| Cat | Normal | 3 | N.D. | N.D. |
| Sandhoff | 4 | 12.79 ± 1.69 | 1.60 ± 0.10 | |
| Human | Normal | 3 | N.D. | N.D. |
| Sandhoff | 2 | 20.51 ± 1.22 | 5.44 ± 1.02 |
Values represent mean ± SEM, except for the Human Sandhoff samples, where values represent mean ± interquartile range.
N, the number of independent samples analyzed.
N.D., not detectable
Figure 2.

Ratio of GA2 to GM2 in Sandhoff disease mice (N = 3), cats (N = 4), and humans (N = 2). Values represent mean + SEM, except for the human Sandhoff samples, where the value represents mean + interquartile range.
Neutral Lipids
The qualitative and quantitative distribution of the neutral brain lipids in mice, cats, and humans with Sandhoff disease (SD) is shown in Figure 3 and Table 4. The concentration cerebrosides, (the myelin-enriched glycolipid), was significantly lower in the SD brains compared to the age-matched control brains. These findings are consistent with previous reports of lower cerebrosides in SD mice and humans (11, 21). Although statistically significant, the reduction in cerebrosides in the SD mice was less pronounced than in the SD cats and humans. No statistical differences were found between the normal and SD brains for the concentration of cholesterol, ceramide, phosphatidylethanolamine, and phosphatidylcholine. Since sphingomyelin co-migrated with GA2 in our HPTLC solvent system, we did not quantify the concentration of sphingomyelin in the SD brains.
Figure 3.

HPTLC of cortical neutral lipids in normal and Sandhoff disease mice (M), cats (C), and humans (H). The amount of neutral lipids spotted per lane was equivalent to approximately 70 μg brain dry weight. The plate was developed to a height of 4.5 cm with chloroform: methanol: acetic acid: formic acid: water (35:15:6:2:1 by volume), then developed to the top with hexanes: diisopropyl ether: acetic acid (65:35:2 by volume). The bands were visualized by charring with 3% cupric acetate in 8% phosphoric acid solution. CE, cholesterol esters; TG, triglycerides; IS, internal standard; Chol, cholesterol; CM, ceramide; CB, cerebroside (doublet, indicated by arrow); PE, phosphatidylethanolamine; PC, phosphatidlycholine; SM, sphingomyelin; GA2, asialo GM2; LPC, lyso-phosphatidylcholine.
Table 4.
Neutral and Acidic Lipid Distribution in Normal and Sandhoff Disease Mice, Cats, and Humansa
| Mouse |
Concentration (μg/mg dry weight)b Cat |
Human |
||||
|---|---|---|---|---|---|---|
| Lipids | Normal | Sandhoff | Normal | Sandhoff | Normal | Sandhoff |
| Nc | 3 | 3 | 3 | 4 | 3 | 2 |
| Neutral Lipids | ||||||
| Chold | 64.6 ± 0.4 | 58.7 ± 3.6 | 79.3 ± 8.7 | 70.7 ± 5.9 | 66.9 ± 1.0 | 61.2 ± 4.1 |
| CB | 26.4 ± 0.2 | 15.3 ± 2.1* | 41.7 ± 8.5 | 4.6 ± 3.2** | 21.5 ± 0.1 | trace |
| PE | 96.3 ± 11.3 | 95.7 ± 11.8 | 108.4 ± 11.6 | 102.7 ± 12.1 | 91.4 ± 3.4 | 63.1 ± 14.4 |
| PC | 71.7 ± 6.7 | 68.4 ± 8.2 | 76.1 ± 8.2 | 71.0 ± 6.3 | 42.0 ± 12.3 | 35.9 ± 22.3 |
| Acidic Lipids | ||||||
| CL | 2.5 ± 0.2 | 3.8 ± 0.7 | 2.1 ± 0.3 | 3.7 ± 1.1 | 1.8 ± 0.2 | 2.7 ± 3.9 |
| Sulf | 5.2 ± 0.2 | 3.9 ± 0.2** | 7.6 ± 1.5 | 1.0 ± 0.6** | 5.1 ± 0.8 | trace |
| PS | 19.6 ± 1.4 | 19.1 ± 1.9 | 22.4 ± 1.6 | 15.1 ± 2.4 | 28.2 ± 2.6 | 15.9 ± 7.0 |
| PI | 6.2 ± 0.4 | 6.6 ± 0.6 | 6.1 ± 0.2 | 5.0 ± 0.9 | 6.2 ± 0.6 | 4.4 ± 0.8 |
Values represent mean + SEM, except for the Human Sandhoff samples, where values represent mean + interquartile range.
N, the number of independent samples analyzed.
The asterisks indicate that the value is significantly different from the normal strain at P< 0.05
P< 0.01 as determined by the two-tailed t-test.
Acidic Lipids
The qualitative and quantitative distribution of the acidic lipids in mice, cats, and human with Sandhoff disease (SD) is shown in Figure 4 and Table 4. The most noticeable difference in the acidic lipid distribution was the reduction in sulfatides, another myelin-enriched glycolipid, in the SD compared to normal. As with cerebrosides, the SD cat represented an intermediate between the SD mice and the SD humans in terms of the reduction of sulfatides. The presence of some GM2 on the HPTLC plate in the SD samples resulted from lower phase carryover during isolation. No significant differences were observed between the normal and the SD groups for the distribution or content of cardiolipin, phosphatidylserine, and phosphatidylinositol. We further analyzed cerebrosides and sulfatides in SD as a percent of normal (Figure 5). The myelin lipids were present at trace levels in the SD humans compared to the normal humans, and the concentration of cerebrosides and sulfatides in the SD mouse was about 58% and 76%, respectively, of that in the normal mouse. Interestingly, the concentration of cerebrosides and sulfatides in the SD cat was about 11% and 14%, respectively, of that in the normal cat. Thus, the lipid profile in the SD cat brain is intermediate to the SD mice and the SD humans in terms of GM2 and GA2 storage, as well as the reduction in cerebrosides and sulfatides.
Figure 4.

HPTLC of cortical acidic lipids in normal and Sandhoff disease mice (M), cats (C), and humans (H). The amount of acidic lipids spotted per lane was equivalent to approximately 200 μg brain dry weight. The plate was developed to a height of 6 cm with chloroform: methanol: acetic acid: formic acid: water (35:15:6:2:1 by volume), then developed to the top with hexanes: diisopropyl ether: acetic acid (65:35:2 by volume). The bands were visualized by charring with 3% cupric acetate in 8% phosphoric acid solution. FA, fatty acids; IS, internal standard; CL, cardiolipin; PA, phosphatidic acid; Sulf, sulfatides (doublet, indicated by arrow); PS, phosphatidylserine; PI, phosphatidyinositol.
Figure 5.
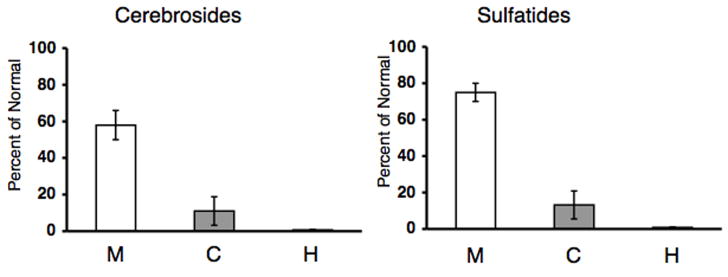
Concentration of cerebrosides and sulfatides as a percentage of normal in Sandhoff disease mice (N = 3), cats (N = 4), and humans (N = 2). Values represent mean + SEM, except for the human samples, where the value represents mean + interquartile range. Trace amounts of cerebrosides and sulfatides were detected in the SD human samples.
Discussion
Our results show for the first time the comparative analysis of brain lipids in mice, cats, and humans with SD. In contrast to a previous study, which showed that GM2 was about 42% of the total brain ganglioside distribution in the SD cat, we show that GM2 accounts for 67% of the total ganglioside distribution in the SD cat (19). The ganglioside distribution in the SD cat in the previous study was analyzed at an earlier age (11 weeks), which could account for the lower GM2 distribution (19). For our study, we analyzed the total brain ganglioside distribution at a similar time-point in disease progression in the SD mouse, cat, and human, and we showed that GM2 accumulation in the SD cat is intermediate between the SD mouse and the SD patient. In addition, we also observed an increase in GD3 in the SD human, suggesting an increase in reactive gliosis, perhaps as a result of disease progression (33). The degree of GM2 accumulation in the SD patient compared to the SD mouse poses a major hurdle in developing therapy, and our results suggest that the SD cat is an appropriate intermediate model to study.
In addition to GM2, GA2 was also a major storage material in the SD brain of all the species (2, 11, 12, 20, 21). The role of GA2 in disease progression is unclear. It is interesting to note, however, that GA2 is unlikely the primary cause of pathogenesis and neurodegeneration in GM2 gangliosidosis, since GA2 accumulation in Tay-Sachs disease is much less than in SD (2, 21). Also, pathology in GM1 and GM2 retina was associated more with ganglioside accumulation than with accumulation of asialo-gangliosides (44). The ratio of GA2 to GM2 storage was greater in the SD mouse than in the SD cat or patient. Previous studies showed that sialidase activity is more active in SD mice than in humans and is able to convert significant amounts of GM2 to GA2 (20, 34–36). Our results suggest that the activity of the feline sialidase is more similar to the human sialidase than to the mouse sialidase.
In addition to abnormal GSL storage, pathogenesis in lysosomal storage diseases is also associated with dysmyelination (21, 37–39). Reductions in the myelin-enriched lipids, cerebrosides and sulfatides were shown in the SD mice and in patients with GM2 gangliosidoses (11, 21, 40). Magnetic resonance imaging analysis also revealed significant white matter changes in the brains of patients and in animal models of GSL storage disorders (37–39, 41, 42). Furthermore, low angle X-ray diffraction analysis showed hypomyelination in the optic nerves of SD mice (43). These findings together suggest that the abnormal accumulation of GSLs may influence myelin and that dysmyelination may also contribute to disease progression. Our results showed that the myelin-enriched lipids, cerebrosides and sulfatides are significantly reduced in SD compared normal. We also found that cerebrosides and sulfatides were significantly reduced in the SD cat compared to the normal cat. Like GM2 accumulation, the reductions in the myelin-enriched lipids in the SD cat were intermediate to that observed in the SD mouse and human.
It is interesting to note that disease onset and eventual death in the SD cats also occur intermediate to these milestones in the SD mice and patients. The SD mice begin to display phenotypic abnormalities at around 12 weeks of age and are humanely euthanized at 16 weeks of age (11, 20). The onset of disease in the SD mice occurs after sexual maturation, and as a result, the SD mice are able to reproduce (11). However, behavioral dysfunction is first detected in the SD cats at 6–8 weeks of age and in the SD patient at around 24 weeks of age (2, 19). The SD cat and patient both succumb to the disease prior to reproduction. Our results show that GM2 storage is greater in SD humans and cats than in SD mice, but that GA2 storage is relatively greater in SD mice than in SD humans and cats. As much of the current progress has been limited to studies in mice, our results suggest that feline SD could be an important model to test and develop potential therapies for patients and could help translate the therapeutic success seen in mice to treatment in humans.
Acknowledgments
We acknowledge the NICHD Brain and Tissue Bank for Developmental Disorders at the University of Maryland, Baltimore (NICHD contract # N01-HD-4-3368 and N01-HD-4-3383) for the human tissue samples.
This work was supported in part from NIH grant (NS055195), the National Tay-Sachs and Allied Disease Association, and from the Lysosomal Storage Disease Research Consortium.
Abbreviations
- CHCl3
chloroform
- CNS
central nervous system
- GA2
asialo-GM2
- GSL
glycosphingolipid
- HexA
β-hexosaminidase A
- HPTLC
high-performance thin-layer chromatograph
- MeOH
methanol
- SD
Sandhoff disease
References
- 1.Neufeld EF. Lysosomal storage diseases. Annu Rev Biochem. 1991;60:257–280. doi: 10.1146/annurev.bi.60.070191.001353. [DOI] [PubMed] [Google Scholar]
- 2.Gravel RA, Clarke JTR, Kaback MM, Mahuran D, Sandhoff K, Suzuki K. The GM2 gangliosidoses. In: Scriver CR, Beaudet AL, Sly WS, Valle D, editors. The Metabolic and Molecular Bases of Inherited Disease. 7. McGraw-Hill, Inc.; New York: 1995. [Google Scholar]
- 3.Chavany C, Jendoubi M. Biology and potential strategies for the treatment of GM2 gangliosidoses. Molecular medicine today. 1998;4:158–165. doi: 10.1016/s1357-4310(98)01227-1. [DOI] [PubMed] [Google Scholar]
- 4.Jeyakumar M, Smith DA, Williams I, Borja MC, Neville DCA, Butters TD, Dwek RA, Platt FM. Anti-inflammatory and anti-oxident therapies increase survival in the Sandhoff disease mouse: synergy with N-butyldeoxynojirimycin. Ann Neurology. 2004 doi: 10.1002/ana.20242. (in press) [DOI] [PubMed] [Google Scholar]
- 5.Jeyakumar M, Butters TD, Dwek RA, Platt FM. Glycosphingolipid lysosomal storage diseases: therapy and pathogenesis. Neuropathol Appl Neurobiol. 2002;28:343–357. doi: 10.1046/j.1365-2990.2002.00422.x. [DOI] [PubMed] [Google Scholar]
- 6.Schiffmann R, Brady RO. New prospects for the treatment of lysosomal storage diseases. Drugs. 2002;62:733–742. doi: 10.2165/00003495-200262050-00002. [DOI] [PubMed] [Google Scholar]
- 7.Lee JP, Jeyakumar M, Gonzalez R, Takahashi H, Lee PJ, Baek RC, Clark D, Rose H, Fu G, Clarke J, McKercher S, Meerloo J, Muller FJ, Park KI, Butters TD, Dwek RA, Schwartz P, Tong G, Wenger D, Lipton SA, Seyfried TN, Platt FM, Snyder EY. Stem cells act through multiple mechanisms to benefit mice with neurodegenerative metabolic disease. Nat Med. 2007;13:439–447. doi: 10.1038/nm1548. [DOI] [PubMed] [Google Scholar]
- 8.Andersson U, Smith D, Jeyakumar M, Butters TD, Borja MC, Dwek RA, Platt FM. Improved outcome of N-butyldeoxygalactonojirimycin-mediated substrate reduction therapy in a mouse model of Sandhoff disease. Neurobiol Dis. 2004;16:506–515. doi: 10.1016/j.nbd.2004.04.012. [DOI] [PubMed] [Google Scholar]
- 9.Cachon-Gonzalez MB, Wang SZ, Lynch A, Ziegler R, Cheng SH, Cox TM. Effective gene therapy in an authentic model of Tay-Sachs-related diseases. Proc Natl Acad Sci U S A. 2006;103:10373–10378. doi: 10.1073/pnas.0603765103. [DOI] [PMC free article] [PubMed] [Google Scholar]
- 10.Norflus F, Tifft CJ, McDonald MP, Goldstein G, Crawley JN, Hoffmann A, Sandhoff K, Suzuki K, Proia RL. Bone marrow transplantation prolongs life span and ameliorates neurologic manifestations in Sandhoff disease mice. J Clin Invest. 1998;101:1881–1888. doi: 10.1172/JCI2127. [DOI] [PMC free article] [PubMed] [Google Scholar]
- 11.Denny CA, Kasperzyk JL, Gorham KN, Bronson RT, Seyfried TN. Influence of caloric restriction on motor behavior, longevity, and brain lipid composition in Sandhoff disease mice. J Neurosci Res. 2006;83:1028–1038. doi: 10.1002/jnr.20798. [DOI] [PubMed] [Google Scholar]
- 12.Baek RC, Kasperzyk JL, Platt FM, Seyfried TN. N-butyldeoxygalactonojirimycin reduces brain ganglioside and GM2 content in neonatal Sandhoff disease mice. Neurochem Int. 2008;52:1125–1133. doi: 10.1016/j.neuint.2007.12.001. [DOI] [PubMed] [Google Scholar]
- 13.Haug H. Brain sizes, surfaces, and neuronal sizes of the cortex cerebri: a stereological investigation of man and his variability and a comparison with some mammals (primates, whales, marsupials, insectivores, and one elephant) Am J Anat. 1987;180:126–142. doi: 10.1002/aja.1001800203. [DOI] [PubMed] [Google Scholar]
- 14.Roth G, Dicke U. Evolution of the brain and intelligence. Trends in cognitive sciences. 2005;9:250–257. doi: 10.1016/j.tics.2005.03.005. [DOI] [PubMed] [Google Scholar]
- 15.Hofman MA. Energy metabolism and relative brain size in human neonates from single and multiple gestations. An allometric study. Biology of the neonate. 1984;45:157–164. doi: 10.1159/000241999. [DOI] [PubMed] [Google Scholar]
- 16.Martin DR, Krum BK, Varadarajan GS, Hathcock TL, Smith BF, Baker HJ. An inversion of 25 base pairs causes feline GM2 gangliosidosis variant. Exp Neurol. 2004;187:30–37. doi: 10.1016/j.expneurol.2004.01.008. [DOI] [PubMed] [Google Scholar]
- 17.Baker HJ, Reynolds GD, Walkley SU, Cox NR, Baker GH. The gangliosidoses: comparative features and research applications. Veterinary pathology. 1979;16:635–649. doi: 10.1177/030098587901600602. [DOI] [PubMed] [Google Scholar]
- 18.Cork LC, Munnell JF, Lorenz MD. The pathology of feline GM2 gangliosidosis. Am J Pathol. 1978;90:723–734. [PMC free article] [PubMed] [Google Scholar]
- 19.Cork LC, Munnell JF, Lorenz MD, Murphy JV, Baker HJ, Rattazzi MC. GM2 ganglioside lysosomal storage disease in cats with beta-hexosaminidase deficiency. Science. 1977;196:1014–1017. doi: 10.1126/science.404709. [DOI] [PubMed] [Google Scholar]
- 20.Sango K, Yamanaka S, Hoffmann A, Okuda Y, Grinberg A, Westphal H, McDonald MP, Crawley JN, Sandhoff K, Suzuki K, Proia RL. Mouse models of Tay-Sachs and Sandhoff diseases differ in neurologic phenotype and ganglioside metabolism. Nat Genet. 1995;11:170–176. doi: 10.1038/ng1095-170. [DOI] [PubMed] [Google Scholar]
- 21.Sandhoff K, Harzer K, Wassle W, Jatzkewitz H. Enzyme alterations and lipid storage in three variants of Tay-Sachs disease. J Neurochem. 1971;18:2469–2489. doi: 10.1111/j.1471-4159.1971.tb00204.x. [DOI] [PubMed] [Google Scholar]
- 22.Rosengren B, Mansson JE, Svennerholm L. Composition of gangliosides and neutral glycosphingolipids of brain in classical Tay-Sachs and Sandhoff disease: more lyso-GM2 in Sandhoff disease? J Neurochem. 1987;49:834–840. doi: 10.1111/j.1471-4159.1987.tb00969.x. [DOI] [PubMed] [Google Scholar]
- 23.Galjaard H. Genetic Metabolic Disease: Diagnosis and Prenatal Analysis. Elsevier Sicence Publishers; Amsterdam: 1980. [Google Scholar]
- 24.Hauser EC, Kasperzyk JL, d’Azzo A, Seyfried TN. Inheritance of lysosomal acid b-galactosidase activity and gangliosides in crosses of DBA/2J and knockout mice. Biochem Genetics. 2004;42:241–257. doi: 10.1023/b:bigi.0000034429.55418.71. [DOI] [PubMed] [Google Scholar]
- 25.Seyfried TN, Glaser GH, Yu RK. Cerebral, cerebellar, and brain stem gangliosides in mice susceptible to audiogenic seizures. J Neurochem. 1978;31:21–27. doi: 10.1111/j.1471-4159.1978.tb12428.x. [DOI] [PubMed] [Google Scholar]
- 26.Kasperzyk JL, El-Abbadi MM, Hauser EC, D’Azzo A, Platt FM, Seyfried TN. N-butyldeoxygalactonojirimycin reduces neonatal brain ganglioside content in a mouse model of GM1 gangliosidosis. J Neurochem. 2004;89:645–653. doi: 10.1046/j.1471-4159.2004.02381.x. [DOI] [PubMed] [Google Scholar]
- 27.Macala LJ, Yu RK, Ando S. Analysis of brain lipids by high performance thin-layer chromatography and densitometry. J Lipid Res. 1983;24:1243–1250. [PubMed] [Google Scholar]
- 28.Folch J, Lees M, Sloane-Stanley GH. A simple method for the isolation and purification of total lipids from animal tissues. J Biol Chem. 1957;226:497–509. [PubMed] [Google Scholar]
- 29.Kasperzyk JL, d’Azzo A, Platt FM, Alroy J, Seyfried TN. Substrate reduction reduces gangliosides in postnatal cerebrum-brainstem and cerebellum in GM1 gangliosidosis mice. J Lipid Res. 2005;46:744–751. doi: 10.1194/jlr.M400411-JLR200. [DOI] [PubMed] [Google Scholar]
- 30.Ando S, Chang NC, Yu RK. High-performance thin-layer chromatography and densitometric determination of brain ganglioside compositions of several species. Anal Biochem. 1978;89:437–450. doi: 10.1016/0003-2697(78)90373-1. [DOI] [PubMed] [Google Scholar]
- 31.Seyfried TN, Bernard D, Mayeda F, Macala L, Yu RK. Genetic analysis of cerebellar lipids in mice susceptible to audiogenic seizures. Exp Neurol. 1984;84:590–595. doi: 10.1016/0014-4886(84)90206-1. [DOI] [PubMed] [Google Scholar]
- 32.Seyfried TN, Yu RK, Miyazawa N. Differential cellular enrichment of gangliosides in the mouse cerebellum: Analysis using neurological mutants. J Neurochem. 1982;38:551–559. doi: 10.1111/j.1471-4159.1982.tb08662.x. [DOI] [PubMed] [Google Scholar]
- 33.Seyfried TN, Yu RK. Ganglioside GD3: structure, cellular distribution, and possible function. Mol Cell Biochem. 1985;68:3–10. doi: 10.1007/BF00219383. [DOI] [PubMed] [Google Scholar]
- 34.Li SC, Li YT, Moriya S, Miyagi T. Degradation of G(M1) and G(M2) by mammalian sialidases. Biochem J. 2001;360:233–237. doi: 10.1042/0264-6021:3600233. [DOI] [PMC free article] [PubMed] [Google Scholar]
- 35.Yuziuk JA, Bertoni C, Beccari T, Orlacchio A, Wu YY, Li SC, Li YT. Specificity of mouse GM2 activator protein and beta-N-acetylhexosaminidases A and B. Similarities and differences with their human counterparts in the catabolism of GM2. J Biol Chem. 1998;273:66–72. doi: 10.1074/jbc.273.1.66. [DOI] [PubMed] [Google Scholar]
- 36.Bertoni C, Li YT, Li SC. Catabolism of asialo-GM2 in man and mouse. Specificity of human/mouse chimeric GM2 activator proteins. J Biol Chem. 1999;274:28612–28618. doi: 10.1074/jbc.274.40.28612. [DOI] [PubMed] [Google Scholar]
- 37.Kroll RA, Pagel MA, Roman-Goldstein S, Barkovich AJ, D’Agostino AN, Neuwelt EA. White matter changes associated with feline GM2 gangliosidosis (Sandhoff disease): correlation of MR findings with pathologic and ultrastructural abnormalities. AJNR Am J Neuroradiol. 1995;16:1219–1226. [PMC free article] [PubMed] [Google Scholar]
- 38.Folkerth RD, Alroy J, Bhan I, Kaye EM. Infantile G(M1) gangliosidosis: complete morphology and histochemistry of two autopsy cases, with particular reference to delayed central nervous system myelination. Pediatr Dev Pathol. 2000;3:73–86. doi: 10.1007/s100240050010. [DOI] [PubMed] [Google Scholar]
- 39.Kaye EM, Alroy J, Raghavan SS, Schwarting GA, Adelman LS, Runge V, Gelblum D, Thalhammer JG, Zuniga G. Dysmyelinogenesis in animal model of GM1 gangliosidosis. Pediatr Neurol. 1992;8:255–261. doi: 10.1016/0887-8994(92)90361-2. [DOI] [PubMed] [Google Scholar]
- 40.Pellkofer R, Jatzkewitz H. The enzymic degradation of cerebrosides and sulphatides in human demyelination due to disseminated sclerosis and encephalitis, and to Tay-Sachs disease. Acta neuropathologica. 1974;29:25–35. doi: 10.1007/BF00684388. [DOI] [PubMed] [Google Scholar]
- 41.van der Voorn JP, Pouwels PJ, Kamphorst W, Powers JM, Lammens M, Barkhof F, van der Knaap MS. Histopathologic correlates of radial stripes on MR images in lysosomal storage disorders. AJNR Am J Neuroradiol. 2005;26:442–446. [PMC free article] [PubMed] [Google Scholar]
- 42.Vite CH, Magnitsky S, Aleman D, O’Donnell P, Cullen K, Ding W, Pickup S, Wolfe JH, Poptani H. Apparent Diffusion Coefficient Reveals Gray and White Matter Disease, and T2 Mapping Detects White Matter Disease in the Brain in Feline Alpha-Mannosidosis. AJNR Am J Neuroradiol. 2007 doi: 10.3174/ajnr.A0791. [DOI] [PMC free article] [PubMed] [Google Scholar]
- 43.McNally MA, Baek RC, Avila RL, Seyfried TN, Strichartz GR, Kirschner DA. Peripheral nervous system manifestations in a Sandhoff disease mouse model: nerve conduction, myelin structure, lipid analysis. Journal of negative results in biomedicine. 2007;6:8. doi: 10.1186/1477-5751-6-8. [DOI] [PMC free article] [PubMed] [Google Scholar]
- 44.Denny CA, Alroy J, Pawlyk BS, Sandberg MA, d’Azzo A, Seyfried TN. Neurochemical, morphological, and neurophysiological abnormalities in retinas of Sandhoff and GM1 gangliosidosis. Journal of Neurochemistry. 2007;101:1294–1302. doi: 10.1111/j.1471-4159.2007.04525.x. [DOI] [PubMed] [Google Scholar]