

Abstract
The acquisition of high-resolution tandem mass spectra (MS/MS) is becoming more prevalent in proteomics, but most researchers employ peptide identification algorithms that were designed prior to this development. Here we demonstrate new software, Morpheus, designed specifically for high–mass accuracy data, based on a simple score that is little more than the number of matching products. For a diverse collection of datasets from a variety of organisms (E. coli, yeast, human) acquired on a variety of instruments (quadrupole–time of flight, ion trap orbitrap, quadrupole–orbitrap) in different laboratories, Morpheus gives more spectrum, peptide, and protein identifications at a 1% false discovery rate (FDR) than Mascot, Open Mass Spectrometry Search Algorithm (OMSSA), and Sequest. Additionally, Morpheus is 1.5 to 4.6 times faster—depending on the dataset—than the next fastest algorithm, OMSSA. Morpheus was developed in C#.NET and is available free and open source under a permissive license.
Keywords: proteomics, mass spectrometry, database search algorithm, software
Introduction
The emergence of fast and sensitive hybrid mass spectrometers such as quadrupole time-of-flight (Q–TOF)1–3 and ion trap–Fourier transform4, 5 instruments was a major advance for proteome analysis6. With these devices, mass spectra are routinely acquired with resolving power and mass accuracy roughly two orders of magnitude better than unit resolution instruments. In the case of ion trap–Fourier transform mass spectrometers, initially the speed and sensitivity of ion trap mass analysis of MS/MS spectra outweighed the improved specificity provided by Fourier transform mass analysis, although this balance continues to shift toward high-resolution analysis of all spectra.7–12 Many of today’s most popular database search algorithms, however, were designed for yesterday’s unit resolution data.
Scoring of peptide–spectrum matches (PSMs) is the most defining aspect of a search algorithm13, but little has changed in this regard since the shift toward high–mass accuracy data, despite the vast increase in specificity afforded. Sequest14, introduced in 1994, was the first major database search algorithm, using cross-correlation to evaluate the similarity between experimental and theoretical mass spectra. Mascot15 followed in 1999 with a probability-based score. Since then, most peptide identification algorithms have followed this probabilistic scoring approach, including popular open-source algorithms X!Tandem16 and OMSSA17. Although these algorithms are capable of dealing with high mass accuracy, to our knowledge none have been significantly altered for this type of data. There have been numerous other algorithms introduced, perhaps most notably Andromeda18 of the MaxQuant19 suite, but none of which have fundamentally different scoring for high–mass accuracy MS/MS.
We sought to develop software designed from the ground up for high-resolution MS/MS. For spectral preprocessing we were careful to take advantage of the specificity provided by high mass accuracy to assign charge states and remove non-monoisotopic peaks, but with minimal loss of sensitivity. We initially started with a very rudimentary score: the number of matching products plus the fraction of spectrum abundance assigned to matching products. Remarkably, we found that these straightforward methods surpassed contemporary search algorithms. We postulate that the added specificity of high–mass accuracy data makes it easier to distinguish correct and incorrect identifications with a less finely tuned metric.
One possible concern with such a simplistic score is the lack of a probabilistic interpretation that is nearly unanimous in current peptide identification software. However, another important trend in mass spectrometry–based proteomics is the widespread adoption of target–decoy searching20 for controlling the error rate of peptide and protein identifications.21, 22 In this paradigm, PSMs minimally benefit from statistically meaningful scores, as the absolute value of scores is irrelevant for the purposes of evaluation with FDR. Since PSMs are ordered against each other, only the relative value of scores is important. Global and local error rates can be determined empirically. This has major implications for PSM scoring. Since statistical scores are no longer beneficial, probabilistic models need not be invoked, which means scoring can be simplified and computationally expedited.
Here we describe our new proteomics search algorithm, Morpheus, which aims to modernize and simplify the analysis of peptide MS/MS spectra. Precursor m/z and charge state is taken directly from scan metadata and is not re-evaluated. Spectral preprocessing involves a simple top n peaks abundance filtering and a rudimentary charge state determination and de-isotoping algorithm that involves no fitting of theoretical distributions. In terms of peptide spectrum matching, only the most common product ions are considered (i.e., b- and y-type for collisional dissociation) with no differential weighting. Using Morpheus’s simplistic algorithms, we demonstrate a significant improvement in PSM, distinct peptide, and protein group identifications at a fixed FDR over several popular search algorithms.
We hope these findings will encourage a new trend of simplicity and transparency in database search algorithms and allow mass spectrometry users to understand how spectra are judged and identifications produced, without sacrificing sensitivity. We believe the speed of the software is also noteworthy, particularly considering it was developed in the high-level programming language C#.NET and has not been extensively optimized, making it accessible to most developers. The permissive open-source license places minimal restrictions on the code. Moreover, the combination of speed and simplicity facilitates new workflows based on real-time identification, similar to those introduced in MaxQuant Real-Time23. A variation of the Morpheus algorithm is the basis of the instant sequence confirmation (inSeq) method, executed in the onboard mass spectrometer computer, enabling a range of advanced experiments24.
Software
Software development
Morpheus was developed in C# with Microsoft Visual Studio 2008 and 2010. It uses the Microsoft.NET Framework version 4.0, including the Task Parallel Library for multiprocessor and multicore support.
Spectrum preprocessing
Morpheus uses the XML-based standard mzML25, 26 as the input file format. Three options are provided for MS/MS peak filtering: an absolute threshold, a relative threshold, or a total number of peaks threshold (based on abundance). Charge state assignment for MS/MS spectra is performed with a single iteration through all peaks. For each peak, higher mass-to-charge ratio (m/z) peaks are considered. If any of those peaks are located at an m/z where an expected isotopic peak would lie for a charge state from one to the charge state of the precursor, within mass tolerance, the reference peak is considered to be of that charge state. Note that this could result in multiple charge states and therefore multiple masses for a single peak; this is allowed to maximize sensitivity. De-isotoping of product spectra is also achieved by a single iteration through all peaks, but in the reverse direction. For each peak, lower m/z peaks are considered. If the reference peak lies where an expected isotopic peak would lie for a charge state from one to the charge state of the precursor, within mass tolerance, and is of lower abundance, the reference peak is considered to be an isotopic peak and removed.
Peptide generation
After spectral preprocessing, the main computational workflow of Morpheus starts with proteins digested into peptides instead of MS/MS spectra. Although less intuitive, this approach (inspired by OMSSA17) reduces the memory footprint of the software because the spectral data is typically smaller than a full proteome database digested into peptides, even before considering modifications. Peptides are generated by iterating through each protein in the FASTA file and digesting with the specified protease, allowing up to the maximum number of missed cleavages. For each peptide, fixed modifications are applied, then each combination of variable modifications is considered up to a limited number of isoforms. For each peptide isoform, the mass plus the mass tolerance is used as a key to perform a binary search of the product spectra, which have already been sorted by ascending precursor mass. Each candidate product spectrum is iterated over in descending order and scored until one is encountered that is below the peptide mass minus the mass tolerance.
PSM scoring
PSMs are scored by the sum of the number of matching products and the fraction of the spectrum abundance that can be assigned to matching products. Both elements of this score are rapidly calculated by asynchronous iteration through theoretical and experimental product ions, both pre-sorted by mass.
Outputs
Morpheus produces several different output files: a log file, pepXML27, and tab-delimited PSM, distinct peptide, and protein group files.
Experimental
Data sets
Morpheus was tested with six sets of triplicate data: (1) Q–TOF E. coli acquired on an Agilent 6530A, (2) dual-cell linear ion trap–orbitrap (dcLIT–OT) yeast acquired on a Thermo Scientific LTQ Orbitrap Velos using higher-energy collisional dissociation (HCD) with product mass analysis in the orbitrap, (3) dcLIT–OT human acquired on a Thermo Scientific LTQ Orbitrap Velos using HCD with product mass analysis in the orbitrap, (4) quadrupole–orbitrap (Q–OT) human acquired on a Thermo Scientific Q-Exactive, (5) LIT–OT ETD human acquired on a Thermo Scientific LTQ Orbitrap XL using electron-transfer dissociation (ETD) with product mass analysis in the orbitrap, and (6) dcLIT–OT/IT yeast acquired on a Thermo Scientific LTQ Orbitrap Velos using resonant-excitation collision-induced dissociation (CID) with product mass analysis in the ion trap. Datasets dcLIT–OT human and Q–OT human were described in Michalski et al.28 Dataset LIT–OT ETD human was described in Wenger et al.29 The datasets are summarized in Supporting Table S1.
E. coli sample preparation
E. coli lysate (BioRad) was suspended in a buffer of 50% 2,2,2-trifluoroethanol, 50 mM ammonium bicarbonate, and 5 mM dithiothreitol to a protein concentration of 1.35 mg/mL. Proteins were denatured thermally at 60 °C for 45 min, alkylated with 10 mM iodoacetamide at room temperature for 30 min in the dark, and the excess iodoacetamide was quenched with dithiothreitol. The reaction mixture was diluted to 5% trifluroethanol and 25 mM ammonium bicarbonate by addition of water and 100 mM ammonium bicarbonate and digested with sequencing-grade modified trypsin (Promega) at a 1:25 enzyme:substrate ratio at 37 °C overnight. Trypsin was inactivated via addition of neat formic acid to pH 3, and the sample was stored at −80 °C until use.
E. coli LC–MS/MS
For each 65-min analysis, 500 ng sample was loaded onto the 360 nL enrichment column of a Polaris-HR-Chip-3C18 chip in a ChipCube source. Peptides were eluted from a 75 μm i.d. × 150 mm analytical column. Both columns contained Polaris C18-A stationary phase with 3 μm particle diameter and 180 Å pore size. Mass spectral acquisition on an Agilent 6530A Q-TOF consisted of MS1 at a scan rate of 4 Hz followed by MS/MS of the top 10 most abundant precursors, with a target of 25,000 counts/spectrum. Precursor charge states of +2, +3, and >+3 were selected. An isolation width of ~1.3 Th (narrow mode) was used. Collision energies of 3.6 × m/z / 100 − 4.8 were used. Dynamic exclusion was enabled after one MS/MS event for 48 seconds.
Yeast sample preparation
Wild-type lab strain of yeast was grown in yeast peptone dextrose (YPD) media to mid-log phase. Cells were subsequently harvested via 10,000 rpm spin-down and washed with chilled water. The cell pellet was resuspended in 5 mL of lysis buffer (100 mM tris pH 8, 8 M urea, 75 mM NaCl, 1 mM dithiothreitol, 100 mM sodium butyrate, 1 mM sodium orthovanidate, Roche Protease inhibitors, and Roche PhosSTOP inhibitors) and lysed via French press three times. The lysate was centrifuged at 14,000 rpm for 10 min to remove cell debris. Cysteine residues were reduced by incubating lysate with 5 mM dithiothreitol for 45 min at 37 °C followed by one hour incubation in 15 mM iodoacetamide at room temperature in the dark. Excess iodoacetamide was capped with dithiothreitol at room temperature. After the addition of 1 mM CaCl2, 50 mM tris (to decrease urea to 1 mM), and adjusting to pH 8, proteins were digested with sequencing-grade modified trypsin (Promega) at a 1:50 enzyme:substrate ratio at 37 °C overnight. Digestion was quenched by the addition of trifluoroacetic acid to a final concentration of 0.5% (pH ≤ 3), desalted via solid-phase extraction on tC18 SepPak cartridges (Waters), and the eluent was lyophilized and stored at −80 °C until further use. Prior to injection, samples were resuspended to a final concentration of 1 μg/μL.
Yeast LC–MS/MS
For each 165-min analysis, 1 μg sample was loaded onto a 75 μm i.d. × 8 cm pre-column. Peptides were eluted from a 50 μm i.d. × 25 cm analytical column via a Waters nanoAquity HPLC. Both columns were packed with Magic C18 AQ (Michrom) stationary phase with 5 μm particle diameter and 300 Å pore size. Mass spectral acquisition on a Thermo Scientific LTQ Orbitrap Velos consisted of MS1 at a resolving power of 30,000 and an automatic gain control target of 1×10⁶ charges followed by MS/MS of the top 10 most abundant precursors at a resolving power of 7500 and an automatic gain control target of 2×10⁵ (HCD) or 1×10⁴ (CID) charges. FTMS master scan preview mode was disabled for HCD but enabled for CID. Monoisotopic precursor selection was disabled. Precursor charge states of +2, +3, and >+3 were selected. An isolation width of 3 Th was used. Normalized collision energy was set to 45 (HCD) or 35 (CID). Dynamic exclusion was enabled after one MS/MS event for 60 seconds.
Database searches
The 15 collisional dissociation data files were searched with Morpheus and three popular search algorithms: Mascot15 (version 2.4.0, Matrix Science), OMSSA17 (version 2.1.9), and Sequest14 (via Proteome Discoverer version 1.3.0.339, Thermo Fisher Scientific). The three ETD data files were also searched with ZCore30 (via Proteome Discoverer). FASTA database files were downloaded from UniProt’s31, 32 reference proteome sets (release 2012_07) and converted to a concatenated target–decoy version by reversing protein sequences (except for the N-terminal amino acid when it was methionine) with Database Maker of the Coon OMSSA Proteomic Analysis Software Suite (COMPASS)33.
All datasets were converted to mzML with the msconvert utility of ProteoWizard34, 35 (version 3.0 build 3768). For the dcLIT–OT human and Q–OT human datasets, vendor centroiding (--filter “peakPicking true 1-”) was applied since the data was acquired in profile mode. For the ETD datasets, ETD preprocessing (--filter ETDFilter) was enabled to remove precursor, charge-reduced precursor, and neutral losses from charge-reduced precursor36, 37.
The resulting mzML files were searched directly by Mascot and Morpheus. OMSSA searches were performed with merged.dta files separated by extensible markup language (XML)–like tags. Sequest and ZCore searches were performed with Mascot generic format (MGF) files. Merged.dta and MGF files were generated directly from the mzML files to prevent bias (i.e. extra or different information provided), using custom software.
Trypsin without the proline rule (except the ETD dataset, which used Lys-C without the proline rule) was used with full specificity and a maximum of two missed cleavages. Monoisotopic precursor mass tolerance was ±2.1 Da to account for monoisotopic peak assignment errors and monoisotopic product mass tolerance was ±0.025 Da for Q–TOF datasets and ±0.01 Da for orbitrap datasets, except the datasets with ion trap product mass analysis which used ±0.5 Da. Carbamidomethylation of cysteine (+57 Da) was specified as a fixed modification; oxidation of methionine (+16 Da) was specified as a variable modification.
Parameters were left at their defaults except where noted. For Mascot, the ESI-QUAD-TOF/ESI-TRAP fragmentation rules (b-, b–NH3-, b–H2O-, y-, y–NH3-, and y–H2O-type products; product charge states +1 and +2 if precursor +2 or higher) were used for the Q–TOF and dcLIT–OT/IT datasets, while the Default fragmentation rules (a-, a–NH3-, b-, b–NH3-, y-, and y–NH3-type products; product charge states +1 and +2 if precursor +2 or higher) were used for dcLIT–OT and Q–OT datasets. The ETD-TRAP fragmentation rules (c-, y-, z+1-, and z+2-type products; product charge states +1 and +2 if precursor +2 or higher) were used for the ETD datasets. For OMSSA, searching of the first forward product (i.e. b1 or c1), which is disabled by default, was enabled (-sb1 0). For ETD searches, c- and z-type product (-i 2,5) were searched instead of the default b- and y-type (-i 1,4). The proline rule—that ETD does not cleave N-terminal to proline residues—was also specified in these searches (-p 2,5). For Sequest and ZCore (via Proteome Discoverer), the Protein Score Cutoff of the Peptide Validation node was set to zero to disable the removal of PSMs due to protein grouping. For Sequest ETD searches, product weights of 1 were used for c- and z-type products instead of the default of 1 for b- and y-type products. For Morpheus, top 400 most abundant peaks per spectrum filtering38, charge state assignment, and de-isotoping were enabled for MS/MS spectra.
Post-search analyses
For all search algorithms, results were exported as pepXML27. In Mascot, resulting.dat files were converted to pepXML using the export_dat_2.pl Perl script, modified to output expectation values to more precision to avoid ties. The homology threshold was used for calculating expectation values rather than the default identity threshold because it gave more identifications. Custom software was written to perform FDR analysis at the PSM, distinct peptide, and protein group levels. The software first selected the best PSM for each scan number. In cases where target and decoy PSMs had the same score, or a peptide could be assigned to target or decoy proteins, the decoy was preferred. The software sorted PSMs according to score: ascending expectation value for Mascot and OMSSA, descending XCorr for Sequest, ascending probability for ZCore, and descending Morpheus score for Morpheus. The score threshold yielding the maximum target PSMs at less than or equal to 1% FDR was determined. Identifications were then reduced to distinct peptides, ignoring modifications, and the process was repeated. Finally, protein grouping and parsimony was performed. Proteins were first redigested and distinct peptides identified at 1% FDR were assigned to all possible parent proteins. Protein scores were calculated as the product of distinct peptide scores for cases where the PSM scores were logarithmic (Mascot and OMSSA expectation value, ZCore probability) or the sum of distinct peptide scores for cases where the PSM scores were linear (i.e. Sequest XCorr, Morpheus score); in both cases only the best-scoring PSM was used for each distinct peptide. Proteins were sorted by score. Indistinguishable proteins were merged into groups, then subset and subsumable protein groups were removed.39 Lastly the score threshold yielding the maximum target protein groups at less than or equal to 1% FDR was determined. The protein with the longest sequence was used as the representative of the protein group for the purpose of generating Venn diagrams.
Results and Discussion
We set out to develop a proteomics database search algorithm, Morpheus, designed specifically for high-resolution MS/MS spectra, under the assumption that the vastly higher specificity would fundamentally transform how database searching should be done. Our initial implementation included very basic spectral preprocessing and scoring routines. Much to our surprise, Morpheus actually performed better than several contemporary algorithms, despite its simplicity.
To illustrate the scoring of Morpheus, an example spectrum, scan number 12,864 of the second replicate of the Q–OT human dataset, is shown in Figure 1. This spectrum, and this peptide (sequence NGVPAVGLK), was only identified at 1% FDR by Morpheus. Although not an extremely confident identification, 10 matching products (5 b- and 5 y-type) were found within the product mass tolerance of ±0.01 Da, accounting for 30.2% of the total spectrum abundance after preprocessing. The sum of these two quantities yields the Morpheus score of 10.302. Although not considered by the one-dimensional FDR analysis of Morpheus, this PSM had a precursor mass error of less than a part per million, lending further credence to the identification (the expected correlation between high Morpheus score and low precursor mass error is shown in Supporting Figure S1). Morpheus evaluates each PSM likewise for all peptides within the precursor mass tolerance (±2.1 Da in this case) and retains the PSM with the highest score.
Figure 1.
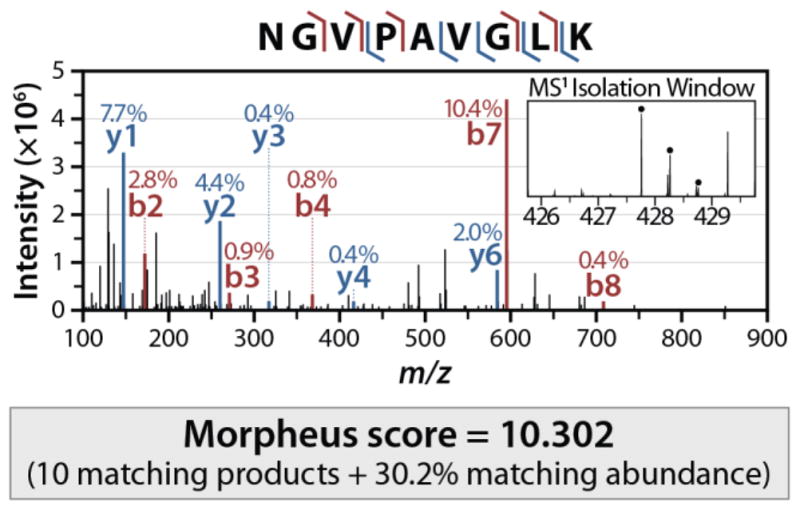
An example spectrum, scan number 12,864 of the second replicate of the Q–OT human dataset. The Morpheus score is merely the sum of the number of matching products (10) and the fraction of abundance matched (30.2%), for a total of 10.302. This score, for the peptide of sequence NGVPAVGLK, was the best among all the peptides within the precursor mass tolerance.
We compared Morpheus to popular search algorithms for several diverse, large-scale proteomics datasets to evaluate its performance. We were extremely careful to use the same input data, databases, and parameters to the extent possible, and analyzed the output identically. Figure 2 shows PSM, distinct peptide, and protein group identifications at 1% FDR from Mascot, OMSSA, Sequest, ZCore (ETD only) and Morpheus for each of the six datasets. The height of the bars is the average of triplicate LC–MS/MS analyses, with error bars representing the standard deviation.
Figure 2.

Comparison of PSM, distinct peptide, and protein group identifications at 1% FDR with Mascot, OMSSA, Sequest, ZCore, and Morpheus for (a) Q–TOF E. coli, (b) dcLIT–OT yeast, (c) dcLIT–OT human, (d) Q–OT human, (e) LIT–OT ETD human, and (f) dcLIT–OT/IT yeast datasets. For all five high–mass accuracy datasets, Morpheus is the highest in all three quantities.
Among the high-resolution datasets (a)–(e), Morpheus outperforms the other algorithms in all metrics (PSMs, distinct peptides, protein groups). Improvements range from 4 to 45% among the collisional dissociation datasets (a)–(d). Morpheus performed particularly well relative to the other algorithms for the Q–OT human dataset, with 26% more PSMs, 18% more distinct peptides, and 13% more protein groups than the next closest competitor, Sequest. We note that for Mascot, the fragmentation rules which gave the best performance for each of the six datasets individually were used for this comparison (Supporting Table S2).
Morpheus also performed very well on the ETD dataset, with 25% more PSMs, 21% more distinct peptides, and 7% more protein groups than the next closest competitor, OMSSA. ZCore, although it was designed specifically for ETD, gave poor results. Its lack of support for a user-specified product mass tolerance likely hurt its performance since it could not take advantage of the high mass accuracy.
These results are surprising given the basic nature of the score used by Morpheus—little more than the number of matching products. One might intuit that the fraction of matching over total possible (2 × [peptide length − 1]) products might be a better metric. However, because the number of spurious matches is largely independent of peptide length, this score inappropriately favors short peptides. For example, matching half of the possible products is typically significant for longer peptides, but likely a false positive for shorter peptides. The Morpheus score biases against short peptides, to the point where peptides below a certain length are not even considered even if the match is perfect. However, given the difficulty in confidently identifying short peptides we feel this bias is largely justified and yields favorable results. Note that there are no explicit lower or upper limits on peptide length, although the scoring may impose de facto restrictions.
The number of matching products performs quite well as a score by itself. However, since it can only take on whole numbers, another factor must be introduced to avoid quantization. Large numbers of PSMs sharing the exact same score leads to drastic, undesirable jumps in FDR. A suitable metric is the fraction of the spectrum’s abundance matched to product ions over the total abundance, after preprocessing. This has the benefit of being normalized between 0 and 1. Note that the fraction of spectrum abundance matched is only used to differentiate PSMs with the same number of matching products, and can be considered a secondary metric that will never override the primary metric.
Despite the simplicity of the scoring, as well as the other components of the software, Morpheus performs better than other algorithms for a diverse collection of contemporary proteomics datasets. One potential explanation for this is that all the other search algorithms were designed for low–mass accuracy MS/MS data, and have not been fully reevaluated in light of the added specificity provided by high mass accuracy. Reinforcing this hypothesis, Morpheus performs the worst for the low-resolution dataset (f), although not by a wide margin. It is possible that algorithms that analyze both low- and high-resolution MS/MS in fundamentally the same manner are forced to compromise their scoring to balance sensitivity and specificity.
Certainly the efficacy of the Morpheus scoring demonstrates that for high-resolution data, other algorithms do not sufficiently emphasize the number of matching products, perhaps overstressing the abundance of matching fragment peaks. Other algorithms may also use scores that excessively punish for the presence and abundance of unmatched fragment ions, which does not appear necessary as long as abundance filters limit the number of peaks per spectrum. Because of this lack of penalty for unmatched ions, the scoring of Morpheus is quite suitable for chimeric spectra (such as Figure 1, as evidenced by both the MS1 isolation window and the MS/MS spectrum), although it is currently only configured to allow a single peptide match per spectrum.
We next sought to determine the influence of the unique features of Morpheus, aside from its scoring, namely the preprocessing routines: abundance filtering, charge state assignment, and de-isotoping of MS/MS spectra. We searched each dataset several times, combinatorially adding features, to assess their effects. The results are shown in Figure 3. Aside from the Q–OT human dataset, these features do not provide an overwhelming benefit. The Q–OT dataset is very sensitive to the top 400 peaks abundance filtering, likely because a significant population of those MS/MS spectra contain a high number of peaks (Supporting Figure S2). Charge state assignment tended to give a mild benefit; likewise with de-isotoping although to a lesser extent. In some cases de-isotoping actually reduced the number of identifications but overall was a net positive. For most datasets, however, assuming all MS/MS peaks are singly charged and not de-isotoping is an acceptable solution.
Figure 3.

Examination of the impact of abundance filtering (AF), charge state assignment (CSA), and de-isotoping (DI) of MS/MS spectra on the performance of Morpheus for (a) Q–TOF E. coli, (b) dcLIT–OT yeast, (c) dcLIT–OT human, (d) Q–OT human, (e) LIT–OT ETD human, and (f) dcLIT–OT/IT yeast datasets. Surprisingly, aside from abundance filtering to retain the top 400 peaks–the most basic preprocessing–these features do not prove essential, except in the Q–OT and dcLIT–OT/IT datasets. This leaves scoring as the primary explanation for the exceptional performance of Morpheus.
Ultimately, these searches show that the principle explanation for the outstanding results of Morpheus is the scoring. This is encouraging, because it means that for high-resolution MS/MS, naive algorithms are sufficient to provide superior results to commonly used software for peptide identification. Again, the low-resolution datasets (f) showed a dissimilar pattern from the rest, underscoring the fundamentally different nature of this type of data.
To further validate the results of Morpheus, four-way Venn diagrams were constructed in Figure 4 for (a) PSMs, (b) distinct peptides, and (c) protein groups for the second replicate of the Q–OT human dataset. In all cases, there was substantial agreement between the algorithms, with the four-way overlap always being the highest by several fold. However, among all three quantities, Morpheus had at least twice as many identifications that were completely unique to it. The distribution of q-values for PSMs unique to Morpheus is plotted in Supporting Figure S3. Many (~12%) have a q-value of 0%, meaning their scores were better than the best-scoring decoy, and therefore are extremely unlikely to be incorrect.
Figure 4.
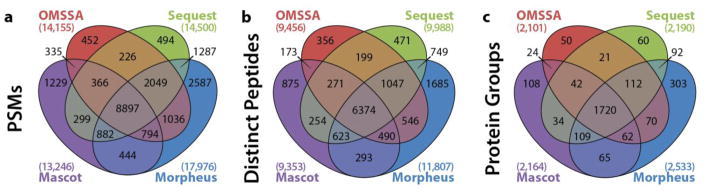
Venn diagrams for Mascot, OMSSA, Sequest, and Morpheus for the second replicate of the Q–OT human dataset at the (a) PSM, (b) distinct peptide, and (c) protein group levels. The massive overlap of all four algorithms underscores the reliability of the results, although Morpheus had the most identifications unique to it for all three metrics.
Pseudo–receiver operating characteristic (ROC) curves were also constructed for this dataset. In Figure 5, the number of (a) target PSMs, (b) distinct target peptides, and (c) target protein group identifications are plotted against FDR. Reflecting Figure 2d, the Morpheus ROC curves are highest at 1% FDR, followed by Sequest, OMSSA, then Mascot (the latter two are flipped for protein groups). Parts (a) and (b) also reveal an interesting trend in the Morpheus results–an oscillatory pattern, indicating stretches of higher-than-expected numbers of target or decoy identifications. This is understandable given the Morpheus scoring, in which the secondary component (fraction of abundance matched) is given much less weight than the primary component (number of matching products). The oscillatory behavior is indicative that the secondary component of the score is given too little weight relative to the primary component. The vertical jumps always appear at a transition between n matching products with a relatively low fraction of abundance matched to n−1 matching products with a relatively high fraction of abundance matched. The former identifications have a relatively high FDR, leading to a shallow slope, while the latter identifications have a relatively low FDR, leading to a steep slope. This process repeats at every transition. Although this behavior appears to have minimal adverse effects on algorithm performance, presumably it could be corrected by weighting the fraction of abundance matched more heavily, which would smooth out the ROC curve.
Figure 5.

Pseudo-ROC curves (identifications versus FDR) for Mascot, OMSSA, Sequest, and Morpheus for the second replicate of the Q–OT human dataset at the (a) PSM, (b) distinct peptide, and (c) protein group levels. The dashed line indicates the 1% FDR threshold, at which Morpheus had the most identifications for all three metrics. The oscillatory behavior of the Morpheus curves in (a) and (b) is due to the simple score, but does not seem to have any practical negative impact.
Morpheus is also substantially faster than any of the other search algorithms tested. This is despite that it was written in C#.NET, a high-level programming language, which is typically assumed to be slower than the lower-level C and C++ languages which the other algorithms were written in. We performed a head-to-head comparison between Morpheus and OMSSA, as those algorithms were informally judged to be the fastest by a large margin and also because they were designed to be launched from the command line, facilitating an automated benchmark. We performed ten searches of the second replicate of each of the high–mass accuracy datasets, alternating between the two algorithms, and recorded the amount of time elapsed. All searches were performed on a Dell PowerEdge 2900 server with dual quad-core 3 GHz Intel Xeon processors and 32 GB of RAM running 64-bit Windows Server 2003 R2. Figure 6 displays the results of the speed comparison where both algorithms were instructed to use 8 threads, equal to the number of processor cores available.
Figure 6.

Speed comparison of OMSSA and Morpheus. Both algorithms were specified to use 8 threads, the maximum practical for the computer used which had dual quad-core processors. Note the y-axis is base-10 logarithmic. Morpheus ranges from 1.5 to 4.6 times faster than OMSSA, with the largest increases for large databases and large datasets (i.e. high number of MS/MS spectra).
Morpheus ranges from roughly 1.5 to 4.6 times faster than OMSSA. The improvement increases with higher numbers of MS/MS spectra and larger protein databases. Interestingly, when both algorithms were run with only a single thread, OMSSA was faster for all but the Q–OT human dataset (Supporting Figure S4), which contains a high number of MS/MS spectra and a large protein database. This suggests that Morpheus performs multithreading more efficiently. This is accomplished by simply dividing the proteins among the available threads. Another feature of Morpheus that contributes to its speed, particularly for large datasets, is that it keeps a history of the peptide sequences that have already been searched, although this mode can be disabled to conserve memory for larger protein databases such as those containing multiple organisms. A speed comparison with this feature enabled and disabled is also included in Supporting Figure S4.
Morpheus shares some features with the Andromeda search algorithm18 developed by the Mann lab and integrated into MaxQuant19. Both are written in C#.NET and are designed to be run on personal computers as opposed to the client–server model typified by Mascot. Andromeda also uses relatively simplistic, albeit still probability-based, scoring. However, Andromeda considers neutral losses while Morpheus only searches for mainline product types (i.e. b, y, c, and z•). Additionally, Andromeda uses a top n peaks per 100 Th as opposed to across the entire spectrum range like Morpheus, and Andromeda also optimizes n on a per-spectrum and per–100 Th interval while Morpheus just uses a global threshold for all spectra.
We attempted to include Andromeda in our comparison, but several factors prohibited this. It only accepts Thermo.raw files. It also does not allow the user to provide custom concatenated target–decoy databases, but rather generates its own from a target-only FASTA file. Precursor mass tolerance can only be specified in parts per million and not daltons. Finally, it does not provide output in pepXML format. These issues prevented a fair comparison and the informational value of such a flawed comparison would be very limited. The authors of Andromeda say it mirrors the performance of Mascot, which we have included in our comparison, with the caveat that they use a more extensive FDR determination which may yield more identifications.
Morpheus is designed to be extremely easy to use and is available through either a graphical user interface (Supporting Figure S5) or a command-line interface. It accepts mzML as input and thus is compatible with virtually any mass spectrometer. Unique among the search algorithms tested, it accepts protein databases in the FASTA format without requiring conversion and, in most cases, central management. Concatenated target–decoy databases can be provided by the user or generated on the fly. FDR calculations are performed automatically at the PSM, distinct peptide, and protein group levels. Morpheus is available for download, both as a Windows executable and source code as a Microsoft Visual Studio 2010 solution, at http://www.chem.wisc.edu/~coon/software.php#morpheus. It is available open source through the permissive MIT License which allows commercial use. In addition to the generic version used for this manuscript that accepts mzML files, we also provide a version that accepts Agilent.d directories and a version that accepts Thermo.raw files. These versions use the vendor charge state assignment and de-isotoping routines, if available, for MS/MS spectral preprocessing.
We have also provided everything necessary to reproduce the results presented here, with the exception of the commercial search algorithms (Sequest and ZCore of Proteome Discoverer, and Mascot), at http://www.chem.wisc.edu/~coon/Downloads/Morpheus/. This includes raw data in Agilent.d or Thermo.raw format, data after conversion to mzML, FASTA protein databases, parameters, scripts, executables (OMSSA, ProteoWizard, and Morpheus), and outputs.
Conclusion
With Morpheus, we demonstrate a rare combination of speed, simplicity, and sensitivity for the analysis of high–mass accuracy data. Remarkably, we show that straightforward algorithms and scoring yield superior performance to popular search algorithms at significantly higher speed. We note that in this comparison, FDR is calculated on the basis of a single score instead of with more advanced methods such as PeptideProphet40 or Percolator41. Nonetheless, it is remarkable that the single score used, which is little more than the number of matching products, proved to be more effective at discriminating correct and incorrect identifications than the more advanced scores employed in popular search algorithms. We believe these results merit a reevaluation of peptide identification in the era of high mass–accuracy MS/MS.
Supplementary Material
Acknowledgments
We thank Derek Bailey, Laurakay Bruhn, A.J. Bureta, Norton Kitagawa, Violet Lee, Anoop Mayampurath, Christine Miller, Pat Perkins, Doug Phanstiel, Javier Satulovsky, and Wilfred Tang for their various contributions. This work was supported in part by the United States National Institutes of Health (grant R01 GM080148 to J.J.C.).
Footnotes
Supporting Table S1: Summary of the six datasets used for comparison, Supporting Table S2: Comparison of Mascot fragmentation rules for the five collisional datasets, Supporting Figure S1: Morpheus score versus precursor mass error for the second replicate of the Q–OT human dataset, Supporting Figure S2: Distributions of the number of peaks per MS/MS spectrum for each of the six datasets, Supporting Figure S3: Distribution of q-values for PSMs uniquely identified by Morpheus for the second replicate of the Q–OT human dataset, Supporting Figure S4: Extended speed comparison of OMSSA and Morpheus, and Supporting Figure S5: Screenshot of the Morpheus graphical user interface. This material is available free of charge via the Internet at http://pubs.acs.org.
References
- 1.Morris HR, Paxton T, Dell A, Langhorne J, Berg M, Bordoli RS, Hoyes J, Bateman RH. High sensitivity collisionally-activated decomposition tandem mass spectrometry on a novel quadrupole/orthogonal-acceleration time-of-flight mass spectrometer. Rapid Commun Mass Sp. 1996;10:889–896. doi: 10.1002/(SICI)1097-0231(19960610)10:8<889::AID-RCM615>3.0.CO;2-F. [DOI] [PubMed] [Google Scholar]
- 2.Kristensen DB, Imamura K, Miyamoto Y, Yoshizato K. Mass spectrometric approaches for the characterization of proteins on a hybrid quadrupole time-of-flight (Q-TOF) mass spectrometer. Electrophoresis. 2000;21:430–439. doi: 10.1002/(SICI)1522-2683(20000101)21:2<430::AID-ELPS430>3.0.CO;2-0. [DOI] [PubMed] [Google Scholar]
- 3.Loboda AV, Krutchinsky AN, Bromirski M, Ens W, Standing KG. A tandem quadrupole/time-of-flight mass spectrometer with a matrix-assisted laser desorption/ionization source: design and performance. Rapid Commun Mass Sp. 2000;14:1047–1057. doi: 10.1002/1097-0231(20000630)14:12<1047::AID-RCM990>3.0.CO;2-E. [DOI] [PubMed] [Google Scholar]
- 4.Syka JEP, Marto JA, Bai DL, Horning S, Senko MW, Schwartz JC, Ueberheide B, Garcia B, Busby S, Muratore T, Shabanowitz J, Hunt DF. Novel linear quadrupole ion trap/FT mass spectrometer: Performance characterization and use in the comparative analysis of histone H3 post-translational modifications. J Proteome Res. 2004;3:621–626. doi: 10.1021/pr0499794. [DOI] [PubMed] [Google Scholar]
- 5.Makarov A, Denisov E, Kholomeev A, Baischun W, Lange O, Strupat K, Horning S. Performance evaluation of a hybrid linear ion trap/orbitrap mass spectrometer. Anal Chem. 2006;78:2113–2120. doi: 10.1021/ac0518811. [DOI] [PubMed] [Google Scholar]
- 6.Aebersold R, Mann M. Mass spectrometry-based proteomics. Nature. 2003;422:198–207. doi: 10.1038/nature01511. [DOI] [PubMed] [Google Scholar]
- 7.Yates JR, Cociorva D, Liao LJ, Zabrouskov V. Performance of a linear ion trap-orbitrap hybrid for peptide analysis. Anal Chem. 2006;78:493–500. doi: 10.1021/ac0514624. [DOI] [PubMed] [Google Scholar]
- 8.Mann M, Kelleher NL. Precision proteomics: The case for high resolution and high mass accuracy. Proc Natl Acad Sci U S A. 2008;105:18132–18138. doi: 10.1073/pnas.0800788105. [DOI] [PMC free article] [PubMed] [Google Scholar]
- 9.Boyne MT, Garcia BA, Li MX, Zamdborg L, Wenger CD, Babai S, Kelleher NL. Tandem Mass Spectrometry with Ultrahigh Mass Accuracy Clarifies Peptide Identification by Database Retrieval. J Proteome Res. 2009;8:374–379. doi: 10.1021/pr800635m. [DOI] [PMC free article] [PubMed] [Google Scholar]
- 10.Olsen JV, Schwartz JC, Griep-Raming J, Nielsen ML, Damoc E, Denisov E, Lange O, Remes P, Taylor D, Splendore M, Wouters ER, Senko M, Makarov A, Mann M, Horning S. A Dual Pressure Linear Ion Trap Orbitrap Instrument with Very High Sequencing Speed. Mol Cell Proteomics. 2009;8:2759–2769. doi: 10.1074/mcp.M900375-MCP200. [DOI] [PMC free article] [PubMed] [Google Scholar]
- 11.McAlister GC, Phanstiel D, Wenger CD, Lee MV, Coon JJ. Analysis of Tandem Mass Spectra by FTMS for Improved Large-Scale Proteomics with Superior Protein Quantification. Anal Chem. 2010;82:316–322. doi: 10.1021/ac902005s. [DOI] [PMC free article] [PubMed] [Google Scholar]
- 12.Phanstiel DH, Brumbaugh J, Wenger CD, Tian SL, Probasco MD, Bailey DJ, Swaney DL, Tervo MA, Bolin JM, Ruotti V, Stewart R, Thomson JA, Coon JJ. Proteomic and phosphoproteomic comparison of human ES and iPS cells. Nat Methods. 2011;8:821–U84. doi: 10.1038/nmeth.1699. [DOI] [PMC free article] [PubMed] [Google Scholar]
- 13.Eng JK, Searle BC, Clauser KR, Tabb DL. A Face in the Crowd: Recognizing Peptides Through Database Search. Mol Cell Proteomics. 2011:10. doi: 10.1074/mcp.R111.009522. [DOI] [PMC free article] [PubMed] [Google Scholar]
- 14.Eng JK, McCormack AL, Yates JR. An Approach to Correlate Tandem Mass-Spectral Data of Peptides with Amino-Acid-Sequences in a Protein Database. J Am Soc Mass Spectrom. 1994;5:976–989. doi: 10.1016/1044-0305(94)80016-2. [DOI] [PubMed] [Google Scholar]
- 15.Perkins DN, Pappin DJC, Creasy DM, Cottrell JS. Probability-based protein identification by searching sequence databases using mass spectrometry data. Electrophoresis. 1999;20:3551–3567. doi: 10.1002/(SICI)1522-2683(19991201)20:18<3551::AID-ELPS3551>3.0.CO;2-2. [DOI] [PubMed] [Google Scholar]
- 16.Craig R, Beavis RC. TANDEM: matching proteins with tandem mass spectra. Bioinformatics. 2004;20:1466–1467. doi: 10.1093/bioinformatics/bth092. [DOI] [PubMed] [Google Scholar]
- 17.Geer LY, Markey SP, Kowalak JA, Wagner L, Xu M, Maynard DM, Yang XY, Shi WY, Bryant SH. Open mass spectrometry search algorithm. J Proteome Res. 2004;3:958–964. doi: 10.1021/pr0499491. [DOI] [PubMed] [Google Scholar]
- 18.Cox J, Neuhauser N, Michalski A, Scheltema RA, Olsen JV, Mann M. Andromeda: A Peptide Search Engine Integrated into the MaxQuant Environment. J Proteome Res. 2011;10:1794–1805. doi: 10.1021/pr101065j. [DOI] [PubMed] [Google Scholar]
- 19.Cox J, Mann M. MaxQuant enables high peptide identification rates, individualized p.p.b.-range mass accuracies and proteome-wide protein quantification. Nat Biotechnol. 2008;26:1367–1372. doi: 10.1038/nbt.1511. [DOI] [PubMed] [Google Scholar]
- 20.Moore RE, Young MK, Lee TD. Qscore: An algorithm for evaluating SEQUEST database search results. J Am Soc Mass Spectrom. 2002;13:378–386. doi: 10.1016/S1044-0305(02)00352-5. [DOI] [PubMed] [Google Scholar]
- 21.Elias JE, Gygi SP. Target-decoy search strategy for increased confidence in large-scale protein identifications by mass spectrometry. Nat Methods. 2007;4:207–214. doi: 10.1038/nmeth1019. [DOI] [PubMed] [Google Scholar]
- 22.Nesvizhskii AI, Vitek O, Aebersold R. Analysis and validation of proteomic data generated by tandem mass spectrometry. Nat Methods. 2007;4:787–797. doi: 10.1038/nmeth1088. [DOI] [PubMed] [Google Scholar]
- 23.Graumann J, Scheltema RA, Zhang Y, Cox J, Mann M. A Framework for Intelligent Data Acquisition and Real-Time Database Searching for Shotgun Proteomics. Mol Cell Proteomics. 2012:11. doi: 10.1074/mcp.M111.013185. [DOI] [PMC free article] [PubMed] [Google Scholar]
- 24.Bailey DJ, Rose CM, McAlister GC, Brumbaugh J, Yu PZ, Wenger CD, Westphall MS, Thomson JA, Coon JJ. Instant spectral assignment for advanced decision tree-driven mass spectrometry. Proc Natl Acad Sci U S A. 2012;109:8411–8416. doi: 10.1073/pnas.1205292109. [DOI] [PMC free article] [PubMed] [Google Scholar]
- 25.Deutsch E. mzML: A single, unifying data format for mass spectrometer output. Proteomics. 2008;8:2776–2777. doi: 10.1002/pmic.200890049. [DOI] [PubMed] [Google Scholar]
- 26.Martens L, Chambers M, Sturm M, Kessner D, Levander F, Shofstahl J, Tang WH, Ropp A, Neumann S, Pizarro AD, Montecchi-Palazzi L, Tasman N, Coleman M, Reisinger F, Souda P, Hermjakob H, Binz PA, Deutsch EW. mzML-a Community Standard for Mass Spectrometry Data. Mol Cell Proteomics. 2011:10. doi: 10.1074/mcp.R110.000133. [DOI] [PMC free article] [PubMed] [Google Scholar]
- 27.Keller A, Eng J, Zhang N, Li XJ, Aebersold R. A uniform proteomics MS/MS analysis platform utilizing open XML file formats. Mol Syst Biol. 2005;1:2005.0017. doi: 10.1038/msb4100024. [DOI] [PMC free article] [PubMed] [Google Scholar]
- 28.Michalski A, Damoc E, Hauschild JP, Lange O, Wieghaus A, Makarov A, Nagaraj N, Cox J, Mann M, Horning S. Mass Spectrometry-based Proteomics Using Q Exactive, a High-performance Benchtop Quadrupole Orbitrap Mass Spectrometer. Mol Cell Proteomics. 2011:10. doi: 10.1074/mcp.M111.011015. [DOI] [PMC free article] [PubMed] [Google Scholar]
- 29.Wenger CD, McAlister GC, Xia QW, Coon JJ. Sub-part-per-million Precursor and Product Mass Accuracy for High-throughput Proteomics on an Electron Transfer Dissociation-enabled Orbitrap Mass Spectrometer. Mol Cell Proteomics. 2010;9:754–763. doi: 10.1074/mcp.M900541-MCP200. [DOI] [PMC free article] [PubMed] [Google Scholar]
- 30.Sadygov RG, Good DM, Swaney DL, Coon JJ. A New Probabilistic Database Search Algorithm for ETD Spectra. J Proteome Res. 2009;8:3198–3205. doi: 10.1021/pr900153b. [DOI] [PMC free article] [PubMed] [Google Scholar]
- 31.Apweiler R, Bairoch A, Wu CH. Protein sequence databases. Curr Opin Chem Biol. 2004;8:76–80. doi: 10.1016/j.cbpa.2003.12.004. [DOI] [PubMed] [Google Scholar]
- 32.UniProt Consortium. Reorganizing the protein space at the Universal Protein Resource (UniProt) Nucleic Acids Res. 2012;40:D71–D75. doi: 10.1093/nar/gkr981. [DOI] [PMC free article] [PubMed] [Google Scholar]
- 33.Wenger CD, Phanstiel DH, Lee MV, Bailey DJ, Coon JJ. COMPASS: A suite of pre- and post-search proteomics software tools for OMSSA. Proteomics. 2011;11:1064–1074. doi: 10.1002/pmic.201000616. [DOI] [PMC free article] [PubMed] [Google Scholar]
- 34.Kessner D, Chambers M, Burke R, Agusand D, Mallick P. ProteoWizard: open source software for rapid proteomics tools development. Bioinformatics. 2008;24:2534–2536. doi: 10.1093/bioinformatics/btn323. [DOI] [PMC free article] [PubMed] [Google Scholar]
- 35.Chambers MC, Maclean B, Burke R, Amodei D, Ruderman DL, Neumann S, Gatto L, Fischer B, Pratt B, Egertson J, Hoff K, Kessner D, Tasman N, Shulman N, Frewen B, Baker TA, Brusniak MY, Paulse C, Creasy D, Flashner L, Kani K, Moulding C, Seymour SL, Nuwaysir LM, Lefebvre B, Kuhlmann F, Roark J, Rainer P, Detlev S, Hemenway T, Huhmer A, Langridge J, Connolly B, Chadick T, Holly K, Eckels J, Deutsch EW, Moritz RL, Katz JE, Agus DB, MacCoss M, Tabb DL, Mallick P. A cross-platform toolkit for mass spectrometry and proteomics. Nat Biotechnol. 2012;30:918–920. doi: 10.1038/nbt.2377. [DOI] [PMC free article] [PubMed] [Google Scholar]
- 36.Good DM, Wenger CD, McAlister GC, Bai DL, Hunt DF, Coon JJ. Post-Acquisition ETD Spectral Processing for Increased Peptide Identifications. J Am Soc Mass Spectrom. 2009;20:1435–1440. doi: 10.1016/j.jasms.2009.03.006. [DOI] [PMC free article] [PubMed] [Google Scholar]
- 37.Good DM, Wenger CD, Coon JJ. The effect of interfering ions on search algorithm performance for electron-transfer dissociation data. Proteomics. 2010;10:164–167. doi: 10.1002/pmic.200900570. [DOI] [PMC free article] [PubMed] [Google Scholar]
- 38.Renard BY, Kirchner M, Monigatti F, Ivanov AR, Rappsilber J, Winter D, Steen JAJ, Hamprecht FA, Steen H. When less can yield more - Computational preprocessing of MS/MS spectra for peptide identification. Proteomics. 2009;9:4978–4984. doi: 10.1002/pmic.200900326. [DOI] [PubMed] [Google Scholar]
- 39.Nesvizhskii AI, Aebersold R. Interpretation of shotgun proteomic data - The protein inference problem. Mol Cell Proteomics. 2005;4:1419–1440. doi: 10.1074/mcp.R500012-MCP200. [DOI] [PubMed] [Google Scholar]
- 40.Keller A, Nesvizhskii AI, Kolker E, Aebersold R. Empirical statistical model to estimate the accuracy of peptide identifications made by MS/MS and database search. Anal Chem. 2002;74:5383–5392. doi: 10.1021/ac025747h. [DOI] [PubMed] [Google Scholar]
- 41.Kall L, Canterbury JD, Weston J, Noble WS, MacCoss MJ. Semi-supervised learning for peptide identification from shotgun proteomics datasets. Nat Methods. 2007;4:923–925. doi: 10.1038/nmeth1113. [DOI] [PubMed] [Google Scholar]
Associated Data
This section collects any data citations, data availability statements, or supplementary materials included in this article.