

Abstract
Background
Chronic intake of ethanol has been linked to serious health consequences such as cardiac and liver problems, cognitive impairments, and brain damage. Alcohol’s detrimental effects depend upon the dose, duration and pattern of exposure with binge drinking as one of the most common, but most damaging, patterns of intake. Little is known about the threshold of the damaging effects of alcohol. Therefore, these experiments sought to determine a threshold for brain damage using various markers of neurodegeneration.
Methods
Adult male Sprague-Dawley rats were administered nutritionally complete liquid diet containing either ethanol (25% w/v) or isocaloric dextrose every 8 hours for either 1 (mean dose: 13.4 ± 0.3 g/kg/day, mean BEC: 336.2 ± 18.8 mg/dl) or 2 days (mean dose: 10.9 ± 0.3 g/kg/day, mean BEC: 369.8 ± 18.1 mg/dl). Based on a known time course of various neurodegeneration-associated events, rats were perfused transcardially immediately following, 2 days after, or 7 days post ethanol exposure. To label actively dividing cells, some animals were injected with BromodeoxyUridine (BrdU) two hours prior to perfusion. Tissue was then analyzed for the presence of BrdU (cell proliferation), FluoroJade B (degenerative neurons), and vimentin (reactive astrogliosis) immunoreactivity.
Results
One or two days of ethanol exposure failed to alter cell proliferation at any of the time points analyzed. However, significant 2 to 9-fold increases in neuronal degeneration in limbic cortex and clear evidence of reactive gliosis as indicated by a 2 to 8-fold upregulation in vimentin immunoreactivity in the hippocampus were observed following as little as one day of binge ethanol exposure.
Conclusions
These results indicate that as little as one day (24 hours) of high BEC, binge-like ethanol exposure is enough to elicit signs of alcohol-induced brain damage in adult rats. Further, reactive gliosis may be a more sensitive marker of alcohol-induced damage in the hippocampus.
Keywords: Alcoholism, Neurodegeneration, Binge, Ethanol
INTRODUCTION
Alcohol is one of the most widely used and abused substances in the world. The extent to which alcohol causes detrimental effects depends upon dose, duration, and pattern of exposure (Rehm et al., 2003) with binge drinking as one of the most common, yet damaging patterns of intake. Binge drinking is defined as consuming five or more drinks for males (four if female) per occasion and as many as 40% of individuals regularly consume alcohol in this manner (Miller et al., 2004; Naimi et al., 2003; SAMHSA, 2010). Unfortunately, binge drinking increases the risk of developing dementia and/or brain damage (Hunt, 1993; Jarvenpaa et al., 2005).
The most common question asked about alcohol is: what is the threshold for damage? Excessive consumption of alcohol has been linked to a broad range of cognitive deficits including impairments in executive functioning, learning, memory, and visiospatial capabilities (Sullivan et al., 2000). According to human neuroimaging studies, these alterations in cognition are associated with structural changes in the central nervous system (Sullivan and Pfefferbaum, 2005). Rodent models of ethanol exposure, however, have been necessary to provide the causal link between excessive alcohol consumption and neurodegeneration (e.g. Walker et al., 1980), and specifically the greater damaging effects of binge pattern intake (e.g. Bonthius and West, 1990). In vivo, alcohol-induced neurodegeneration has been investigated primarily in a modified version of the Majchrowicz four-day binge model of alcohol dependence (Majchrowicz, 1975) where limbic cortices and the ventral dentate gyrus are strikingly labeled by amino cupric silver stain for degenerating cells (Collins et al., 1996; Crews et al., 2000; Crews et al., 2004a; Obernier et al., 2002b). This model has allowed for the discovery that degenerative neurons are evident following as little as two days of binge ethanol exposure, peaks around four days of exposure, and returns to control levels by seven or fourteen days post exposure (Crews and Nixon, 2009; Kelso et al., 2011; Obernier et al., 2002a). However, the damage following the shortest binge duration (two days) was only reported in the olfactory bulb (Obernier et al., 2002a).
Alcoholic neuropathology is more than just neuronal loss (Sullivan and Pfefferbaum, 2005), which means that other indices should be considered to fully appreciate alcohol-induced neurodegeneration. For example, alcohol-induced effects on neural stem cells and adult neurogenesis contribute significantly to neurodegeneration in the hippocampus (Morris et al., 2010a). Conversely, reactive neurogenesis, a potential mechanism of endogenous recovery following brain injury (Blaiss et al., 2011), occurs following the four-day binge, but may also serve as an indicator of brain insult (Chirumamilla et al., 2002; Dash et al., 2001; Liu et al., 1998; Parent et al., 1997). Glial events such as reactive astrogliosis are well accepted as indicators of damage in models of CNS injury (Sofroniew and Vinters, 2010; Zhang et al., 2010). Indeed, recent work examining reactive astrogliosis after four-day binge exposure suggests that alcohol-induced damage may be more pervasive than indicated with traditional degeneration markers such as silver stain or FluoroJade (Kelso et al., 2011). In order to fully investigate the threshold for alcohol-induced brain damage, multiple sensitive measures of brain injury should be explored in short term binge models. Further, many of these alternative indicators of insult have a timeline of expression that is quite different from cell death. Therefore, these experiments examined the threshold of alcohol-induced brain damage using a variety of markers of neurodegeneration: cell death/degeneration, reactive cell proliferation and reactive astrogliosis at various timepoints following one and two days of binge-like ethanol exposure.
MATERIALS AND METHODS
Animal Model
Subjects
Ninety-eight adult male Sprague-Dawley rats (317.8 ± 2.1 g; approximately 70 days old; Charles River Laboratories, Raleigh, NC) were used across six experiments. Rats were housed individually in the University of Kentucky vivarium and allowed to acclimate for five days before initiation of experiments. On three days during the acclimation period, rats were exposed to gentle handling. Following acclimation, rats were assigned to either one or two days of binge ethanol exposure and to one of three sacrifice time points after the last dose of ethanol: T0 (0 hours post last dose), T48, or T168 hours. Rats were maintained on a 12-hour light:dark cycle with ad libitum access to chow and water except where noted. All protocols were conducted in accordance with the NIH Guide for the Care and Use of Laboratory Animals and were approved by the University of Kentucky Institutional Animal Care and Use Committee prior to experimentation.
Binge ethanol administration
Animals were exposed to ethanol following a binge paradigm as described previously but with shorter durations (Knapp and Crews, 1999; Majchrowicz, 1975; Nixon and Crews, 2004). Briefly, animals received a nutritionally complete liquid diet containing either ethanol (25% w/v) or isocaloric amounts of dextrose in Vanilla Ensure Plus® via intragastric gavage every eight hours for either one day (1D; three feedings) or two days (2D; six feedings). Ethanol exposed rats received an initial dose of 5 g/kg with subsequent doses titrated based on the following six-point behavioral intoxication scale: 0, normal rat (5 g/kg); 1, hypoactive (4 g/kg); 2, ataxic (3 g/kg); 3, delayed righting reflex (2 g/kg); 4, loss of righting reflex (1 g/kg); 5, loss of eye blink reflex (0 g/kg). Control rats received a volume of diet equal to the average volume administered to the ethanol rats. Food was removed during binge treatment but was returned to the cages following the last diet administration. Animals were sacrificed at T0, T48, or T168. Two hours prior to perfusion, animals in the 1D+T48, 1D+T168, 2D+T48, and 2D+T168 groups were injected with Bromo-deoxy-Uridine (BrdU; 300mg/kg, i.p., Sigma-Aldrich, St. Louis, MO), a thymidine analog, that labels dividing cells. Time points were selected from previous work: microglial proliferation occurs two days after binge ethanol exposure whereas reactive neural stem cell proliferation occurs at seven days post binge (Nixon and Crews, 2004; Nixon et al., 2008).
Blood ethanol concentrations
To verify intoxication, peak blood ethanol concentrations (BECs) were determined from tail blood samples taken 90 minutes after the third dose of ethanol. Blood samples were drawn into heparinized microcentrifuge tubes, centrifuged at 1800 x g for 5 minutes and stored at −20°C until analysis. BECs were determined from serum using an AM1 Alcohol Analyser (Analox, Lunenberg, MA) based on an external 300mg/dl standard.
Withdrawal behavior
Because it was unknown whether animals would experience withdrawal following the shorter (1 or 2 day) binge exposures, withdrawal behavior was observed in the first experiment (1D+T48 and 2D+T48 groups). Identical to previous studies (Morris et al., 2010b), rats were observed in their home cages for 30 minutes of each hour for 17 hours beginning 10 hours after the last ethanol dose. This time frame was chosen as previous work in our laboratory has indicated that BECs remain close to 300 mg/dl 8 hours following the sixth dose of ethanol (equivalent to the last dose in the 2D group; Morris et al., 2010b). Overt withdrawal is highly unlikely until BECs drop below 100 mg/dl (Majchrowicz, 1975). Withdrawal behavior was scored following the scale of Penland et al., (2001). Mean withdrawal behavior was calculated by taking the mean of the highest score achieved each hour whereas the peak withdrawal behavior was the highest score achieved across the 17 hours.
Tissue preparation
At 0, 48, or 168 hours after the last dose of ethanol following either a one or two day binge, rats were sacrificed via anesthetic overdose (Nembutal®, MWI Veterinary Supply, Nampa, ID) followed by transcardial perfusion with 0.1M phosphate buffered saline (PBS, pH 7.4) then 4% paraformaldehyde (PFA). Brains were extracted, postfixed for 24 hours in 4% PFA, and then stored in 0.1M PBS at 4°C until sectioning. Unbiased tissue collection methods were used. Specifically, brains were cut into 40 μm sections on the coronal plane using a vibrating microtome (Leica Microsystems, Wetzlar, Germany) beginning at a random start point around Bregma 1.6 through Bregma −6.3 as confirmed by anatomical landmarks in Paxinos and Watson (2009). Sections were collected in a 1:12 series such that 12 series of sections 480 μm apart are collected for the entire rostral to caudal extent of the hippocampus and associated limbic cortex, the regions damaged in this model. Tissue was then stored in cryoprotectant in 24-well plates at −20°C until processing.
Immunohistochemistry
DAB
Standard immunohistochemistry protocols for free-floating sections were used to identify the various aspects of neurodegeneration in this model: reactive cell proliferation (mouse anti-BrdU 1:5000, Millipore, Temecula, CA), reactive astrogliosis (mouse anti-Vimentin 1:750; Millipore, Temecula, CA), and neuronal number (mouse anti-NeuN 1:60,000, Millipore, Temecula, CA). Vimentin and NeuN immunohistochemistry were conducted on adjacent sections for every 12th section (single well of the 1:12 series) while every 6th section (2 wells, therefore 240 μm apart) was used for BrdU. With the exception of DNA denaturing steps for BrdU (Nixon and Crews, 2002; Nixon and Crews, 2004), assays followed a similar protocol and were performed in batches by time point. Briefly, sections were rinsed in Tris-buffered saline (TBS), endogenous peroxidases quenched in 0.6% hydrogen peroxide, rinsed again in TBS and blocked (3% normal serum as appropriate and 0.1% Triton-X in TBS) for 30 minutes before overnight incubation in primary antibody at 4°C. After washing in blocking buffer, sections were incubated in species appropriate biotinylated secondary antibody and 1.5% normal serum (Vector Laboratories, Burlingame, CA) for 1 h, rinsed in TBS and incubated in an avidin-biotin horseradish peroxidase macromolecular complex for 1 h (Vector Laboratories, Burlingame, CA). The complex was then detected using nickel-enhanced 3,3′-diaminobenzidine tetrahydrochloride (DAB; Polysciences, Waltham, MA) as a chromagen. Sections were rinsed in TBS, mounted on glass slides, lightly counterstained if necessary, and coverslipped using Cytoseal® (Richard Allen Scientific, Kalamazoo, MI).
Fluorescent
To verify that vimentin upregulation was occurring in astrocytes, adjacent sections were subjected to dual fluorescent labeling for vimentin (mouse anti-vimentin 1:400, Millipore, Temecula, CA) and Glial Fibrillary Acidic Protein (GFAP; rabbit anti-GFAP 1:2500, Dako, Carpinteria, CA), a mature astrocyte marker following the exact protocol in Kelso et al., 2011. Briefly, sections were blocked in 10% goat serum with 0.1% Triton-X in TBS for 30 minutes followed by overnight incubation in primary antibodies at 4°C. After multiple washes in blocking buffer sections were incubated in appropriate fluorescent-coupled secondary antibodies [Alexa-fluor® goat anti-mouse 488 and Alexa-fluor® goat anti-rabbit 546 (Invitrogen, Carlsbad, CA)]. Sections were rinsed and coverslipped with ProLong Gold® antifade mounting medium (Invitrogen). All steps from secondary forward were conducted in dark, opaque boxes.
FluoroJade B labeling
Degenerating cells were detected by FluoroJade B (FJB) staining which was conducted according to the methods of Schmued and Hopkins (2000) identical to that previously reported (Leasure and Nixon, 2010; Morris et al., 2010a). Every 12th section was mounted on Superfrost Plus® slides (Fisher Scientific, Waltham, MA), dried overnight and processed for FJB (Millipore, Temecula, CA). Specifically, slides were exposed to 1% NaOH in 80% ethanol, 70% ethanol, dH2O, and then 0.06% KMnO4 for 10 minutes. Following a wash in dH20, slides were incubated in FJB for 20 minutes in the dark. Slides were then washed in dH20, dried, and coverslipped with Cytoseal® (Richard Allen Scientific, Kalamazoo, MI). All steps from FJB incubation onward were conducted in dark, opaque boxes.
Quantification
Brains were coded such that the observer was blind to the treatment condition. BrdU positive cells in the dentate gyrus of the hippocampus were counted using a profile counting methodology on an Olympus BX-41 microscope (Olympus, Center Valley, PA) with a 100x oil immersion objective. Specifically, cells located in the granular cell layer of dorsal hippocampal sections were counted and presented as mean cells/section. Profile counts were chosen as the optical fractionator, a stereology method, is not appropriate for single dose, BrdU-labeled cells: profiles are nonhomogenously distributed and number fewer than 30 in each section (Noori and Fornal, 2011; Popken and Farel, 1997). Further, we have previously shown identical percent change in alcohol-induced effects on BrdU+ cell number using profile counts, image analysis estimates or stereological estimates (Crews et al., 2004b).
FluoroJade B staining, Vimentin and NeuN immunoreactivity, and initial visual inspection of vimentin and GFAP colabeling were examined using an Olympus BX-51 fluorescent-capable microscope equipped with a Proscan II motorized stage, and DP70 digital camera. For FJB and vimentin, only regions with distinct staining/immunoreactivity were selected for quantification. FJB+ cells were counted using a profile counting method identical to that in Leasure and Nixon (2010) in the piriform and combined entorhinal/perirhinal cortices using a 40X objective. FJB-positive (FJB+) cells were not quantified in the hippocampus, as no cells were visible upon inspection. Vimentin immunoreactivity was quantified using VIS image analysis software (version 3.6.4.0, Visiopharm, Hoersholm, Denmark) as reported previously (Kelso et al., 2011) in the hippocampus. Briefly, images of vimentin immunoreactivity were collected at 100X and regions of interest circumscribed for the dentate gyrus, CA1/2, and CA3 regions according to Paxinos and Watson (2009). Percent area of staining in each region was obtained as pixels/mm2. Because background immunoreactivity varied between batches, data are presented as a percent of respective controls.
NeuN-positive profiles were counted using the NewCast platform within the VIS software. The combined entorhinal/perirhinal cortices were traced at 40X. A 100 × 100 μm frame was randomly placed over the region of interest and the software moved the frame across the tissue using a 300 μm step length. NeuN-positive cells falling entirely within the border of the frame were counted at 200X and data are reported as cells per 100 μm2.
Colocalization of vimentin and GFAP in the hippocampus was visually inspected at the 2D+T168 time point, then colocalization confirmed on a Leica TCS SP5 inverted laser scanning confocal microscope (Wetzlar, Germany). Z-plane optical stacks through the cell were collected at 0.8 μm thickness using a 63x oil immersion lens then analyzed as reported previously (Morris et al., 2010a; Nixon & Crews, 2004).
Statistics
Statistical analysis was performed using SPSS statistics (version 18). All data are represented as mean ± standard error of the mean (SEM). Alcohol model data were analyzed by ANOVA with Tukey’s post hoc tests. For FJB and vimentin data, F tests were performed and confirmed unequal variance. Therefore, FJB counts and vimentin immunoreactivity data were log transformed prior to analysis (in FJB data, zeros were replaced by 0.00000001 for transformation). Data were analyzed using multivariate analysis of variance (ANOVA). A priori planned-comparisons (t-test) were performed between ethanol and control groups at each time point. Significance in all cases was accepted at p < 0.05 (two-tailed).
RESULTS
Animal model data
A summary of ethanol intoxication parameters including BEC, average intoxication score, and daily ethanol dose for each group is presented in Table 1. A two-way ANOVA with binge duration and post treatment time point as the independent variables revealed an expected significant main effect of binge duration on intoxication score [F(1,45) = 41.01, p<0.001] and ethanol dose [F(1,45) = 41.08, p<0.001] with rats given one day of ethanol treatment displaying lower average intoxication scores and therefore receiving a higher daily ethanol dose than the 2D duration animals. However, there was no significant main effect of time point on either intoxication score or dose. Importantly, there was no main effect of duration or time point on BECs. However, analysis did reveal a significant interaction [F(2,33) = 9.04, p<0.01] with higher BECs associated with later time points in the 1D animals and higher BECs noted immediately following ethanol exposure in the 2D ethanol exposed rats. Withdrawal behavior for the 1D and 2D binge animals sacrificed at T48 is presented in Figure 1. One sample t-tests performed on each withdrawal increment revealed that neither one or two days of ethanol treatment yielded withdrawal behaviors which were significantly different than zero suggesting that these exposure paradigms are not sufficient to induce overt withdrawal behavior in our animals. Further, only 4 of 9, 1D and 5 of 9, 2D rats experienced any visually detectable withdrawal at all. Using the four-day adult binge data in Morris et al., 2010, repeated measures ANOVA revealed a significant main effect of binge duration [F(2,79) = 32.54, p<0.001]. Post hoc Tukey’s HSD tests confirmed that withdrawal behaviors following one or two day binge durations were significantly reduced compared to those following a four-day ethanol binge (t < 0.001 for both). Since withdrawal was not noted, withdrawal behavior assessments were not conducted for the 1D+T168 and 2D+T168 groups.
Table 1.
Intoxication Parameters
| BEC ± SEM (mg/dl) |
INTOX ± SEM (0-5 scale) |
DOSE ± SEM (g/kg/day) |
|
|---|---|---|---|
| 1D + T0 (n=8) | 370.5 ± 15.2 | 0.46 ± 0.06 | 13.63 ± 0.18 |
| 1D + T48 (n=9) | 363.5 ± 89.5* | 0.48 ± 0.20 | 13.56 ± 0.60 |
| 1D + T168 (n=8) | 291.6 ± 24.4 | 0.63 ± 0.13 | 13.13 ± 0.40 |
| 2D + T0 (n=8) | 299.9 ± 18.6 | 1.71 ± 0.15 | 9.88 ± 0.46 |
| 2D + T48 (n=9) | 399.0 ± 24.3* | 1.02 ± 0.18 | 11.94 ± 0.54 |
| 2D + T168 (n=9) | 422.3 ± 22.0 | 1.44 ± 0.19 | 10.67 ± 0.58 |
indicates that BECs are calculated from a subset of 3 rats.
Figure 1.
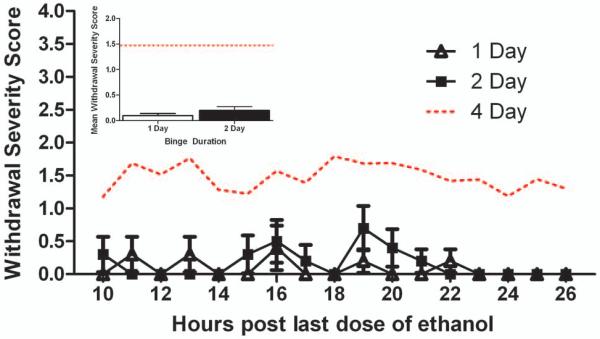
Withdrawal behaviors were scored in animals following one and two day binge exposure for 17 hours beginning 10 hours after the last dose of ethanol. Hourly withdrawal severity scores and average withdrawal severity (inset) are presented. Typical withdrawal severity following the four-day binge is presented for comparison (dotted line; data from Morris et. al. 2010b). No difference in withdrawal behavior was noted between 1D and 2D binge ethanol exposure groups. However, both 1D and 2D binge ethanol groups failed to show the characteristic withdrawal syndrome as is typically observed in the four-day ethanol binge paradigm.
Limited but apparent degenerative neurons after one-day binge exposure
An analysis of degenerative neurons utilizing the anionic dye, FJB, following short-term binge ethanol exposure is presented in Figure 2. Upon visual inspection, FJB+ cells were observed in the piriform cortex and the combined entorhinal and perirhinal cortices. FJB+ cells were therefore counted and reported as cells/section for each region. Because a majority of the treatment groups displayed unequal variance (F test p<0.05), data were log transformed prior to statistical analysis. In the entorhinal/perirhinal cortices, a three way (diet x binge duration x time point) ANOVA on the transformed data revealed a significant main effect of diet with ethanol exposure leading to increased FJB+ cells [F(1,86) = 6.37, p<0.02] and of time point [F(2,86) = 11.83, p<0.001] with the T48 and T168 time points displaying significantly higher amounts of FJB+ cells than T0. Further, there was a main effect of binge duration [F(1,86) = 6.12, p<0.02] suggesting that longer durations binge exposure lead to more degenerating neurons. Planned comparisons using student’s t-test only revealed a very slight, but significant increase in cell death in the ethanol exposed rats at the 2D+T0 time point (p<0.05). In the piriform cortex, a three way (diet x binge duration x time point) ANOVA on the transformed data revealed a significant main effect of binge duration only [F(1,86) = 40.45, p<0.001], again suggesting that longer durations binge exposure lead to more degenerating neurons. Planned comparisons utilizing student’s t-tests were performed and revealed a significant increase in degenerating neurons in the ethanol exposed rats at 1D+T48, 2D+T0, and 2D+T48 time points (p<0.05).
Figure 2.

Degenerative neurons at all time points were measured by assessing FluoroJade B positive (FJB+) cells. FJB+ cells were counted in the entorhinal/perirhinal (A,B) and piriform (D,E) cortices of control (A,D) and ethanol-exposed (B,E) animals. Arrows denote representative FJB+ cells. The number of FJB+ cells counted in the entorhinal/perirhinal and piriform cortices are presented as cells/section in panels C and F respectively. Three way ANOVA (binge duration x diet x time point) on the entorhinal/perirhinal combined cortices data revealed significant main effects of diet (p<0.02), time point (p<0.01), and binge duration (p<0.05). In the piriform cortex, three way ANOVA revealed a significant main effect of binge duration (p<0.05). Student’s t-tests performed as planned comparisons revealed a significant increase in degenerating neurons in the entorhinal/perirhinal cortices at the 2D+T0 time point and at the 1D+T48, 2D+T0, and 2D+T48 time points in the piriform cortex. Scale bar = 100 μm; inset scale bar = 20 μm. * indicates a significant difference from respective controls (p<0.05).
Because of the main effects of diet and duration on FJB+ cells and the potential for cumulative cell death to produce significant neuronal loss in the entorhinal/perirhinal cortices, NeuN-positive cells, i.e. neurons, were counted in the 2D+T168 group. The number of NeuN-positive cells did not differ between groups with controls having 8.53 ± 0.86 cells/100 μm2 and ethanol-treated having 9.59 ± 1.52 cells/100 μm2. Thus, despite the statistically significant increase in degenerating neurons, neuronal number was not significantly reduced in the entorhinal/perirhinal cortices.
Reactive cell proliferation not apparent after one or two day binge exposure
A common reaction in damaged brain tissue is cell proliferation, whether in glia or neural stem cells (Ohira, 2011; Robel et al., 2011). The timecourse of these events has been described for four-day binge exposure (Nixon and Crews, 2004; Nixon et al., 2008); therefore we examined these brains for binge-induced proliferation events via BrdU labeling. Sections were inspected visually to determine which regions would be quantified. As shown in Figure 3, the subgranular zone of the hippocampal dentate gyrus had significant BrdU+ labeling as expected. This region contains neural stem cells that underlie the adult formation of new neurons (adult neurogenesis; Kempermann and Gage, 2000; Palmer et al., 1997). BrdU+ cells were counted in this region and presented as mean BrdU+ cells per section. Values in controls were similar to that observed and reported previously for adult rats with a 300mg/kg injection of BrdU (Nixon and Crews, 2004). However, a three way (diet x binge duration x time point) ANOVA failed to reveal any significant main effects or interactions suggesting that shorter durations of binge ethanol exposure do not cause reactive cell proliferation (Figure 3C).
Figure 3.

Bromo-deoxy-uridine (BrdU) is a thymidine analog incorporated into dividing cells during the S phase of the cell cycle. BrdU was injected approximately two hours prior to sacrificing the animal as a marker of cell proliferation. Representative photomicrographs taken with a 10X objective through a coronal plane of the hippocampus in control (A) and ethanol-exposed (B) rats are presented. The arrow denotes the area of inset taken with a 100X oil objective. The number of BrdU+ cells was counted in the subgranular zone of the hippocampal dentate gyrus in approximately 10 sections per animal. The number of BrdU+ cells/section was calculated and can be found in panel C. Three way ANOVA (binge duration x diet x time point) failed to reveal any significant effects suggesting that reactive cell proliferation is not affected by a 1 or 2-day exposure to ethanol at any timepoint. GCL= Granule cell layer. Scale bar = 200 μm; inset scale bar = 20 μm.
Astrogliosis following short-term binge exposure
Because reactive astrogliosis is reported to be a sensitive indicator of cell death in many models of brain injury (Zhang et al., 2010), including the four-day binge (Kelso et al., 2011), we examined the expression of vimentin at several time points following short term binge exposure. As presented in Figure 4, immunoreactivity was quantified at each time point in the dentate gyrus, CA1/2, and CA3 fields of the hippocampus and presented as percent of control. A three way (diet x binge duration x time point) ANOVA revealed significant main effects of binge duration [F(1,84) = 8.32, p<0.01], time point [F(2,84) = 11.84, p<0.001], and diet [F(1,84) = 16.50, p<0.001] in the CA1/2 region. Further, main effects of time point [F(2,84) = 3.90, p<0.05] and diet [F(1,84) = 4.44, p<0.05] were also revealed in the dentate gyrus. Planned t-tests revealed significant increases in vimentin immunoreactivity following ethanol exposure at the 1D+T48 (CA fields only) and 2D+T168 (all hippocampal regions) time points.
Figure 4.

Alterations in vimentin immunoreactivity (IR) in the hippocampus of adult rats are dependent upon binge duration and time point following ethanol exposure. Representative photomicrographs of vimentin staining in the hippocampus of control (A) and ethanol-exposed (C) rats taken with a 10X objective are presented. A higher magnification image of the boxed areas in A and C are presented in panels B and D respectively. The dentate gyrus, CA1/2, and CA3 regions were analyzed separately using densitometry and are presented as percent of control ± SEM since each time point was batch processed separately. Planned comparisons at each time point revealed that animals at the 1D+T48 time point showed an increase in vimentin immunoreactivity compared to controls in the CA regions while a robust upregulation of vimentin expression appears following 2D+T168 in all analyzed regions. * indicates a significant difference from their control (p<0.05). Scale bar = 200 μm (A and C) and 20 μm (B and D).
Although vimentin expression is upregulated in reactive astrocytes (Eddleston and Mucke, 1993; Pekny et al., 2007), it is a well-established marker of radial glia and is expressed in ependymal cells (Schnitzer et al., 1981). To verify that vimentin is expressed in astrocytes in this model, tissue from the 2D+T168 group was processed for dual fluorescent immunohistochemistry for vimentin and mature astroglia marker, GFAP. Figure 5 shows that vimentin is upregulated in the hippocampus of a 2D+T168 ethanol-exposed rat (green; A:Control vs D:Ethanol) and is present in a majority of the GFAP+ cells (red; E), indicating that the labeled cells are astrocytes. Utilizing an orthogonal view of reconstructed z stacks (I) it is clear that vimentin and GFAP are colabelled across all planes. These results support the emergence of reactive astrogliosis following short-term binge ethanol exposure.
Figure 5.

Representative photomicrographs of vimentin (green) and GFAP (red) shown in the hippocampus of rats exposed to two days of ethanol administration and allowed one week of recovery (2D+T168; D-F) or to control diet (A-C). Colocalization is evident in the ethanol-exposed rat (F) but is mostly absent in the control rat (C). Confocal images of a representative cell located in the hilus of a control rat are shown in panels G-I while representative images from an ethanol rat are shown in panels J-L. Although vimentin is thought to be expressed in radial glia, the orthogonal view of reconstructed z-stacks (L) shows that vimentin is clearly expressed in GFAP-containing astrocytes at this time point following ethanol exposure. Images A-F were taken with a 10X dry objective. Scale bar = 200 μm. Images (G-L) were taken with a 63x oil objective. Scale bar = 20 μm. GCL= Granule cell layer; ML = Molecular layer.
DISCUSSION
Decades of evidence have clearly shown that long-term, chronic ethanol exposure produces brain damage in humans (Pfefferbaum et al., 1992; Zahr et al., 2011). Even moderate levels of ethanol may cause brain shrinkage (Verbaten, 2009). However, despite much speculation, the threshold for damage is not known. Here, we report two findings that indicate that as little as one day of binge ethanol exposure results in evidence of brain damage. First, a slight but statistically significant increase in degenerative neurons (FJB+ cells) in piriform cortex was observed following as little as one day of binge ethanol exposure, and a very slight yet significant increase in degenerative neurons in the entorhinal and perirhinal cortices after two days of exposure only. Second, but more robustly, analysis of vimentin immunoreactivity indicates a distinct reactive gliosis event in the hippocampus after merely one day of binge ethanol exposure, a phenomenon that indicates damage.
Although it is well established that the Majchrowicz four-day binge model results in neurodegeneration throughout cortical and limbic regions (Collins et al., 1996; Crews et al., 2000; Obernier et al., 2002a), to our knowledge, no one has observed significant cell death following one day of binge exposure in adult models. Previously, one study reported degenerating neurons in the olfactory bulb only, after two days of ethanol exposure (Obernier et al., 2002a). However, in this prior study, neurodegeneration was examined immediately after the last dose and with amino cupric silver stain, a method that may be less robust in its detection of dying or injured cells versus the FJB used in the current study (Ishida et al., 2004; Schmued and Hopkins, 2000). Silver stain seems to detect degenerating cells relatively early in the process (Ishida et al., 2004; Poirier et al., 2000). Here, degenerating neurons were not observed with FJB until days after exposure (e.g. piriform cortex), which confirms that shown by others that it takes a day or so before FJB is expressed to the point of detection (Poirier et al., 2000). The observed time line is consistent with FJB detecting cells towards a later phase of cell death, (Ishida et al., 2004; Poirier et al., 2000; Schmued and Hopkins, 2000). Despite the observation of FJB+ cells, significant neuronal loss was not observed. Although it remains unclear to what FJB binds, multiple histological indices have shown that FJB+ cells in the four-day binge are indicative of a necrotic form of cell death (Obernier et al., 2002a). This does not change our interpretation that some level of insult or injury occurs following one or two days of binge exposure. Indeed, it supports our rationale to examine multiple indices to determine the extent of insult. Thus, we have now extended the two-day findings to include low, but observable degenerative neurons in the piriform, entorhinal and perirhinal cortices, areas of high levels of cell death in the four-day model (Obernier et al., 2002a).
The second major finding of this work was the upregulation of vimentin expression in hippocampal regions resulting from as little as one day of binge exposure. Upregulation of the intermediate filament, vimentin, is a hallmark of reactive astrogliosis and indicative of CNS damage (Sofroniew and Vinters, 2010). Because vimentin is expressed by radial glia in developing organisms and ependymal cells and immature astrocytes in the adult brain, we confirmed that vimentin upregulation was primarily in mature astrocytes (GFAP-positive) with dual immunofluorescence (Figure 5). Reactive astrogliosis has been observed after various brain insults including traumatic brain injury, seizure, ischemia, and long-term alcohol exposure (Baldwin and Scheff, 1996; Franke, 1995; Moon et al., 2004; Nakagawa et al., 2004; Schmidt-Kastner et al., 1990; Tagliaferro et al., 2002). Indeed, these data contribute to the body of work that have observed astrogliosis in models of alcohol dependence (e.g. Dalcik et al., 2009; Evrard et al., 2006; Franke, 1995) but also suggest that astrogliosis may be occurring in those meeting the lesser criteria of alcohol abuse.
Vimentin upregulation is considered a sensitive indicator of necrosis (Schmidt-Kastner et al., 1990) and cell death in the 4-day binge model is necrotic (Obernier et al., 2002a). Similar to our previous work with the 4-day model, vimentin expression was observed in more regions than FJB+ cells were observed, which supports our previous observations and conclusions that vimentin upregulation may be a more sensitive indicator of damage or insult than degeneration markers (Kelso et al., 2011). Intriguingly, however, significant vimentin expression was not observed in cortical regions even where FJB+ cells were observed. We speculate that this is due to some interaction of dose-dependency (not enough cell death to elicit gliosis) or timing of the analysis. We have shown previously that the peak of vimentin expression is between 4 and 7 days post last dose in the 4-day model (Kelso et al., 2011). Accordingly, we expected to see significant vimentin upregulation at the +168h time points as that is 7 days after the last dose where vimentin upregulation was easily detectable (Kelso et al., 2011). Another possible interpretation is that alcohol is targeting glia in the hippocampus (Korbo, 1999) as FJB is a stain for neuronal degeneration (Schmued and Hopkins, 2000). Astrocytes may be more vulnerable to alcohol toxicity (Babu et al., 1994), which leads some to speculate that glia are damaged first, then the loss of glia causes neurons to deteriorate (Korbo, 1999).
Because various cell proliferation events have been observed following 4-day binge exposure, we examined BrdU incorporation into dividing cells at two (microglia proliferation; Nixon et al., 2008) and seven (neural stem cell proliferation; Nixon and Crews, 2004) days following one or two days of binge exposure. No differences in cell proliferation were observed at any time point examined (Figure 3), although it is possible that shorter alcohol exposures result in a different time course of proliferation events and the effect was missed. This lack of effect suggests two important interpretations: a) modest damage does not induce reactive neurogenesis and b) no compensatory or reactive neurogenesis is observed after extended alcohol inhibition of neurogenesis. Further, modest damage does not cause moderate microglial reactivity, though low-grade microglial activation may have occurred but was not investigated in this study (McClain et al., 2011; Nimmerjahn et al., 2005). Similarly, the lack of any reactive cell proliferation, which would also include astroglia, supports that the astrogliosis response is also moderate as astrocytes only divide in severe astrogliosis (Sofroniew and Vinters, 2010).
Finally, it is important to note that vimentin was upregulated in these short-term binge models despite no observable withdrawal seizures. Despite clinically relevant blood ethanol levels for 24 to 48 hours, no overt withdrawal symptoms were observed. This observation supports that alcohol-induced cell death occurs without withdrawal (Collins et al., 1996; Obernier et al., 2002a). Coupled with our prior observation of increased vimentin expression despite pharmacologically reduced withdrawal severity, these results also suggest that astrocytes are reacting to cell death and not to alcohol withdrawal seizures (Kelso et al., 2011; Stringer, 1996).
Several important points are relevant to the human condition, and namely alcohol use disorders (AUDs). First, the damage observed was modest, and even where FJB+ cells were observed in the entorhinal cortex after two days of exposure; significant neuronal loss was not observed. The lack of significant structural loss suggests that a single, short-term binge does not likely result in functional changes (e.g. cognitive performance deficits). However, alcoholics binge more than once. The cumulative effect of multiple binges is evident in animal models where a host of cognitive, behavioral and neurodegenerative effects have been reported (Pascual et al., 2007; Ward et al., 2009). The current study examined the minimum threshold for evidence of damage in adult rats. Understanding the timeline and threshold of when damage occurs is critical to uncovering the mechanism of alcohol-induced damage and developing novel treatments for alcohol-induced neurodegeneration and alcohol use disorders.
Acknowledgements
We gratefully acknowledge Geraldyne Tiu for help with producing the animal model and Holly Beisner for her technical assistance. This work was supported by the National Institute on Alcohol Abuse and Alcoholism grant R01AA016959 (to KN), the National Institute on Drug Abuse grant T32DA007304 (to DMH) and the UK Department of Pharmaceutical Sciences Summer Undergraduate Research Program.
Footnotes
Support: This work was supported by the National Institute on Alcohol Abuse and Alcoholism grant R01AA016959 and the National Institute on Drug Abuse grant T32DA007304.
References
- Babu PP, Kumari LR, Vemuri MC. Differential changes in cell morphology, macromolecular composition and membrane protein profiles of neurons and astrocytes in chronic ethanol treated rats. Mol Cell Biochem. 1994;130:29–40. doi: 10.1007/BF01084265. [DOI] [PubMed] [Google Scholar]
- Baldwin SA, Scheff SW. Intermediate filament change in astrocytes following mild cortical contusion. Glia. 1996;16:266–275. doi: 10.1002/(SICI)1098-1136(199603)16:3<266::AID-GLIA9>3.0.CO;2-#. [DOI] [PubMed] [Google Scholar]
- Blaiss CA, Yu TS, Zhang G, Chen J, Dimchev G, Parada LF, Powell CM, Kernie SG. Temporally specified genetic ablation of neurogenesis impairs cognitive recovery after traumatic brain injury. J Neurosci. 2011;31:4906–4916. doi: 10.1523/JNEUROSCI.5265-10.2011. [DOI] [PMC free article] [PubMed] [Google Scholar]
- Bonthius DJ, West JR. Alcohol-induced neuronal loss in developing rats: increased brain damage with binge exposure. Alcohol Clin Exp Res. 1990;14:107–118. doi: 10.1111/j.1530-0277.1990.tb00455.x. [DOI] [PubMed] [Google Scholar]
- Chirumamilla S, Sun D, Bullock MR, Colello RJ. Traumatic brain injury induced cell proliferation in the adult mammalian central nervous system. J Neurotrauma. 2002;19:693–703. doi: 10.1089/08977150260139084. [DOI] [PubMed] [Google Scholar]
- Collins MA, Corse TD, Neafsey EJ. Neuronal degeneration in rat cerebrocortical and olfactory regions during subchronic “binge” intoxication with ethanol: possible explanation for olfactory deficits in alcoholics. Alcohol Clin Exp Res. 1996;20:284–292. doi: 10.1111/j.1530-0277.1996.tb01641.x. [DOI] [PubMed] [Google Scholar]
- Crews FT, Braun CJ, Hoplight B, Switzer RC, 3rd, Knapp DJ. Binge ethanol consumption causes differential brain damage in young adolescent rats compared with adult rats. Alcohol Clin Exp Res. 2000;24:1712–1723. [PubMed] [Google Scholar]
- Crews FT, Collins MA, Dlugos C, Littleton J, Wilkins L, Neafsey EJ, Pentney R, Snell LD, Tabakoff B, Zou J, Noronha A. Alcohol-induced neurodegeneration: when, where and why? Alcohol Clin Exp Res. 2004a;28:350–364. doi: 10.1097/01.alc.0000113416.65546.01. [DOI] [PubMed] [Google Scholar]
- Crews FT, Nixon K. Mechanisms of neurodegeneration and regeneration in alcoholism. Alcohol Alcohol. 2009;44:115–127. doi: 10.1093/alcalc/agn079. [DOI] [PMC free article] [PubMed] [Google Scholar]
- Crews FT, Nixon K, Wilkie ME. Exercise reverses ethanol inhibition of neural stem cell proliferation. Alcohol. 2004b;33:63–71. doi: 10.1016/j.alcohol.2004.04.005. [DOI] [PubMed] [Google Scholar]
- Dalcik H, Yardimoglu M, Filiz S, Gonca S, Dalcik C, Erden BF. Chronic ethanol-induced glial fibrillary acidic protein (GFAP) immunoreactivity: an immunocytochemical observation in various regions of adult rat brain. Int J Neurosci. 2009;119:1303–1318. doi: 10.1080/00207450802333672. [DOI] [PubMed] [Google Scholar]
- Dash PK, Mach SA, Moore AN. Enhanced neurogenesis in the rodent hippocampus following traumatic brain injury. J Neurosci Res. 2001;63:313–319. doi: 10.1002/1097-4547(20010215)63:4<313::AID-JNR1025>3.0.CO;2-4. [DOI] [PubMed] [Google Scholar]
- Eddleston M, Mucke L. Molecular profile of reactive astrocytes--implications for their role in neurologic disease. Neuroscience. 1993;54:15–36. doi: 10.1016/0306-4522(93)90380-X. [DOI] [PMC free article] [PubMed] [Google Scholar]
- Evrard SG, Duhalde-Vega M, Tagliaferro P, Mirochnic S, Caltana LR, Brusco A. A low chronic ethanol exposure induces morphological changes in the adolescent rat brain that are not fully recovered even after a long abstinence: an immunohistochemical study. Exp Neurol. 2006;200:438–459. doi: 10.1016/j.expneurol.2006.03.001. [DOI] [PubMed] [Google Scholar]
- Franke H. Influence of chronic alcohol treatment on the GFAP-immunoreactivity in astrocytes of the hippocampus in rats. Acta Histochem. 1995;97:263–271. doi: 10.1016/S0065-1281(11)80187-X. [DOI] [PubMed] [Google Scholar]
- Hunt WA. Are binge drinkers more at risk of developing brain damage? Alcohol. 1993;10:559–561. doi: 10.1016/0741-8329(93)90083-z. [DOI] [PubMed] [Google Scholar]
- Ishida K, Shimizu H, Hida H, Urakawa S, Ida K, Nishino H. Argyrophilic dark neurons represent various states of neuronal damage in brain insults: some come to die and others survive. Neuroscience. 2004;125:633–644. doi: 10.1016/j.neuroscience.2004.02.002. [DOI] [PubMed] [Google Scholar]
- Jarvenpaa T, Rinne JO, Koskenvuo M, Raiha I, Kaprio J. Binge drinking in midlife and dementia risk. Epidemiology. 2005;16:766–771. doi: 10.1097/01.ede.0000181307.30826.6c. [DOI] [PubMed] [Google Scholar]
- Kelso ML, Liput DJ, Eaves DW, Nixon K. Upregulated vimentin suggests new areas of neurodegeneration in a model of an alcohol use disorder. Neuroscience. 2011;197:381–393. doi: 10.1016/j.neuroscience.2011.09.019. [DOI] [PMC free article] [PubMed] [Google Scholar]
- Kempermann G, Gage FH. Neurogenesis in the adult hippocampus. Novartis Found Symp. 2000;231:220–241. [PubMed] [Google Scholar]
- Knapp DJ, Crews FT. Induction of cyclooxygenase-2 in brain during acute and chronic ethanol treatment and ethanol withdrawal. Alcohol Clin Exp Res. 1999;23:633–643. [PubMed] [Google Scholar]
- Korbo L. Glial cell loss in the hippocampus of alcoholics. Alcohol Clin Exp Res. 1999;23:164–168. [PubMed] [Google Scholar]
- Leasure JL, Nixon K. Exercise neuroprotection in a rat model of binge alcohol consumption. Alcohol Clin Exp Res. 2010;34:404–414. doi: 10.1111/j.1530-0277.2009.01105.x. [DOI] [PMC free article] [PubMed] [Google Scholar]
- Liu J, Solway K, Messing RO, Sharp FR. Increased neurogenesis in the dentate gyrus after transient global ischemia in gerbils. J Neurosci. 1998;18:7768–7778. doi: 10.1523/JNEUROSCI.18-19-07768.1998. [DOI] [PMC free article] [PubMed] [Google Scholar]
- Majchrowicz E. Induction of physical dependence upon ethanol and the associated behavioral changes in rats. Psychopharmacologia. 1975;43:245–254. doi: 10.1007/BF00429258. [DOI] [PubMed] [Google Scholar]
- McClain JA, Morris SA, Deeny MA, Marshall SA, Hayes DM, Kiser ZM, Nixon K. Adolescent binge alcohol exposure induces long-lasting partial activation of microglia. Brain Behav Immun. 2011;519:2697–2710. doi: 10.1016/j.bbi.2011.01.006. [DOI] [PMC free article] [PubMed] [Google Scholar]
- Miller JW, Gfroerer JC, Brewer RD, Naimi TS, Mokdad A, Giles WH. Prevalence of adult binge drinking: a comparison of two national surveys. Am J Prev Med. 2004;27:197–204. doi: 10.1016/j.amepre.2004.05.004. [DOI] [PubMed] [Google Scholar]
- Moon C, Ahn M, Kim S, Jin JK, Sim KB, Kim HM, Lee MY, Shin T. Temporal patterns of the embryonic intermediate filaments nestin and vimentin expression in the cerebral cortex of adult rats after cryoinjury. Brain Res. 2004;1028:238–242. doi: 10.1016/j.brainres.2004.09.022. [DOI] [PubMed] [Google Scholar]
- Morris SA, Eaves DW, Smith AR, Nixon K. Alcohol inhibition of neurogenesis: a mechanism of hippocampal neurodegeneration in an adolescent alcohol abuse model. Hippocampus. 2010a;20:596–607. doi: 10.1002/hipo.20665. [DOI] [PMC free article] [PubMed] [Google Scholar]
- Morris SA, Kelso ML, Liput DJ, Marshall SA, Nixon K. Similar withdrawal severity in adolescents and adults in a rat model of alcohol dependence. Alcohol. 2010b;44:89–98. doi: 10.1016/j.alcohol.2009.10.017. [DOI] [PMC free article] [PubMed] [Google Scholar]
- Naimi TS, Brewer RD, Mokdad A, Denny C, Serdula MK, Marks JS. Binge drinking among US adults. JAMA. 2003;289:70–75. doi: 10.1001/jama.289.1.70. [DOI] [PubMed] [Google Scholar]
- Nakagawa T, Miyazaki T, Miyamoto O, Janjua NA, Hata T, Itano T. Regional expression of the radial glial marker vimentin at different stages of the kindling process. Epilepsy Res. 2004;61:141–151. doi: 10.1016/j.eplepsyres.2004.07.007. [DOI] [PubMed] [Google Scholar]
- Nimmerjahn A, Kirchhoff F, Helmchen F. Resting microglial cells are highly dynamic surveillants of brain parenchyma in vivo. Science. 2005;308:1314–1318. doi: 10.1126/science.1110647. [DOI] [PubMed] [Google Scholar]
- Nixon K, Crews FT. Binge ethanol exposure decreases neurogenesis in adult rat hippocampus. J Neurochem. 2002;83:1087–1093. doi: 10.1046/j.1471-4159.2002.01214.x. [DOI] [PubMed] [Google Scholar]
- Nixon K, Crews FT. Temporally specific burst in cell proliferation increases hippocampal neurogenesis in protracted abstinence from alcohol. J Neurosci. 2004;24:9714–9722. doi: 10.1523/JNEUROSCI.3063-04.2004. [DOI] [PMC free article] [PubMed] [Google Scholar]
- Nixon K, Kim DH, Potts EN, He J, Crews FT. Distinct cell proliferation events during abstinence after alcohol dependence: microglia proliferation precedes neurogenesis. Neurobiol Dis. 2008;31:218–229. doi: 10.1016/j.nbd.2008.04.009. [DOI] [PMC free article] [PubMed] [Google Scholar]
- Noori HR, Fornal CA. The appropriateness of unbiased optical fractionators to assess cell proliferation in the adult hippocampus. Front Neurosci. 2011;5:140. doi: 10.3389/fnins.2011.00140. [DOI] [PMC free article] [PubMed] [Google Scholar]
- Obernier JA, Bouldin TW, Crews FT. Binge ethanol exposure in adult rats causes necrotic cell death. Alcohol Clin Exp Res. 2002a;26:547–557. [PubMed] [Google Scholar]
- Obernier JA, White AM, Swartzwelder HS, Crews FT. Cognitive deficits and CNS damage after a 4-day binge ethanol exposure in rats. Pharmacol Biochem Behav. 2002b;72:521–532. doi: 10.1016/s0091-3057(02)00715-3. [DOI] [PubMed] [Google Scholar]
- Ohira K. Injury-induced neurogenesis in the mammalian forebrain. Cell Mol Life Sci. 2011;68:1645–1656. doi: 10.1007/s00018-010-0552-y. [DOI] [PMC free article] [PubMed] [Google Scholar]
- Palmer TD, Takahashi J, Gage FH. The adult rat hippocampus contains primordial neural stem cells. Mol Cell Neurosci. 1997;8:389–404. doi: 10.1006/mcne.1996.0595. [DOI] [PubMed] [Google Scholar]
- Parent JM, Yu TW, Leibowitz RT, Geschwind DH, Sloviter RS, Lowenstein DH. Dentate granule cell neurogenesis is increased by seizures and contributes to aberrant network reorganization in the adult rat hippocampus. J Neurosci. 1997;17:3727–3738. doi: 10.1523/JNEUROSCI.17-10-03727.1997. [DOI] [PMC free article] [PubMed] [Google Scholar]
- Pascual M, Blanco AM, Cauli O, Minarro J, Guerri C. Intermittent ethanol exposure induces inflammatory brain damage and causes long-term behavioural alterations in adolescent rats. Eur J Neurosci. 2007;25:541–550. doi: 10.1111/j.1460-9568.2006.05298.x. [DOI] [PubMed] [Google Scholar]
- Paxinos GW, Watson C. The rat brain in stereotaxic coordinates, in Series The rat brain in stereotaxic coordinates. Academic Press; New York: 2009. [Google Scholar]
- Pekny M, Wilhelmsson U, Bogestal YR, Pekna M. The role of astrocytes and complement system in neural plasticity. Int Rev Neurobiol. 2007;82:95–111. doi: 10.1016/S0074-7742(07)82005-8. [DOI] [PubMed] [Google Scholar]
- Penland S, Hoplight B, Obernier J, Crews FT. Effects of nicotine on ethanol dependence and brain damage. Alcohol. 2001;24:45–54. doi: 10.1016/s0741-8329(01)00142-2. [DOI] [PubMed] [Google Scholar]
- Pfefferbaum A, Kim KO, Zipursky RB, Mathalon DH, Lane B, Ha CN, Rosenbloom MJ, Sullivan EV. Brain gray and white matter volume loss accelerates with aging in chronic alcoholics: A quantitative MRI study. Alcohol Clin Exp Res. 1992;16:1078–1089. doi: 10.1111/j.1530-0277.1992.tb00702.x. [DOI] [PubMed] [Google Scholar]
- Poirier JL, čapek R, De Koninck Y. Differential progression of dark neuron and Fluoro-Jade labelling in the rat hippocampus following pilocarpine-induced status epilepticus. Neuroscience. 2000;97:59–68. doi: 10.1016/s0306-4522(00)00026-9. [DOI] [PubMed] [Google Scholar]
- Popken GJ, Farel PB. Sensory neuron number in neonatal and adult rats estimated by means of stereological and profile-based methods. J Comp Neurol. 1997;386:8–15. [PubMed] [Google Scholar]
- Rehm J, Room R, Graham K, Monteiro M, Gmel G, Sempos CT. The relationship of average volume of alcohol consumption and patterns of drinking to burden of disease: an overview. Addiction. 2003;98:1209–1228. doi: 10.1046/j.1360-0443.2003.00467.x. [DOI] [PubMed] [Google Scholar]
- Robel S, Berninger B, Gotz M. The stem cell potential of glia: lessons from reactive gliosis. Nat Rev Neurosci. 2011;12:88–104. doi: 10.1038/nrn2978. [DOI] [PubMed] [Google Scholar]
- SAMHSA . Series Results from the 2009 National Survey on Drug Use and Health: Volume I. Summary of National Findings. Office of Applied Science; Rockville, MD: 2010. Results from the 2009 National Survey on Drug Use and Health: Volume I. Summary of National Findings. Vol. HHS Publication No. SMA 10-4586 Findings. [Google Scholar]
- Schmidt-Kastner R, Szymas J, Hossmann KA. Immunohistochemical study of glial reaction and serum-protein extravasation in relation to neuronal damage in rat hippocampus after ischemia. Neuroscience. 1990;38:527–540. doi: 10.1016/0306-4522(90)90048-9. [DOI] [PubMed] [Google Scholar]
- Schmued LC, Hopkins KJ. Fluoro-Jade B: a high affinity fluorescent marker for the localization of neuronal degeneration. Brain Res. 2000;874:123–130. doi: 10.1016/s0006-8993(00)02513-0. [DOI] [PubMed] [Google Scholar]
- Schnitzer J, Franke WW, Schachner M. Immunocytochemical demonstration of vimentin in astrocytes and ependymal cells of developing and adult mouse nervous system. J Cell Biol. 1981;90:435–447. doi: 10.1083/jcb.90.2.435. [DOI] [PMC free article] [PubMed] [Google Scholar]
- Sofroniew MV, Vinters HV. Astrocytes: biology and pathology. Acta Neuropathol. 2010;119:7–35. doi: 10.1007/s00401-009-0619-8. [DOI] [PMC free article] [PubMed] [Google Scholar]
- Stringer JL. Repeated seizures increase GFAP and vimentin in the hippocampus. Brain Res. 1996;717:147–153. doi: 10.1016/0006-8993(96)00059-5. [DOI] [PubMed] [Google Scholar]
- Sullivan EV, Pfefferbaum A. Neurocircuitry in alcoholism: a substrate of disruption and repair. Psychopharmacology. 2005;180:583–594. doi: 10.1007/s00213-005-2267-6. [DOI] [PubMed] [Google Scholar]
- Sullivan EV, Rosenbloom MJ, Pfefferbaum A. Pattern of motor and cognitive deficits in detoxified alcoholic men. Alcohol Clin Exp Res. 2000;24:611–621. [PubMed] [Google Scholar]
- Tagliaferro P, Vega MD, Evrard SG, Ramos AJ, Brusco A. Alcohol exposure during adulthood induces neuronal and astroglial alterations in the hippocampal CA-1 area. Ann N Y Acad Sci. 2002;965:334–342. doi: 10.1111/j.1749-6632.2002.tb04175.x. [DOI] [PubMed] [Google Scholar]
- Verbaten MN. Chronic effects of low to moderate alcohol consumption on structural and functional properties of the brain: beneficial or not? Hum Psychopharmacol. 2009;24:199–205. doi: 10.1002/hup.1022. [DOI] [PubMed] [Google Scholar]
- Walker DW, Barnes DE, Zornetzer SF, Hunter BE, Kubanis P. Neuronal loss in hippocampus induced by prolonged ethanol consumption in rats. Science. 1980;209:711–713. doi: 10.1126/science.7394532. [DOI] [PubMed] [Google Scholar]
- Ward RJ, Colivicchi MA, Allen R, Schol F, Lallemand F, de Witte P, Ballini C, Corte LD, Dexter D. Neuro-inflammation induced in the hippocampus of ‘binge drinking’ rats may be mediated by elevated extracellular glutamate content. J Neurochem. 2009;111:1119–1128. doi: 10.1111/j.1471-4159.2009.06389.x. [DOI] [PubMed] [Google Scholar]
- Zahr NM, Kaufman KL, Harper CG. Clinical and pathological features of alcohol-related brain damage. Nat Rev Neurol. 2011;7:284–294. doi: 10.1038/nrneurol.2011.42. [DOI] [PMC free article] [PubMed] [Google Scholar]
- Zhang D, Hu X, Qian L, O’Callaghan JP, Hong JS. Astrogliosis in CNS pathologies: is there a role for microglia? Mol Neurobiol. 2010;41:232–241. doi: 10.1007/s12035-010-8098-4. [DOI] [PMC free article] [PubMed] [Google Scholar]