Abstract
Cell migration paths of mammary epithelial cells (expressing different versions of the promigratory tyrosine kinase receptor Her2/Neu) were analyzed within a bimodal framework that is a generalization of the run-and-tumble description applicable to bacterial migration. The mammalian cell trajectories were segregated into two types of alternating modes, namely, the “directional-mode” (mode I, the more persistent mode, analogous to the bacterial run phase) and the “re-orientation-mode” (mode II, the less persistent mode, analogous to the bacterial tumble phase). Higher resolution (more pixel information, relative to cell size) and smaller sampling intervals (time between images) were found to give a better estimate of the deduced single cell dynamics (such as directional-mode time and turn angle distribution) of the various cell types from the bimodal analysis. The bimodal analysis tool permits the deduction of short-time dynamics of cell motion such as the turn angle distributions and turn frequencies during the course of cell migration compared to standard methods of cell migration analysis. We find that the two-hour mammalian cell tracking data do not fall into the diffusive regime implying that the often-used random motility expressions for mammalian cell motion (based on assuming diffusive motion) are invalid over the time steps (fraction of minute) typically used in modeling mammalian cell migration.
Keywords: Bimodal framework, mammalian cell, turn angle distribution, random motility coefficient
INTRODUCTION
Cell migration is of crucial importance in cells ranging from simple bacteria to complex mammalian cells. Bacteria migrate towards a food source or move away from unfavorable environments 12 while eukaryotic cell migration forms the basis of many normal physiological processes such as embryogenesis 36 as well as pathogenic conditions like tumor metastasis 13, 14.
Individual cell migration has been found to play a crucial role in organ morphogenesis 44. Tumor cells are also thought to frequently down regulate their cell-cell adhesions and migrate as individual cells during tumor metastasis 33. In addition, understanding how cells behave on an individual level is an essential element in predicting their population-level behavior. For example, the transport properties from the individual cellular level have been correlated to those at the population level 19, 26, 46 for both random and biased cell migration of bacteria and leukocytes. The single cell level studies are typically done at lower densities of cells and may not necessarily encompass all the high-density features. Nonetheless, the knowledge of single cell level parameters can provide a good starting point to model and predict population level behavior. This information can be useful in quantifying the subtle differences in cell motility arising due to different genetic makeup such as comparing the invasive abilities of malignant cells compared to normal cells.
The motion of an individual bacterium has been well described by a run-followed by-tumble framework 6, 7, 12. The runs last for several seconds while tumbles last for a fraction of a second (~ 0.1s). The tumbling phase involves the reversal of the bacterial flagella from anticlockwise to clockwise, at which point forward motion of the cell comes to an end. After re-orientation, the flagella again revert to anticlockwise rotation, and the bacterium starts to move in a new direction. Berg’s tracking microscope7 has been used to follow bacteria rigorously as they migrate and ‘run and tumble’ parameters have been determined for E. coli both in the presence and absence of a chemoattractant 7. A clear criterion was developed to identify the ‘runs and tumbles’ in bacterial motion and used to develop run time, tumble time and turn angle distributions for the bacteria from the tracking data 7, 8. This framework was extended for tracking migration of E. coli near solid planar surfaces 28 and study migration of other bacteria such as Pseudomonas putida 22, 23.
The incorporation of single-cell dynamics into a model for cell populations has been successfully done in the past for bacteria. Using the tumbling frequency and turn angle distributions from the ‘run and tumble’ analysis of the data collected from bacterial tracking experiments, as well as a quantitative relationship between chemoattractant concentration gradient and run-time extension, the ‘cellular dynamics’ simulation methodology 27, 29 was developed to predict the population level dynamics based on known individual bacterial information. Cellular dynamics was found to predict cell motion through porous media 5, 21, 22. In these simulations, a large number of bacteria are simulated based on known single cell dynamics. To simulate bacterial motion within a porous media, the mathematical characterization of experimentally determined cell-surface dynamics 28 is also required. In order to extend this scheme to eukaryotic cells, similar parameters need to be extracted from the mammalian cell tracking data; the first step in doing so is to characterize the cell motion in the absence of a chemoattractant.
The bimodal model for mammalian cell motility, presented for the first time in this paper, contrasts with the persistent random walk (PRW) model that is based on a continuum version of Ornstein-Uhlenbeck process used to describe Brownian dynamics. The PRW model has been often used to study the motility of individual mammalian cells 25. In the PRW model, a non-linear equation-involving mean squared displacement of the cell as a fit of two parameters namely, the mean speed and persistence time, is used to model the migration of mammalian cells 18. The persistence time is described as a characteristic run-time incorporating the persistence displayed by a cell 39. Several investigators have used this model to fit the time-lapse video-microscopy cell migration data and extract cell-specific parameters such as persistence time 11, 20, 25, 30–32, 34, 35, 37, 41, 50–52. However, information regarding the short-time dynamics such as the turn angle distribution and turn frequency as the cell migrates cannot be deduced from the PRW model.
The availability of excellent data for the migration of individual bacteria over frequent sampling time intervals as well as the relatively faster time scale over which bacteria migrate have facilitated good characterization of bacterial motion in terms of run time (Poisson) and turn angle distributions. The tracking data of mammalian cell migration has been largely confined to taking frequent snapshots of a fixed field of view over several time points. The migrating cell must remain in this field of view for this purpose, unlike the three-dimensional tracking of bacteria where a given individual bacterium was tracked automatically so that it always remained in the center of the field of view. Some attempts have been made at modifying the tracking software to keep a given mammalian cell within the field of view 43 but fixed time-lapse video-microscopy still remains the most popular method to track mammalian cells on 2-D substrates in order to get cellular parameters 15, 38. The 3-D tracking of mammalian cells (15–20 µm) is difficult to assess compared to the 3-D visualization of smaller in size bacterial cells (1 µm). Our experimental capabilities restrict us to collecting fixed time-lapse microscopy data of mammalian cells on 2-D tissue culture plastic substrates and we developed an analysis tool based on this data.
In this work, we have approached the problem of analyzing cell migration of individual mammalian cells, specifically MCF-10A cells (human mammary epithelial cells), within a bimodal (directional and re-orientation modes) framework similar in spirit to that used in the analysis of bacterial motility 7, 8. We interpret the re-orientation phase in a mammalian cell migration as the time during which the actin polymerization machinery in the cell preferentially polymerizes actin at a new leading edge and the cell is propelled in the new direction 3, 12. The cellular activity of proteins like Rac has been found to regulate the random versus directionally persistent mode of migration in a cell 40. The role of phosphoinositide (PI) 3 kinase signaling in actin motility in various chemotactic systems from Dictyostelium discoideum to fibroblasts has been discussed where directional bias in eukaryotic cells is said to arise due their spatial sensing of chemo-attractant gradients leading to heterogeneous distribution of this signaling 45, 49. An attempt is made here to separately locate the directional-mode (mode I, the more persistent mode) analogous to a bacterial run and the re-orientation-mode (mode II, random or the less persistent mode) analogous to a bacterial tumble in a mammalian cell migration path by performing simple video-microscopy experiments.
A criterion for locating runs and tumbles in a cellular trajectory based on work by Berg and coworkers with bacterial migration was applied to MCF-10A cellular trajectories. Using this criterion, the turn angle distributions of control MCF-10A-pbabe, pre-malignant neuN and invasive neuT were generated. The single cell dynamics such as the mean directional-mode time, re-orientation-mode time and turn angle distributions were extracted for the MCF-10A cells from the tracking data. We have further discussed the effect of sampling time interval of experimental data collection and also the resolution at which the data is collected.
MATERIALS AND METHODS
Cell culture
The cell lines used in the motility experiments were a kind gift of Dr. Joan Brugge and were derived from the MCF-10A human mammary epithelial cells to express the pbabe vector alone (pbabe), or the normal (neuN) or transforming (neuT) versions of the rat Her 2/Neu oncogene 4, 48. All the cells were cultured in DMEM/F-12 50/50 media (Mediatech, Herndon, VA) supplemented with horse serum (2%, GIBCO/Invitrogen, Carlsbad, CA), cholera toxin (0.1µg/mL, Calbiochem, La Jolla, CA), insulin (10µg/mL, GIBCO/Invitrogen, Carlsbad, CA), hydrocortisone (0.5µg/mL, Sigma, St. Louis, MO) and EGF (20ng/mL, GIBCO/Invitrogen, Carlsbad, CA) as described by protocol in work by Debnath and coworkers 16. The cells were maintained in a humidified atmosphere supplemented with 5% CO2 and were split every 3 to 4 days.
Cell motility assay
The migration of cells was followed under random motility conditions without the presence of any externally added chemo-attractant gradients. All the three cell types were plated overnight at a low density of approximately 5000 cells per cm2 of growth area on tissue-culture plastic. The media was changed to Leibovitz’s L-15 (GIBCO/Invitrogen, Carlsbad, CA) medium (because of an absence of CO2 buffering in the microscope chamber) supplemented with horse serum (2%), cholera toxin (0.1µg/mL), insulin (10µg/mL), hydrocortisone (0.5µg/mL) and EGF (20ng/mL).
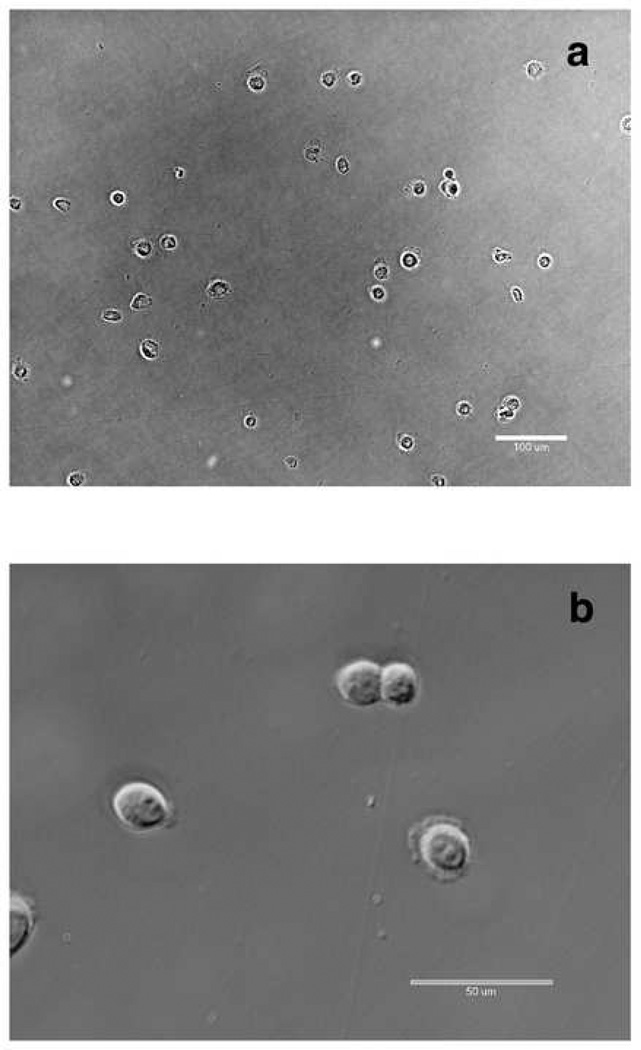
The cells were monitored using the phase-contrast optics in a Nikon Eclipse TE2000-E microscope equipped with temperature-controlled, humidified chamber and a motorized x-y stage for several samples. Cellular images were captured on a Hamamatsu Orca-ER camera using Metamorph (Molecular Devices Corporation, Sunnyvale, CA) for data acquisition and analysis. The cells were followed with a magnification of 40x (1 pixel ≡ 0.163 µm) and a sampling time interval of 0.5 minutes. Figure 1 shows a frame of MCF-10A-neuT cells viewed at different resolutions of 10x (1 pixel ≡ 0.647 µm) and 40x (1 pixel ≡ 0.167 µm). All the cells were equilibrated in the humidified, temperature controlled (37 °C) microscope chamber for an hour before data collection. The cells were followed for at least two hours in all the experiments. At least five sets of experiments were performed and on an average four movies were taken per well. We used a shorter time period of 2 hours for a smaller sampling time interval of 0.5 minutes because of the constraints imposed by the available experimental set-up for data storage. We reduced the total time of the video-microscopy to 2 hours to opt for the more frequent sampling of data. Experiments have also been performed using this apparatus over longer periods with less frequent sampling; however, we do not use this experimental data for analysis in this paper.
Figure 1.
MCF-10A-neuT cells a) 10x resolution (1pixel≡0.647 µm) and b) 40x resolution (1 pixel≡0.167µm).
Trajectory data
Each cell was manually tracked by following the cell nucleus. Only single cells that never interacted with other cells were considered for the analysis. The cells were plated at low density to avoid interacting cell populations. Cells that remained stationary, or moved outside the viewing area, or that underwent cell division during the course of the experiment were excluded from the tracking procedure. A heuristic rule was used to further screen the data to be used for the analysis. A cell that did not cover considerable distance (at least 30 µm along one axis) was considered atypical, and thus not included in our analysis. Approximately, 50% of total tracked cells for each cell type fit this heuristic criterion. To address the impact of sampling frequency, the 0.5 minute data obtained using 40x was re-analyzed as 2.5 minute data by considering every fifth data point. This means that each trajectory at 0.5 minutes generates 5 trajectories at 2.5 minutes: one trajectory using the 1st, 6th, 11th, … positions, one using the 2nd, 7th, 12th, … positions, etc. In order to address the impact of resolution, we extracted 10x data from 40x data, which we refer to as‘10x extracted data’. For this, the pixels at 40x are converted to the values they would have at 10x followed by computing the co-ordinates of the cell at 10x (by using the calibration at 10x (1pixel ≡ 0.647 µm)). That is, 16 pixels at 40x collapse to a single pixel at 10x.
Bimodal analysis
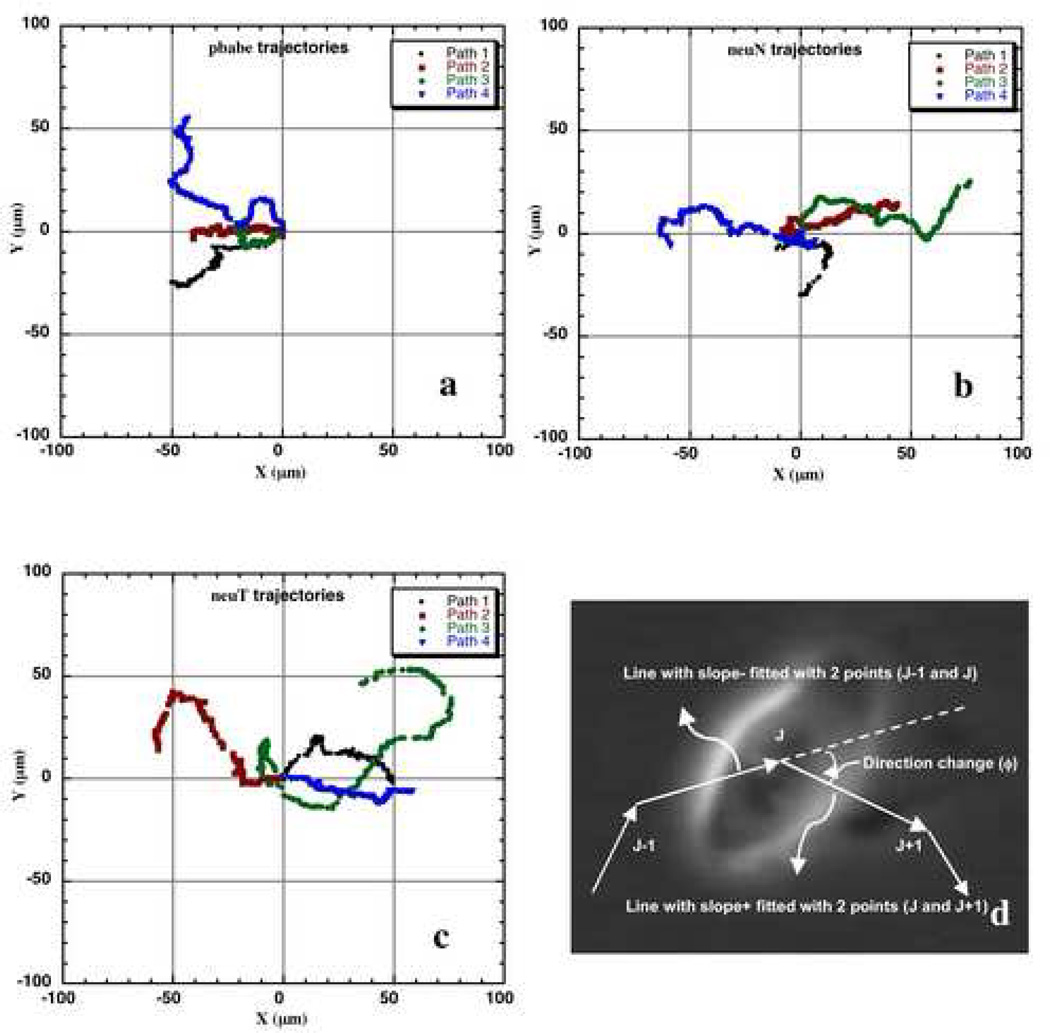
The individual cell paths from the motility assay were first plotted as windrose (the origins of the trajectories are shifted to (0,0)) 52 plots on a constant plot area (200 µm X 200 µm). Example cell trajectories used in the analysis are shown in Figs. 2 a, b and c. The cell paths with repeated circular tracks were ignored as these cells were found to undergo division.
Figure 2.
Example cell paths of MCF-10A-pbabe (a), neuN (b) and neuT (c) cells used for bimodal analysis re-plotted as windrose plots. The data was collected with 40x magnification every 0.5 minutes. d) The direction change (φ) calculated at each frame in a cell path. The direction was determined by fitting slope using two-point linear regression.
The method employed to determine the direction change (φ) at each frame (time point) required for the ‘bimodal analysis’ is illustrated in Fig. 2d. The direction change at each frame is defined as the difference in forward direction and the backward direction. At each frame, the change in direction of motion was determined by finding the forward direction and backward direction. The forward direction is determined from the slope of a vector formed from the current frame to the successive frame while the backward direction is given by the slope of a vector from the prior frame to the current frame. A two-point linear regression was used to determine each slope. A negative direction change represents a clockwise motion and vice-versa. The analysis of the two-dimensional (x-y) data gives a direction change (φ) range from −π to + π
Since the time between observations is fixed, the change of φ between one frame and the next is essentially the same as the angular speed (the time-rate of change in direction of motion) that was computed by Berg and co-workers in the run-tumble analysis of bacterial migration7. The rules for scoring the start and an end of a directional phase were similar to the ones used in the run-and-tumble analysis of bacterial paths and have been elaborately stated for the analysis of the three-dimensional tracking data for E. coli8. The following algorithm was used to locate the directional and re-orientation modes in a cellular trajectory. Specifically, the start of the directional mode was scored at any frame J if the quantity φ was less than an empirical cut off value, say, φcut for frames J, J+1 and J+2 each. The end of the directional mode (start of the re-orientation mode) was scored at any frame J under two circumstances: a) if φ > φcut for both frames J and J+1 or b) if φ > φcut for frame J only, provided that the value of φ for vectors formed by data points J, J+2 in forward direction and J, J−2 in the backward direction is greater than φcut. We call this as r3 criterion since the φ value at three successive frames determine a directional mode. Analogously, we can also define an r2 criterion, in which the φ value at two successive frames determine the start of a directional mode, and an r1 criterion in which the φ value at a single frame was examined to score the start of a directional mode.
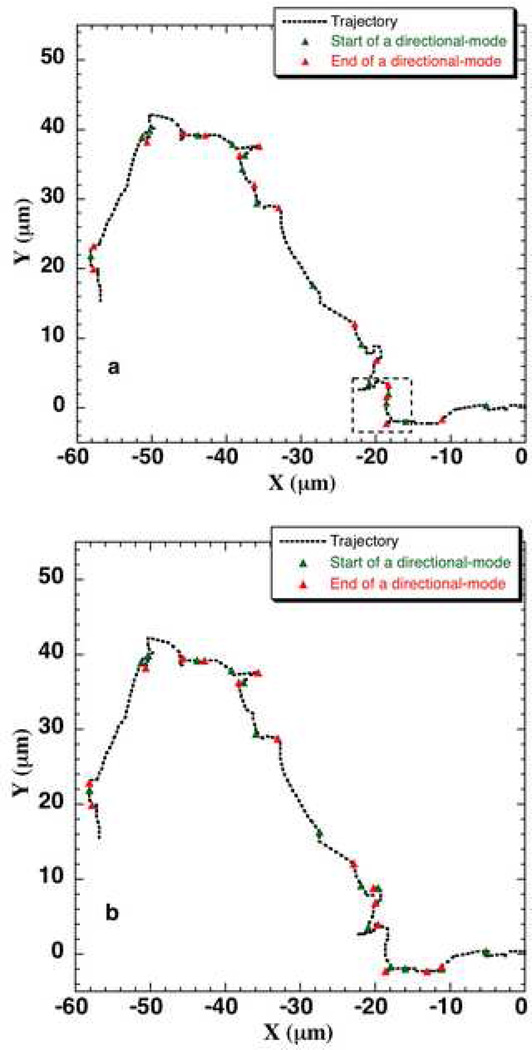
A cut-off value of φcut = 35° was used in the run-tumble analysis of bacteria8. A visual inspection of several cellular trajectories of the three MCF-10A cell types revealed that a cut-off value of φcut 45° for φ was appropriate for locating the transition between two mode types in the cellular trajectories. A value less than this cut-off (such as φcut = 35°) would pick up fluctuations in the cell path as the start of a directional mode as indicated (by the square inset) in an example trajectory (Fig. 3a). The same trajectory (a neuT cell path) with φcut = 45° is shown in Fig. 3b. This cut-off value is heuristic in nature and may or may not be applicable for other cell types. A good starting point to empirically determine the value of φ cut is 35° as this is the value by which bacteria would change its direction due to Brownian motion8.
Figure 3.
The directional-mode (mode I) and re-orientation-mode (mode II) located in a neuT cell trajectory using a) φcut = 35°, b) φcut = 45°. The ‘r3 criteria’ was used for locating the directional-modes in each case.
The turn angle in a cell trajectory is the angle change between successive directional modes. A procedure similar to the one described above to calculate φ was used to determine the turn angle with the exception that, instead of performing two-point linear regression to determine the slope (and hence direction) along a directional mode, a multi-point linear regression was performed utilizing all the data points constituting a directional mode.
Statistical Analysis
The statistical significance was verified using SPSS, version 16 (SPSS, Inc., Chicago, IL). The Shapiro-Wilks test for normality (α= 0.05) was applied to all data sets for distribution analysis. The Kolmogorov-Smirnov two-sample non-parametric test was subsequently applied to data to check for significant differences (α= 0.05) across means of various groups (i.e., by pixel size, sampling interval) for all measurements. While reporting the mean values (speed, directional-mode times and re-orientation-mode times), the mean of each cell was weighted equally7, and the standard deviation (error bars in all Figs. and Tables) is the standard deviation in the mean. At least 5 independent experiments were carried out for each cell type. The persistence index ψ value does not have any error bars as this value was calculated using equation 1 where h(φ) is the turn angle distribution for a population of specific cell type computed from data from all independent experiments. The value of ψ was one value representing a population type hence it does not have a p-value.
RESULTS
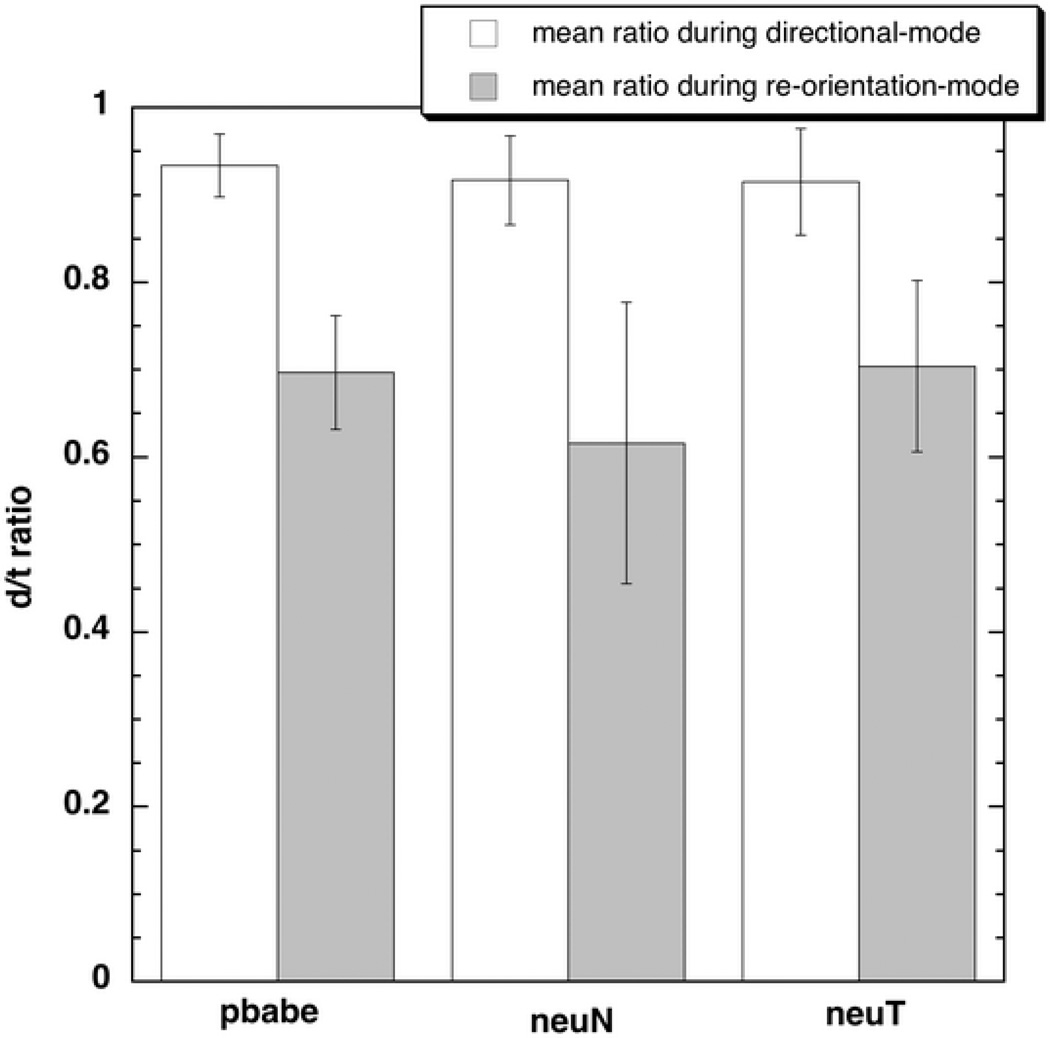
The d/t ratios for the two modes of MCF-10A cell migration were calculated to verify the presence of the directionally persistent (mode I) and re-orientation (mode II) phases. These ratios have been referred to as the directionality ratios in literature 40. The quantity ‘d’ is the shortest linear distance from start to the end of a particular mode I or mode II, while ‘t’ is the total distance traversed by the cell from start to the end of that particular mode I or II (Fig. 4). The mean d/t ratio obtained during the mode I phase (analogous to runs) was found to be higher (p <0.001 for all cell types, pbabe (n=214), neuN (n=187) and neuT (n=169)) than the mean d/t ratio during the mode II phase (analogous to tumbles) confirming the existence of two alternating modes in eukaryotic cell migration.
Figure 4.
The mean d/t ratios for the cells located during the two phases indicating the presence of the mode I and mode II phases in a cell path (pbabe (p <0.001, n=214), neuN (p<0.001, n=187) and neuT (p<0.001, n=169) using Kolmogorov-Smirnov nonparametric test).
A point of difference between the proposed bimodal framework for a mammalian cell versus the run-tumble framework for a bacterium is the timescale of the reorientation- mode (mode II), which is analogous to the tumble time of a bacterium. The time spent in the tumble phase in a bacterial trajectory is on the order of 0.1 seconds, compared to a run that lasts for seconds or longer. On the other hand, we find that the reorientation- mode in a mammalian cell trajectory can last for several minutes. A bacterial tumble could be considered essentially instantaneous unlike the re-orientation phase in a cellular trajectory where the re-orientation-mode can last as long as directional-mode. The turn frequency for bacteria is simply the number of tumbles made by the bacteria divided by the total time. The turn frequency for a mammalian cell is defined as the total number of re-orientation-modes divided by the total time spent in the directional-modes. For a single cell, this definition is reciprocal of mean directional-mode time for the cell. where are the mean directional-mode time and mean turn frequency of the ith cell, respectively, N total number of cells in a cell type and the brackets denote average value of quantities for a given cell type.
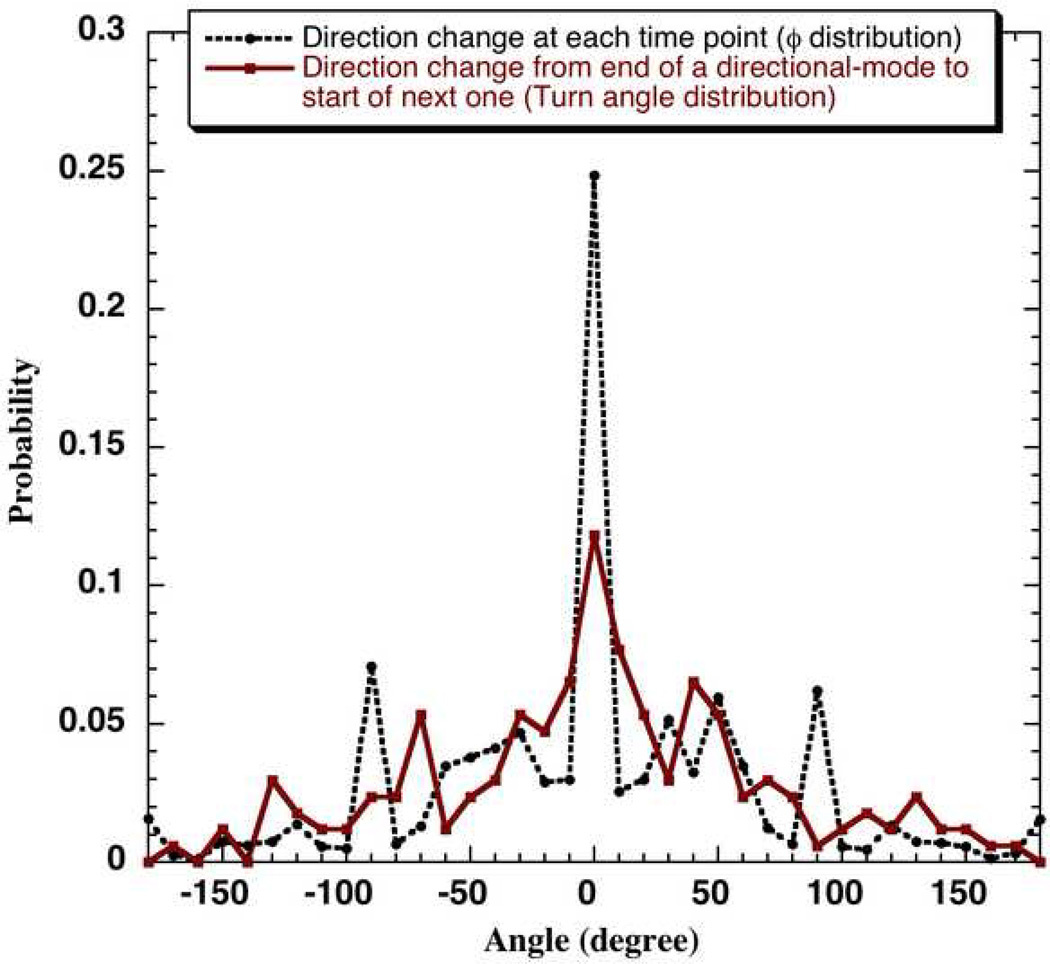
A representative distribution of direction change at each sampling point, that is, φ values obtained using the bimodal analysis (described in the methods section) is shown in Fig. 5. For the two-dimensional system under consideration, the range of φ lies between −π to +π as mentioned earlier. For a 3-D tracking data, this range would be between 0 to π7. The direction at each time point would be characterized by two types of angles in 3- D. In a 3-D in vivo setup, the influence of the ECM (extra-cellular matrix) overlaid on the cells would come into picture. It can be expected that the frequency of re-orientations may be altered in 3-D. The algorithm described in the methods section was used to locate the two modes along a cell path in multiple cell trajectories. Using a cut-off φ, that is, φcut = 45°, and applying the ‘r3 criteria’ described in methods section, the start and end of a mode I for each of the directional-modes in a cell trajectory can be located. We find that there was approximately equal occurrence of a cell-entering mode II via any of the two described mode II criteria.
Figure 5.
The discrete probability distribution of direction changes at each time step (distribution of φ values) and direction changes from end of one directional phase to the start of another (turn angle distribution) obtained using a bin size of 10 degrees for neuT cells tracked using Δtexp = 0.5 minutes and 40x magnification for 2 hours.
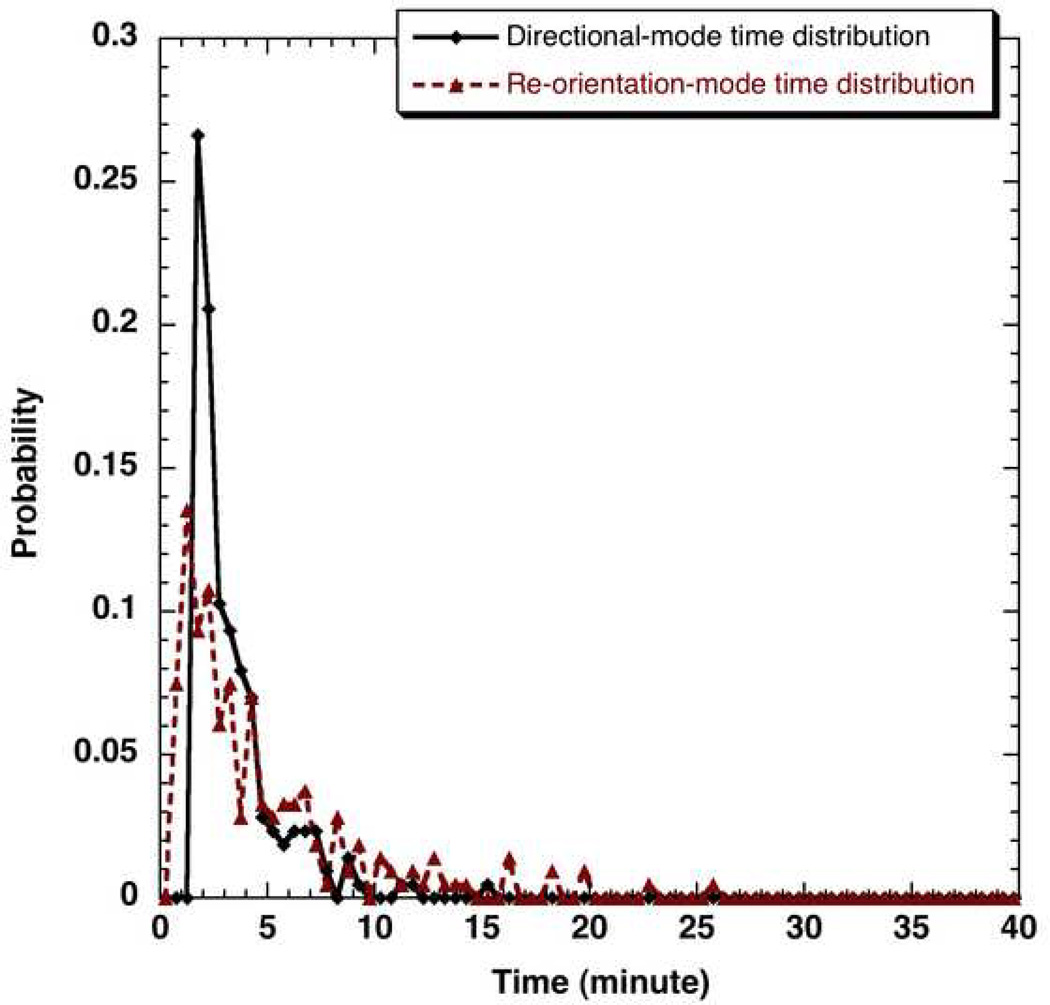
After locating the direction along each mode I using multi-point regression, the “mode I to mode I” turn angle distribution for each cell type can be determined by making a histogram of turn angles for a given cell type. One such turn angle distribution (neuT cells), which essentially represents the change in direction between successive directional modes in a mammalian cell trajectory, is shown in Fig. 5. Representative directional-mode time and re-orientation-mode time distributions (pbabe cells) are displayed in Fig. 6. It can be seen that the smallest directional-mode time is of the order of 1.5 minutes as constrained by the criterion for location of this mode while the reorientation-mode lasts at least for 0.5 minutes in accordance with the second reorientation criterion listed in the methods section. The highest probability of directional-mode and re-orientation-mode times for the pbabe cells was around 2 minutes.
Figure 6.
The discrete probability distributions of directional-mode times and re-orientation-mode times obtained using a bin size of 0.5 minutes for pbabe cells tracked using Δtexp = 0.5 minutes and 40x magnification for 2 hours.
All the distributions are discrete probability distributions determined from the frequency distribution of the variables. The cell trajectory data at a sampling time interval (Δtexp) of 0.5 minutes and 40x magnification were used to construct the distributions shown in Figs. 5, 6 and 7. All the results shown here were obtained using r3 criteria and a φcut = 45°. The location of the two alternating modes using bimodal analysis and hence directional-mode time, re-orientation-mode time and turn angle distributions are sensitive to the criterion and the value of φcut used for the bimodal analysis.
Figure 7.
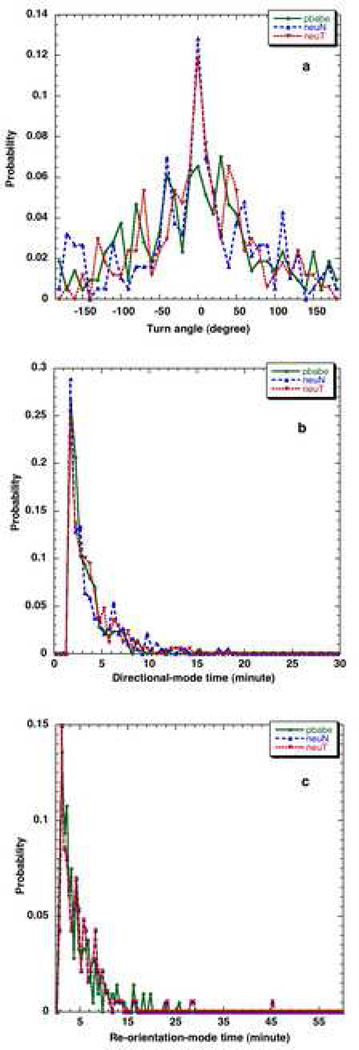
The discrete a) turn angle probability distributions for pbabe, neuN and neuT cells obtained using a bin size of 10 degrees for cells b) directional-mode time probability distributions of pbabe, neuN and neuT cells using bin size of 0.5 minute and c) reorientation-mode time probability distributions of pbabe, neuN and neuT cells using bin size of 0.5 minute tracked using Δtexp = 0.5 minutes and 40x magnification for 2 hours.
Figure 7a compares the turn angle distributions for the three different cell types while the directional-mode time and re-orientation-mode time distributions are plotted in Fig. 7b and 7c respectively. The cumulative distribution functions of these turn angle distributions can be fitted and used to perform cellular dynamics simulations of the different cell types and elucidate the differences in the cell lines.
The turn angle distribution h(φ), of a bacterium could be used to calculate (equation 1) the persistence index (ψ) (defined as the mean of cosine of deviation in a cell path which is same as the mean cosine of the turn angle distribution 39) since the bacterial tumbles are instantaneous and bacterial motion can be generalized as a velocity-jump process with no relaxation time 39. A value of ψ close to 1 indicates high persistence while a value close to 0 indicates random behavior. The PRW model (equation 2) occasionally used to fit mean squared displacement (d2(t)) of mammalian cells using the parameters of persistence time (P) and random motility coefficient (µ), for a system with n dimensions, is based on negligible re-orientation/tumbling time which may not be true in the migration of mammalian cells such as the MCF-10A cells as has been shown in the results. Equation 3 connects the random motility coefficient µ, to P and mean speed S. The persistence time is related to the persistence index, ψ in this model by equation 4 where <τ> is the mean directional-mode time. We have used equation 1 to calculate ψ just to elucidate the effect of various conditions such as the sampling interval and resolution and we realize that MCF-10A random migration is a velocity jump process with a finite resting phase39.
| (1) |
| (2) |
| (3) |
| (4) |
Using the r3 criteria and a φcut = 45°, the total number of mode Is and mode IIs, the mean directional-mode time and re-orientation-mode time was determined for each cell in a given cell type. The results of the bimodal analysis of cell path data obtained using an experimental time-step of 0.5 minutes and 40x magnification are shown in Table 1. The various parameters such as the mean directional-mode time, re-orientation-mode time, mean speed and persistence index, were calculated. The parameters obtained for the control pbabe, pre-malignant neuN and invasive neuT cells are listed together.
Table 1.
Parameters obtained from bimodal analysis of pbabe, neuN and neuT cell migration tracks at different Δtexp and resolution for tracking time of 2 hours.
| Time interval1 | Δtexp = 0.5 | Δtexp = 2.5 | |||||
|---|---|---|---|---|---|---|---|
| Cell type | pbabe | neuN | neuT | pbabe | neuN | neuT | |
| No. of cells | 15 | 15 | 12 | 15 | 15 | 12 | |
| No. of trajectories | 15 | 15 | 12 | 75 | 75 | 60 | |
| 40x | Mean speed2 | 1.05±0.28 | 1.09±0.38 | 1.20±0.43 | 0.81±0.22 | 0.79±0.24 | 0.94±0.35 |
| Mean directional-mode time1 | 3.1±0.8 | 3.7±1.3 | 3.5±0.7 | 18.4±12.9 | 16.9±10.2 | 14.2±5.6 | |
| Mean re-orientation-mode time1 | 4.5±1.0 | 5.0±2.2 | 4.3±1.2 | 20.6±13.8 | 20.3±13.9 | 18.0±13.2 | |
| Persistence index, ψ | 0.38 | 0.39 | 0.49 | 0.42 | 0.64 | 0.25 | |
| 10x | Mean speed2 | 1.05±0.28 | 1.09±0.39 | 1.21±0.43 | 0.8±0.22 | 0.78±0.23 | 0.93±0.35 |
| Mean directional-mode time1 | 3±0.4 | 3.29±1.08 | 3.84±1.13 | 18.5±12.3 | 13.7±6.8 | 13.9±7.4 | |
| Mean re-orientation-mode time1 | 5.7±1.4 | 6.4±2.0 | 5.72±1.58 | 19.9±12.9 | 24.9±19.1 | 20.1±14.2 | |
| Persistence index, ψ | 0.28 | 0.34 | 0.29 | 0.37 | 0.59 | 0.29 | |
minute
µm /minute
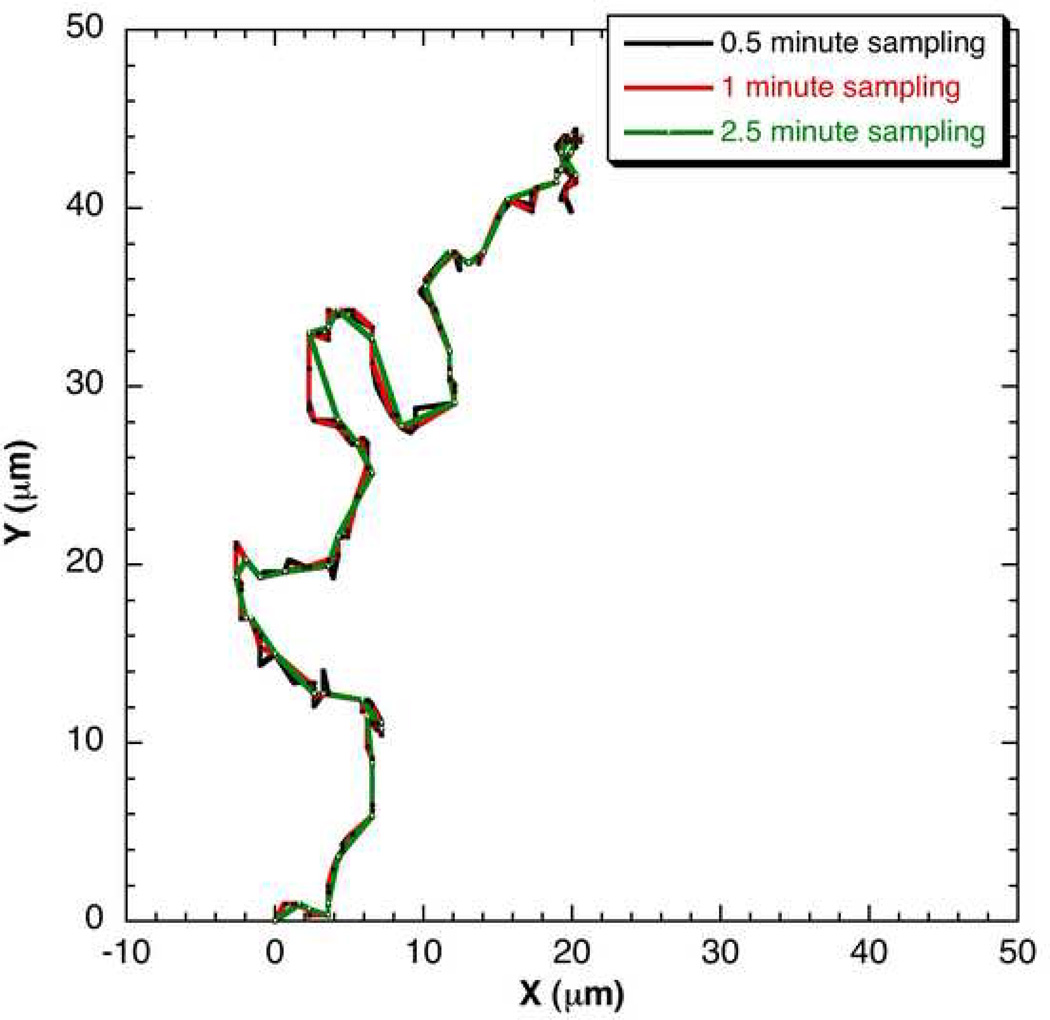
This analysis was repeated by extracting data with Δtexp = 2.5 minute from the 0.5 minute data. The number of data trajectories available with the 2.5 minute data extracted from the 0.5 minute data would be five times more but the number of frames (data points) in each trajectory would reduce by 5 times. For instance, for the tracking time of 2 hours, the 0.5 minute data with 15 data trajectories from 15 cells and 240 frames each would convert to 2.5 minute data with 75 data trajectories from 15 cells and 48 frames each. Similarly, 1 minute Δtexp data can be extracted from 0.5 minute data by considering every other data point. The various parameters obtained from 2.5 minute data analysis are listed in Table 1. Figure 8 shows an example cell trajectory of the same data with different Δtexp such as 0.5, 1 and 2.5 minute.
Figure 8.
An example cell trajectory if the data were collected at 0.5, 1 and 2.5 minute of Δtexp.
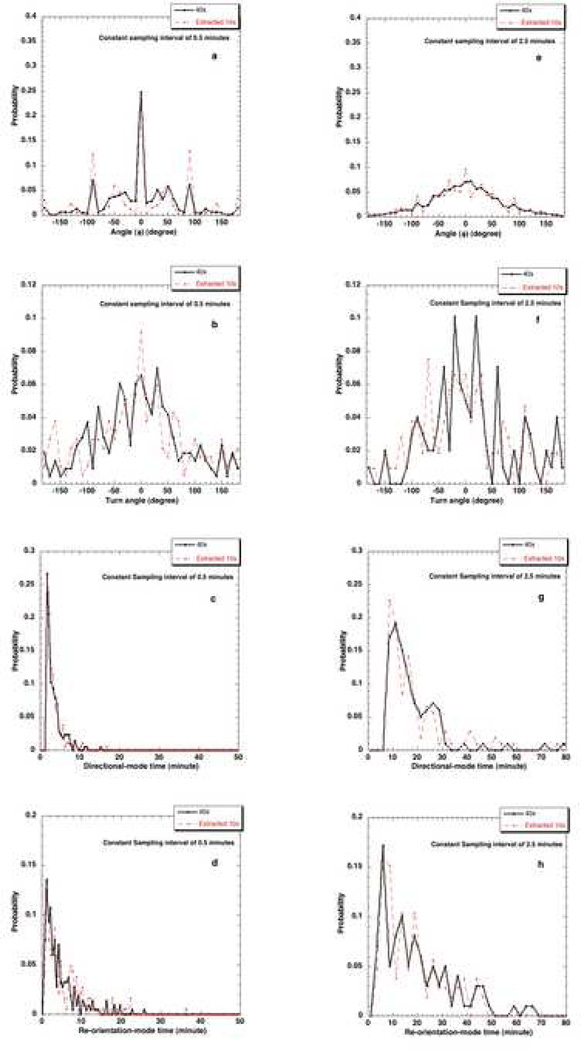
The effect of the resolution at which the images of migrating cells are recorded was studied by comparing data at two different magnifications, namely, 40x (1 pixel≡0.163 µm) and 10x (1 pixel≡0.647 µm) where 10x data was extracted from the acquired 40x data. The φ distribution, turn angle distribution, directional-mode time and re-orientation-mode time distributions for pbabe cell type determined at different resolutions or pixel sizes and at a constant Δtexp = 0.5 minute are shown in Figs. 9 a, b, c and d. The same effect at a Δtexp = 2.5 minute is illustrated in Figs 9 e, f, g and h. The influence of pixel size on various parameters obtained from ‘bimodal analysis’ was studied by comparing the results from data analysis at different magnifications (Table 1). The statistical significance of such comparisons for the different cell types is shown in Table 2.
Figure 9.
Effect of pixel size at Δtexp = 0.5 minutes on a) φ distribution, b) turn angle distribution, c) directional-mode time distribution and d) re-orientation-mode time distribution and at Δtexp = 2.5 minutes on e) φ distribution, f) turn angle distribution, g) directional-mode time distribution and h) re-orientation-mode time distribution.
Table 2.
Statistical significance for effect of pixel size and sampling interval, Δtexp on various parameters using Kolmogorov-Smirnov nonparametric test. A p-value <0.05 indicates significant difference.
| Condition | Parameter | p-values (n13,n24) |
||
|---|---|---|---|---|
| pbabe | neuN | neuT | ||
| Constant Δtexp (2.5 minute), compare 40x and extracted 10x | Mean directional-mode time1 | 0.943 (102,106) | 0.548 (68,78) | 0.990 (108,106) |
| Mean re-orientation-mode time11 | (102,106) | 0.741(68,78) | 0.989 (108,106) | |
| Mean speed2 | < 0.001 (3525,3525) | <0.001(3525,3525) | < 0.001 (2820,2820) | |
| Constant pixel (40x), compare 0.5 and 2.5 minute, Δtexp | Mean directional-mode time1 | < 0.001 (214,102) | < 0.001 (187,68) | < 0.001 (169,108) |
| Mean re-orientation-mode time1 | < 0.001 (214,102) | < 0.001 (187,68) | < 0.001 (169,108) | |
| Mean speed2 | < 0.001 (3585,3585) | < 0.001 (3585,3585) | < 0.001 (2868,2868) | |
minute
µm /minute
sample size at 40x (constant Δtexp) or sample size at 0.5 minute (constant pixel)
sample size at extracted 10x (constant Δtexp) or sample size at 2.5 minutes (constant pixel)
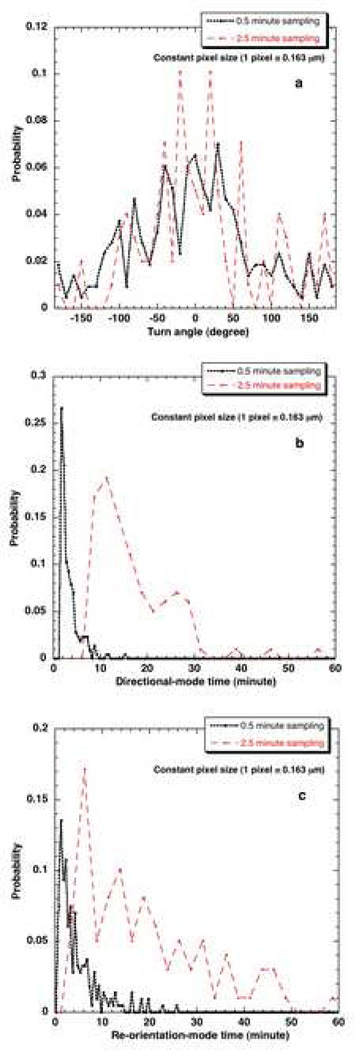
The influence of sampling interval of data collection on the distributions keeping the pixel size constant is studied in Fig. 10. The parameters calculated at different Δtexp but same pixel sizes are compared (Table 1). The results obtained from 0.5 minute data are compared with that of 2.5 minute data at constant magnification of 40x for statistical significance (Table 2). This comparison becomes especially important when extracting short time dynamics such as directional-mode time and re-orientation-mode time dynamics. One can realize that the sampling interval of data collection should be small enough (at least smaller than the mean time for the directional and the less persistent modes) to capture the bimodal framework of the mammalian cells.
Figure 10.
Effect of different Δtexp on a) turn angle distribution b) directional-mode time distribution c) re-orientation-mode time distribution at 40x resolution.
DISCUSSION
Empirical factors for ‘bimodal’ analysis
The two empirical factors in the bimodal analysis are the criterion (example r3, r2, r1 as described in methods section) and the cut-off value of φ used (φcut) to locate the two alternating modes in the cell path. One can realize that a less stringent criterion defining a directional-mode such as the r1 criterion (see supplementary material, Fig. S2) compared to a more stringent r3 criterion would decrease the observed mean directional-mode time. The values of these two empirical factors need to be chosen by visualizing several trajectories of the cells under consideration. The φcut = 45°, was chosen empirically as a cut-off value that best succeeded in flagging the re-orientation phase on the nucleus track of the cells. The bright-field images of cells that we collected are likely to be insufficient to relate the cut-off value to any molecular mechanism. However, it could be speculated that this cut-off may relate to actin-myosin pathway. This cut-off might represent a turn made by the cell due to pronounced actin activity in a specific direction in the leading lamellipodium. A value less than this cut-off may pick up fluctuations in the cell path arising from more minor cytoskeletal re-arrangements, such as smaller lamellopodia. The r3 criterion used here to locate the beginning and end of a re-orientation phase is similar to the one used to flag the bacterial tumbles7.The data acquisition conditions used to determine the cut-off, φcut 45°, was most frequent sampling (0.5 minutes) and spatial resolution of 40x. We have tested the applicability of the criteria established to locate bacterial runs and tumbles to the mammalian cells. We find that the same framework works for mammalian cells provided that the cells are tracked frequently using a small sampling interval (0.5 minute). The application of this criterion to a different temporal resolution (say, 10 minute) might still identify the cellular turns recorded at this large sampling interval, but details of cellular turns during the 10 minutes will be lost.
Influence of pixel size
a) Distributions
The net observed position of a cell (by manually tracking the nucleus of a cell) as it moves, is affected by the pixel information available. When a cell moves from one position to another in time, it moves from one grid point to another in a 2-dimensional space formed by several small square grids. The length of the square grid depends on the pixel size calibration of the image. Under these circumstances, the value of direction change would be biased at certain angles (0, 45, −45, 90, −90, 180, −180, 135) because of division of space into square grids of the length of 1 pixel. This would be applicable under the circumstance that the cell moves by 1 pixel in each frame. This limitation of available pixel size leads to the increased probability of certain angles in the φ distribution. We call this as the ‘pixelation effect’ that leads to spikes at certain positions. It was seen that, collecting the data at higher resolution (lower pixel size in µm) could minimize this effect and relatively smoothen the φ distribution (Figs. 9a and e). The pixelation effect is more pronounced at Δtexp = 0.5 minute as the cells moves by 1 pixel unlike at Δtexp = 2.5 minutes.
A comparison of directional and re-orientation time distributions obtained from data at different resolutions at a given Δtexp, such as 0.5 minute or 2.5 minutes revealed that there was negligible influence of resolution (Figs. 9c, d, g and h). The distributions obtained from extracted 10x data have similar trend as the 40x distributions. The turn angle distribution from 40x is expected to have more pixel information compared to 10x because of pixelation effect in the φ distribution at lower resolution. Hence, the spatial resolution has a subtle influence on the turn angle distribution obtained (Figs 9b and f).
b) Parameters
There was no statistically significant effect of pixel size on mean directional time and reorientation times for all cell types (Table 2, p>0.05). The mean speed for all the cell types was found to be similar at both resolutions. The p-values from Kolmogorov-Smirnov test for comparison of mean speed at different resolutions were < 0.001 (significant) for all cell types even though the mean values are very similar. So, we ran Mann-Whitney test to confirm this and compared speed at different resolutions which gave p-values > 0.05 (not significant). Overall, there was negligible impact of resolution on the various parameters and distributions obtained.
Influence of sampling interval, Δtexp
a) Distributions
The turn angle distribution obtained with 0.5 minute data appears less noisy and more spread out compared with the distribution from 2.5 minute data (Fig. 10a). This can be explained because of more directional modes being located on a given cell trajectory with sampling time interval of 0.5 minute compared with a cell trajectory with 2.5 minute sampling time interval. For instance, the average number of directional modes in a 0.5 minute data path is 10 compared to 3 in a 2.5 minute data. Thus, the availability of more data points to average over in the case of turn angle distribution from 0.5 minute data. The same logic holds true for the directional time and re-orientation time distributions (Figs 10b and c). Using the more frequently sampled data (0.5 minute), the detailed cellular turns at this smaller time scale can be detected whereas they would not be with sparsely sampled 2.5 minute data. Because more turns are flagged, this results in smaller mean directional-mode and re-orientation-mode times with a 0.5 minute sampling interval. This shows the impact of using smaller sampling interval while collecting migration data for applying bimodal analysis.
b) Parameters
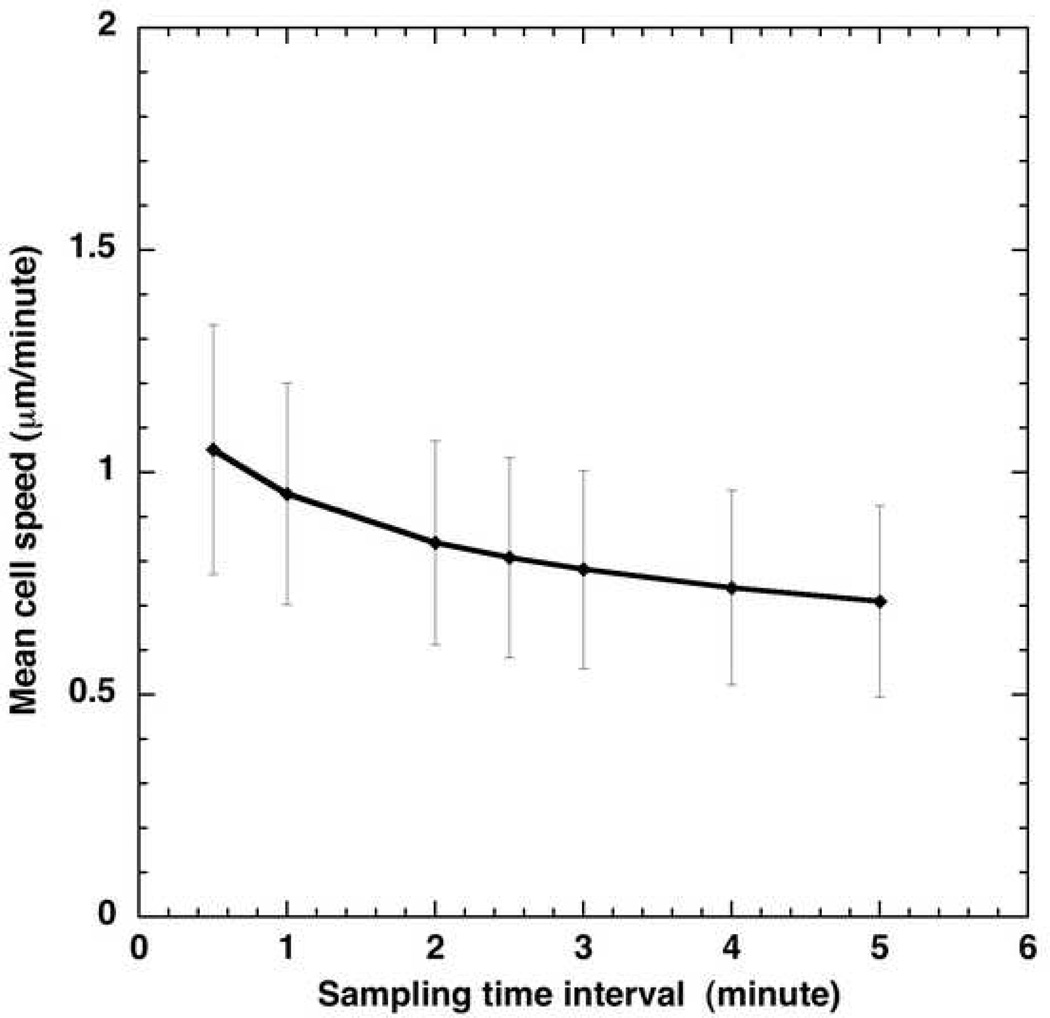
The influence of sampling interval Δtexp used for the data collection on cell parameters such as mean speed has been previously investigated 24. The net displacement of a cell over a time interval, t, would be larger if the sampling time interval at which the cell position is recorded during the course of experiment becomes smaller. The mean speed variation with Δtexp for pbabe cells is illustrated in Fig. 11. The squared difference in the measured speed at 0.5 minute sampling interval and speed at any higher sampling interval (Δtexp >0.5 minute) reduces as Δtexp approaches 0.5 minutes. The measured speed would increase as the sampling time interval is decreased. This experimental observation has been confirmed using simulations and has been discussed in details in the supplementary material (see Fig. S3 in the supplementary material).
Figure 11.
Influence of sampling time interval of observation on mean cell speed in pbabe cells.
For the bimodal analysis of the cell trajectory data, the rate at which the data was collected can play a very critical role. This is evident from the comparisons of mean directional-mode times calculated from 0.5 and 2.5 minute data (Table 1). One can see that by using the same empirical factors for locating both mode I and mode II, the mean directional-mode time for pbabe cells was found to be ~3 minutes (using 0.5 minute data) and ~18 minutes (using 2.5 minute data) at 40x. Frequently sampled data can capture the re-orientations made by a mammalian cell on a smaller time scale, which may not involve locomotion of a cell body length. This information might be lost with sparsely sampled data. We speculate that the description obtained from smaller sampling interval could be useful in getting some insight in the cytoskeletal re-arrangement arising due to more pronounced actin machinery in a specific direction. We find a statistically significant effect of sampling interval used on the values of directional-mode time, re-orientation-mode time and cell speed obtained (p≪0.05). Thus, we find that the impact of sampling time interval is more significant compared to the resolution (Table 2).
The single cell dynamics extracted here for the random migration of these epithelial cells will form the basis of performing cellular level simulations of these cells. The accuracy of the bimodal analysis technique can be assessed by identifying the reorientation phase from a known artificially created cell trajectory using cellular dynamics simulation based on the bimodal model and parameters extracted from bimodal analysis (see Fig. S1 in supplementary information). A greater insight into the migration of cancer cells both in the absence and presence of attractant gradients will clarify the sensing mechanism (see Appendix) and the effect on turn angle distributions of these eukaryotic cells, and provide the basis for incorporating individual eukaryotic cell motion into cell-based models for tissue, such as the Anderson model for tumor growth2.
Random motility coefficient, persistence and invasiveness
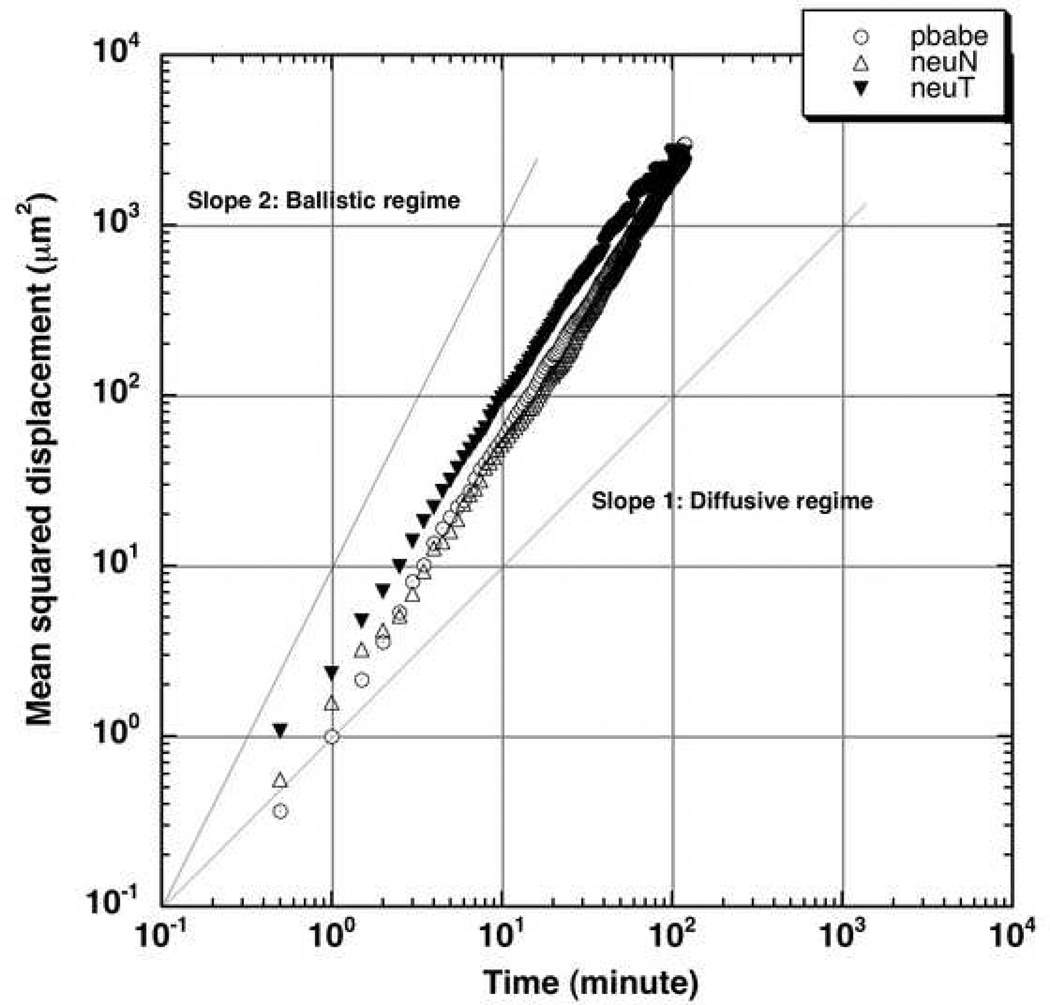
Figure 12 shows the experimental mean squared displacement of the three cell types versus time on a log-log scale. We can see that the displacement lies between the slope 2 (the ‘ballistic regime’) and slope 1 (the ‘diffusive regime’). This indicates that the two-hour experimental tracking time is not long enough for the cell motion to enter the diffusive regime, so that the random motility coefficient cannot be estimated for the relatively slow-moving MCF-10A cells and warrants the tracking of these cells for several hours to days in not so conducive conditions for cells. This problem can be circumvented by performing ‘cellular-dynamics’ simulations long enough to reach the diffusive regime, and will be the subject of a future publication.
Figure 12.
Experimental mean squared displacement versus time for the three cell types.
We have estimated the value of persistence indices for the various MCF-10A cell types using equation 3 just for the sake of getting some insight of the effect of increasing level of Her-2 expression that is, increasing invasiveness. We find that our highest resolution data (smallest sampling interval and highest spatial resolution) show an increasing persistence with increasing level of Her-2 expression from pbabe, neuN and neuT cells. This is consistent with the hallmark of cell migration in invasive tumors 17 and in cells with over expressed levels of Her-2 receptor which showed higher directional persistence in wound closure kind of assay 35.
CONCLUSIONS
The bimodal analysis of mammalian cell migration paths reveals that cellular reorientation modes could last longer than directional modes. The scenario in bacterial migration is different where the tumbles are almost instantaneous. It is also clear that the sampling interval Δtexp of observation during time-lapse microscopy should be chosen to be small enough (< 1 minute for the cell/substrate combination studied here) to capture the directional and re-orientation framework in a mammalian cell migration path using bimodal analysis. Note, however, that some properties (such as the random motility coefficient) do not depend on the sampling frequency while others, such as the cell speed and turn angle distribution, are impacted by the sampling time interval of observation.
The experimental tracking data of MCF-10A cells chemotaxing in the presence of a chemokine such as EGF could be analyzed with the bimodal analysis to get individual cellular parameters of chemotaxis. We can then hope to extend the ‘cellular dynamics’ simulation strategy developed for bacterial migration to the random migration and chemotaxis of the mammary epithelial cells using the individual cellular parameters developed from the bimodal analysis. This simulation strategy can also be modified to incorporate cell-cell adhesion, haptotaxis and other cell migration strategies to simulate cell migration more accurately. These simulations can be performed in diffusive regime to get an estimate of the cancer cell parameters such as the random motility coefficient and then chemotaxis coefficient, which can then be fed, into an existing tissue scale model of tumor invasion1, 2. This methodology can also be incorporated into the existing tumor models of cancer invasion to develop more realistic mathematical models of tumor that can help in accurate prognosis and treatment of cancer1, 2, 42. However, our important conclusion for this work is that the often-used random motility expressions for mammalian cell motion (based on assuming diffusive motion) are invalid over the time steps (order of few minutes1) typically used in modeling mammalian cell motility. The bimodal model correctly takes into account the time spent and the motion involved between directional runs, and so will lead to more appropriate quantification of the random motility of the cells, more accurately relating single-cell motion to macroscopic, population-level properties. Thus, it provides the basis for improved simulations of single-cell motion required in cell-based models of cancer growth.
Supplementary Material
ACKNOWLEDGEMENTS
This study was supported by NCI grant: Multiscale Mathematical Modeling of Cancer Invasion. Grant number: 5U54CA113007-02. We are grateful to Julie Maier and Brandy Weidow for technical assistance. The authors thank two anonymous reviewers whose thorough critiques of the original version of this manuscript led to significant improvements.
Appendix
A key finding in bacterial chemotaxis is that the turn angle distribution is unaffected by the presence of a chemoattractant, while the run time distribution is modulated (bacteria extend their run times when moving in directions of increasing chemoattractant concentration)7, thus resulting in biased movement towards increasing chemoattractant concentration. Moreover, by demonstrating that the same run time increases were induced by a spatially homogeneous but time-varying chemoattractant concentration, Berg 10 showed that E. coli were responding to the substantial derivative of the chemoattractant concentration (Dc/Dt, where c is the attractant concentration), so that the chemosensing mechanism in bacteria is related to the time rate of change in bound receptors on the cell surface. This rules out the possibility that in E. coli the chemosensory mechanism is based on the differences in the number of bound receptors over the cell surface (i.e., a direct sensing of the chemoattractant gradient by spatial comparison). A mathematical analysis of chemosensing by Berg and Purcell9 shows that despite the small cell size (~ 1 µm) spatial sensing of a chemoattractant gradient is possible for E. coli; specifically, taking into account fluctuations in chemoattractant concentration on the spatial scale of a cell, Berg and Purcell derived expressions for the minimum time required for temporal sensing, , and for spatial sensing, , given by
| (1) |
| (2) |
where a is the radius of the cell, D is the self-diffusion coefficient of the chemoattractant, N is the number of receptors on the cell surface, s is the cell-receptor radius, c̄ is the equilibrium concentration of the chemoattractant, c1/2 is the dissociation constant for the receptor-chemoattractant binding and x is the direction in which the chemoattractant gradient exists. For temporal gradients created by the movement of the cell, (1/c̄)(∂c̄/∂t)=(v/c̄)(∂c̄/∂x), where v is the cell speed. For typical values of these parameters for E. coli responding to an aspartate gradient, Berg and Purcell found (depending on magnitude of chemoattractant gradient) and for spatial sensing, . Since the run lengths of flagellated bacteria are typically of the order of 1 s and longer, this analysis suggests that a bacterium could use either temporal or spatial sensing; however, because the swimming motion of a bacterium causes the cell body to rotate, the resulting disturbance to the surrounding liquid medium would create fluctuations in the chemoattractant gradient much larger than the gradient itself, thus ruling out the spatial sensing mechanism. To perform a similar analysis for eukaryotic cells, we use the experimental conditions of Sai et al.47 for the study of chemotaxis of HL60 cells stably expressing CXCR2 receptor in a microfluidic-device-generated-gradients of CXCL8 chemokine. For these cells in this chemotaxis assay,
a = 7.5µm, D = 10−6cm2/s, c̄ = 1.25nM, c1/2 = 1.5 nM,
(1/c̄)(∂c̄/∂t)=(v/c̄)(∂c̄/∂x)=2 × 10−4s−1.
Taking Ns/(Ns+πa) = 0.5 (a typical value), and using these values in equations (1) and (2), we find that and . We note that the larger size of these cells (compared to bacteria) results in the time threshold for spatial sensing being less that that for temporal sensing; this is the reverse of the situation for bacteria, in which the time threshold for spatial sensing is greater than that for temporal sensing. From the bimodal analysis of the MCF-10A cells reported here, we find that the mean directional-mode time duration of these cancer cells ranges in several minutes compared to bacterial run times of seconds. Hence both temporal and spatial sensing mechanisms remain feasible for these eukaryotic cells.
REFERENCES
- 1.Anderson ARA. A hybrid mathematical model of solid tumour invasion: The importance of cell adhesion. Math. Med. Biol. 2005;22:163–186. doi: 10.1093/imammb/dqi005. [DOI] [PubMed] [Google Scholar]
- 2.Anderson ARA, Weaver AM, Cummings PT, Quaranta V. Tumor morphology and phenotypic evolution driven by selective pressure from the microenvironment. Cell. 2006;127:905–915. doi: 10.1016/j.cell.2006.09.042. [DOI] [PubMed] [Google Scholar]
- 3.Arrieumerlou C, Meyer T. A local coupling model and compass parameter for eukaryotic chemotaxis. Dev. Cell. 2005;8:215–227. doi: 10.1016/j.devcel.2004.12.007. [DOI] [PubMed] [Google Scholar]
- 4.Bargmann CI, Hung MC, Weinberg RA. Multiple independent activations of the neu oncogene by a point mutation altering the transmembrane domain of p185. Cell. 1986;45:649–657. doi: 10.1016/0092-8674(86)90779-8. [DOI] [PubMed] [Google Scholar]
- 5.Barton JW, Ford RM. Determination of effective transport-coefficients for bacterial migration in sand columns. Appl. Environ. Microbiol. 1995;61:3329–3335. doi: 10.1128/aem.61.9.3329-3335.1995. [DOI] [PMC free article] [PubMed] [Google Scholar]
- 6.Berg HC. Bacterial behavior. Nature. 1975;254:389–392. doi: 10.1038/254389a0. [DOI] [PubMed] [Google Scholar]
- 7.Berg HC, Brown DA. Chemotaxis in escherichia-coli analyzed by 3-dimensional tracking. Nature. 1972;239:500–504. doi: 10.1038/239500a0. [DOI] [PubMed] [Google Scholar]
- 8.Berg HC, Brown DA. Chemotaxis in escherichia coli analyzed by threedimensional tracking. Addendum. Antibiot. Chemother. 1974;19:55–78. doi: 10.1159/000395424. [DOI] [PubMed] [Google Scholar]
- 9.Berg HC, Purcell EM. Physics of chemoreception. Biophys. J. 1977;20:193–219. doi: 10.1016/S0006-3495(77)85544-6. [DOI] [PMC free article] [PubMed] [Google Scholar]
- 10.Berg HC, Tedesco PM. Transient-response to chemotactic stimuli in escherichia-coli. Proc. Natl. Acad. Sci. U. S. A. 1975;72:3235–3239. doi: 10.1073/pnas.72.8.3235. [DOI] [PMC free article] [PubMed] [Google Scholar]
- 11.Bergman AJ, Zygourakis K. Migration of lymphocytes on fibronectin-coated surfaces: Temporal evolution of migratory parameters. Biomaterials. 1999;20:2235–2244. doi: 10.1016/s0142-9612(99)00154-4. [DOI] [PubMed] [Google Scholar]
- 12.Bray D. Cell movements: From molecules to motility. NY: Garland Publishing; 2001. p. 372. [Google Scholar]
- 13.Chambers AF, Groom AC, MacDonald IC. Dissemination and growth of cancer cells in metastatic sites. Nat. Rev. Cancer. 2002;2:563–572. doi: 10.1038/nrc865. [DOI] [PubMed] [Google Scholar]
- 14.Condeelis J, Segall JE. Intravital imaging of cell movement in tumours. Nat. Rev. Cancer. 2003;3:921–930. doi: 10.1038/nrc1231. [DOI] [PubMed] [Google Scholar]
- 15.Dai LS, Alt W, Schilling K, Retzlik J, Gieselmann V, Magin TM, Kappler J. A fast and robust quantitative time-lapse assay for cell migration. Exp. Cell Res. 2005;311:272–280. doi: 10.1016/j.yexcr.2005.09.013. [DOI] [PubMed] [Google Scholar]
- 16.Debnath J, Muthuswamy SK, Brugge JS. Morphogenesis and oncogenesis of mcf-10a mammary epithelial acini grown in three-dimensional basement membrane cultures. Methods. 2003;30:256–268. doi: 10.1016/s1046-2023(03)00032-x. [DOI] [PubMed] [Google Scholar]
- 17.Deisboeck TS, Demuth T, Mansury Y. Correlating velocity patterns with spatial dynamics in glioma cell migration. Acta Biotheor. 2005;53:181–190. doi: 10.1007/s10441-005-2527-1. [DOI] [PubMed] [Google Scholar]
- 18.Dickinson RB, Tranquillo RT. Optimal estimation of cell-movement indexes from the statistical-analysis of cell tracking data. AICHE J. 1993;39:1995–2010. [Google Scholar]
- 19.Dickinson RB, Tranquillo RT. Transport-equations and indexes for random and biased cell-migration based on single-cell properties. SIAM J. Appl. Math. 1995;55:1419–1454. [Google Scholar]
- 20.Dimilla PA, Quinn JA, Albelda SM, Lauffenburger DA. Measurement of individual cell-migration parameters for human tissue-cells. AICHE J. 1992;38:1092–1104. [Google Scholar]
- 21.Duffy KJ, Cummings PT, Ford RM. Random-walk calculations for bacterial migration in porous-media. Biophys. J. 1995;68:800–806. doi: 10.1016/S0006-3495(95)80256-0. [DOI] [PMC free article] [PubMed] [Google Scholar]
- 22.Duffy KJ, Ford RM. Turn angle and run time distributions characterize swimming behavior for pseudomonas putida. J. Bacteriol. 1997;179:1428–1430. doi: 10.1128/jb.179.4.1428-1430.1997. [DOI] [PMC free article] [PubMed] [Google Scholar]
- 23.Duffy KJ, Ford RM, Cummings PT. Residence time calculation for chemotactic bacteria within porous media. Biophys. J. 1997;73:2930–2936. doi: 10.1016/S0006-3495(97)78321-8. [DOI] [PMC free article] [PubMed] [Google Scholar]
- 24.Dunn GA. Characterising a kinesis response; time averaged measures of cell speed and directional persistence. Agents Actions Suppl. 1983;12:14–33. doi: 10.1007/978-3-0348-9352-7_1. [DOI] [PubMed] [Google Scholar]
- 25.Dunn GA, Brown AF. A unified approach to analyzing cell motility. J. Cell Sci. 1987;8:81–102. doi: 10.1242/jcs.1987.supplement_8.5. [DOI] [PubMed] [Google Scholar]
- 26.Ford RM, Cummings PT. On the relationship between cell balance-equations for chemotactic cell-populations. SIAM J. Appl. Math. 1992;52:1426–1441. [Google Scholar]
- 27.Ford RM, Cummings PT. Koch AL, Robinson JA, Milliken GA. Chapman and hall microbiology series; mathematical modeling in microbial ecology. 1998. Mathematical models of bacterial chemotaxis. Number of 228–269. [Google Scholar]
- 28.Frymier PD, Ford RM, Berg HC, Cummings PT. 3-dimensional tracking of motile bacteria near a solid planar surface. Proc. Natl. Acad. Sci. U. S. A. 1995;92:6195–6199. doi: 10.1073/pnas.92.13.6195. [DOI] [PMC free article] [PubMed] [Google Scholar]
- 29.Frymier PD, Ford RM, Cummings PT. Cellular-dynamics simulations of bacterial chemotaxis. Chem. Eng. Sci. 1993;48:687–699. [Google Scholar]
- 30.Gail MH, Boone CW. Locomotion of mouse fibroblasts in tissue culture. Biophys. J. 1970;10:980–993. doi: 10.1016/S0006-3495(70)86347-0. [DOI] [PMC free article] [PubMed] [Google Scholar]
- 31.Harms BD, Bassi GM, Horwitz AR, Lauffenburger DA. Directional persistence of egf-induced cell migration is associated with stabilization of lamellipodial protrusions. Biophys. J. 2005;88:1479–1488. doi: 10.1529/biophysj.104.047365. [DOI] [PMC free article] [PubMed] [Google Scholar]
- 32.Ionides EL, Fang KS, Isseroff RR, Oster GF. Stochastic models for cell motion and taxis. J. Math. Biol. 2004;48:23–37. doi: 10.1007/s00285-003-0220-z. [DOI] [PubMed] [Google Scholar]
- 33.Jourquin J, Yang N, Kam Y, Guess C, Quaranta V. Dispersal of epithelial cancer cell colonies by lysophosphatidic acid (lpa) J. Cell. Physiol. 2006;206:337–346. doi: 10.1002/jcp.20470. [DOI] [PubMed] [Google Scholar]
- 34.Kouvroukoglou S, Dee KC, Bizios R, McIntire LV, Zygourakis K. Endothelial cell migration on surfaces modified with immobilized adhesive peptides. Biomaterials. 2000;21:1725–1733. doi: 10.1016/s0142-9612(99)00205-7. [DOI] [PubMed] [Google Scholar]
- 35.Kumar N, Zaman MH, Kim HD, Lauffenburger DA. A high-throughput migration assay reveals her2-mediated cell migration arising from increased directional persistence. Biophys. J. 2006;91:L32–L34. doi: 10.1529/biophysj.106.088898. [DOI] [PMC free article] [PubMed] [Google Scholar]
- 36.Le Douarin NM. Cell migrations in embryos. Cell. 1984;38:353–360. doi: 10.1016/0092-8674(84)90490-2. [DOI] [PubMed] [Google Scholar]
- 37.Maheshwari G, Wiley HS, Lauffenburger DA. Autocrine epidermal growth factor signaling stimulates directionally persistent mammary epithelial cell migration. J. Cell Biol. 2001;155:1123–1128. doi: 10.1083/jcb.200109060. [DOI] [PMC free article] [PubMed] [Google Scholar]
- 38.Martens L, Monsieur G, Ampe C, Gevaert K, Vandekerckhove J. Cell_motility: A cross-platform, open source application for the study of cell motion paths. BMC Bioinformatics. 2006;7:289–294. doi: 10.1186/1471-2105-7-289. [DOI] [PMC free article] [PubMed] [Google Scholar]
- 39.Othmer HG, Dunbar SR, Alt W. Models of dispersal in biological-systems. J. Math. Biol. 1988;26:263–298. doi: 10.1007/BF00277392. [DOI] [PubMed] [Google Scholar]
- 40.Pankov R, Endo Y, Even-Ram S, Araki M, Clark K, Cukierman E, Matsumoto K, Yamada KM. A rac switch regulates random versus directionally persistent cell migration. J. Cell Biol. 2005;170:793–802. doi: 10.1083/jcb.200503152. [DOI] [PMC free article] [PubMed] [Google Scholar]
- 41.Parkhurst MR, Saltzman WM. Quantification of human neutrophil motility in 3-dimensional collagen gels - effect of collagen concentration. Biophys. J. 1992;61:306–315. doi: 10.1016/S0006-3495(92)81838-6. [DOI] [PMC free article] [PubMed] [Google Scholar]
- 42.Quaranta V, Weaver AM, Cummings PT, Anderson ARA. Mathematical modeling of cancer: The future of prognosis and treatment. Clin. Chim. Acta. 2005;357:173–179. doi: 10.1016/j.cccn.2005.03.023. [DOI] [PubMed] [Google Scholar]
- 43.Rabut G, Ellenberg J. Automatic real-time three-dimensional cell tracking by fluorescence microscopy. J. Microsc.-Oxf. 2004;216:131–137. doi: 10.1111/j.0022-2720.2004.01404.x. [DOI] [PubMed] [Google Scholar]
- 44.Rembold M, Loosli F, Adams RJ, Wittbrodt J. Individual cell migration serves as the driving force for optic vesicle evagination. Science. 2006;313:1130–1134. doi: 10.1126/science.1127144. [DOI] [PubMed] [Google Scholar]
- 45.Ridley AJ, Schwartz MA, Burridge K, Firtel RA, Ginsberg MH, Borisy G, Parsons JT, Horwitz AR. Cell migration: Integrating signals from front to back. Science. 2003;302:1704–1709. doi: 10.1126/science.1092053. [DOI] [PubMed] [Google Scholar]
- 46.Rivero MA, Tranquillo RT, Buettner HM, Lauffenburger DA. Transport models for chemotactic cell-populations based on individual cell behavior. Chem. Eng. Sci. 1989;44:2881–2897. [Google Scholar]
- 47.Sai JQ, Walker G, Wikswo J, Richmond A. The il sequence in the llkil motif in cxcr2 is required for full ligand-induced activation of erk, akt, chemotaxis in hl60 cells. J. Biol. Chem. 2006;281:35931–35941. doi: 10.1074/jbc.M605883200. [DOI] [PMC free article] [PubMed] [Google Scholar]
- 48.Schechter AL, Stern DF, Vaidyanathan L, Decker SJ, Drebin JA, Greene MI, Weinberg RA. The neu oncogene - an erb-b-related gene encoding a 185,000-mr tumor-antigen. Nature. 1984;312:513–516. doi: 10.1038/312513a0. [DOI] [PubMed] [Google Scholar]
- 49.Schneider IC, Haugh JM. Mechanisms of gradient sensing and chemotaxis - conserved pathways, diverse regulation. Cell Cycle. 2006;5:1130–1134. doi: 10.4161/cc.5.11.2770. [DOI] [PubMed] [Google Scholar]
- 50.Selmeczi D, Mosler S, Hagedorn PH, Larsen NB, Flyvbjerg H. Cell motility as persistent random motion: Theories from experiments. Biophys. J. 2005;89:912–931. doi: 10.1529/biophysj.105.061150. [DOI] [PMC free article] [PubMed] [Google Scholar]
- 51.Stokes CL, Lauffenburger DA, Williams SK. Migration of individual microvessel endothelial-cells - stochastic-model and parameter measurement. J. Cell Sci. 1991;99:419–430. doi: 10.1242/jcs.99.2.419. [DOI] [PubMed] [Google Scholar]
- 52.Ware MF, Wells A, Lauffenburger DA. Epidermal growth factor alters fibroblast migration speed and directional persistence reciprocally and in a matrixdependent manner. J. Cell Sci. 1998;111:2423–2432. doi: 10.1242/jcs.111.16.2423. [DOI] [PubMed] [Google Scholar]
Associated Data
This section collects any data citations, data availability statements, or supplementary materials included in this article.


